
The cryptocurrency sector has dropped significantly as bears took over the market. Bitcoin is currently trading for $18,315, representing a decrease of 4.50% compared to our last report. Meanwhile, Ethereum’s price has decreased by 6.17% on the day, while XRP managed to lose 7.73%.

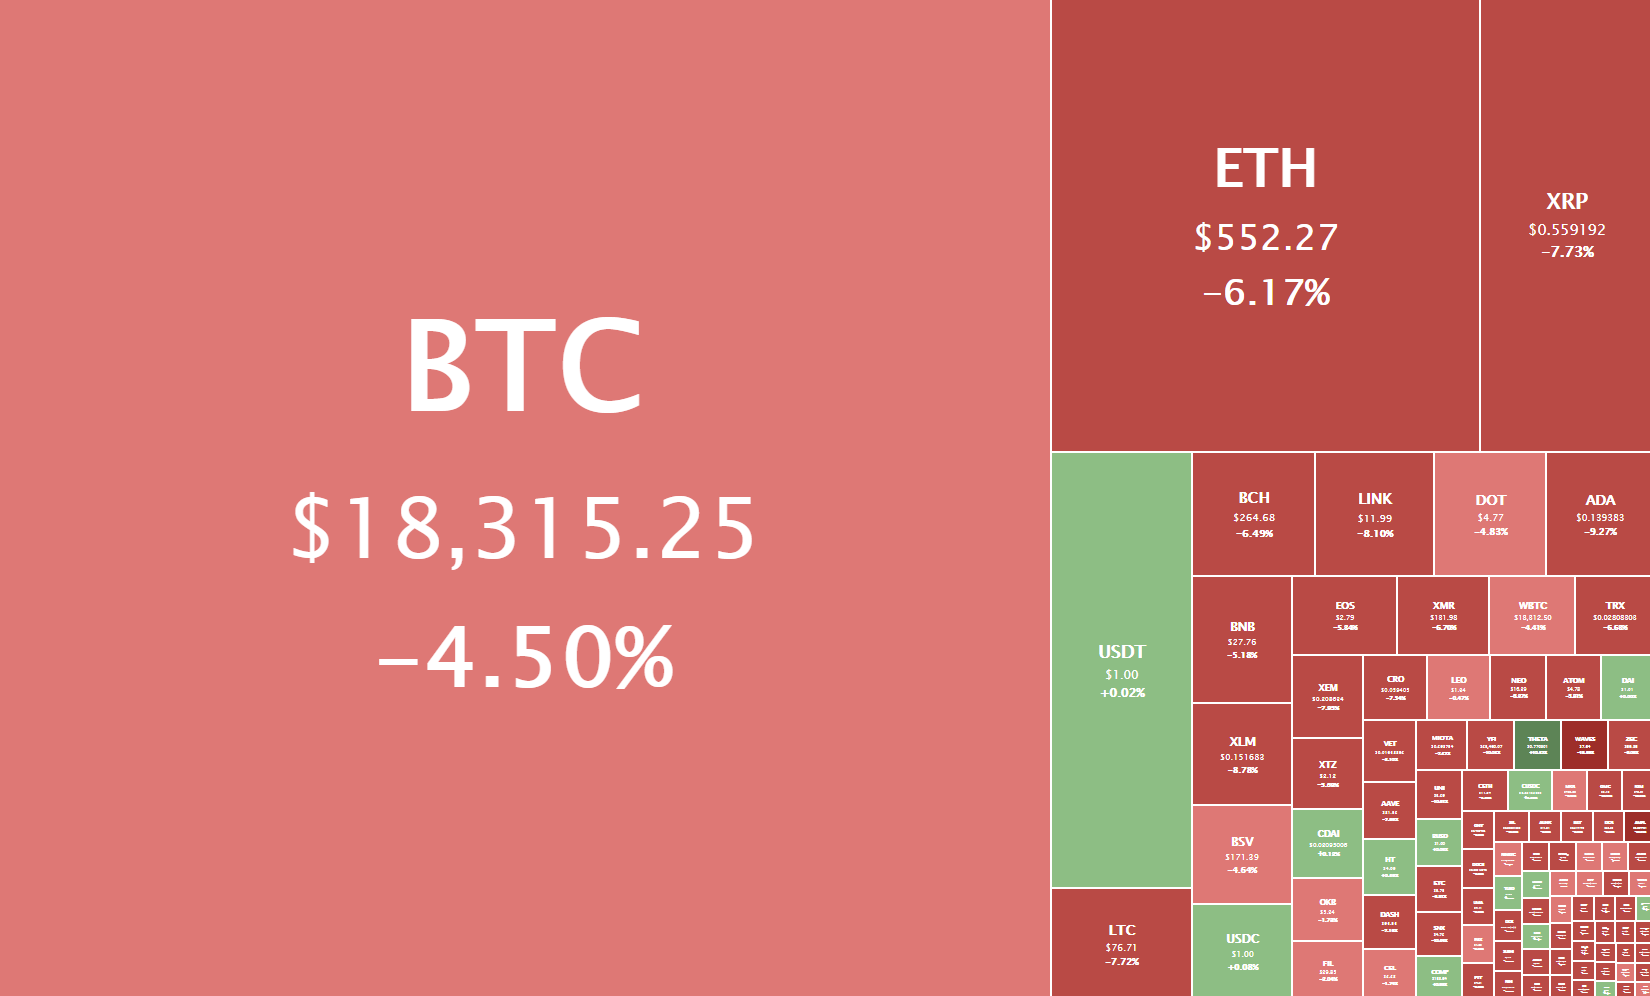
Daily Crypto Sector Heat Map
ALL BEST ICO gained 19,990.71% in the past 24 hours, making it the most prominent daily crypto gainer by far. It is followed by COIL’s 151.88% and Amun Bitcoin 3x Daily Short’s 112.92% gain. On the other hand, Monavale lost 54.51%, making it the most prominent daily loser. It is followed by KIMCHI.finance’s loss of 52.82% and Iteration Syndicate’s loss of 51.70%.
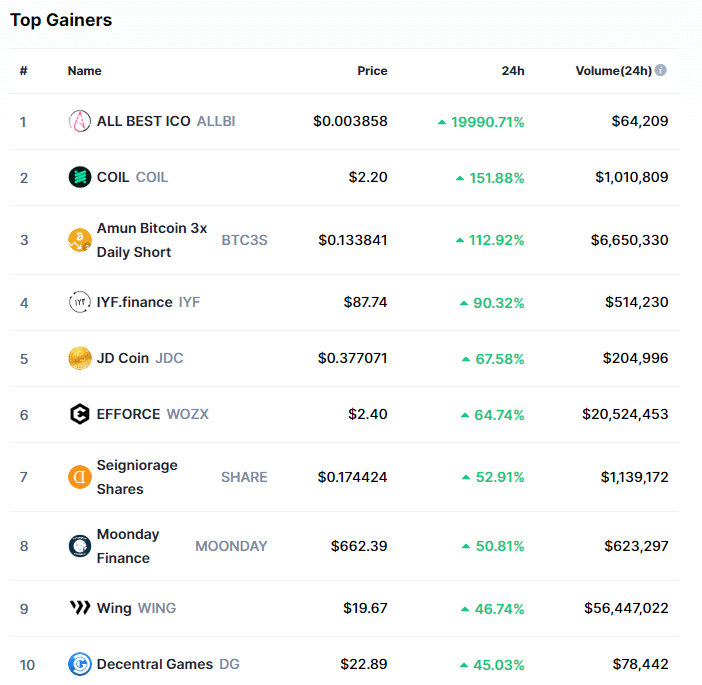
Top 10 24-hour Performers (Click to enlarge)
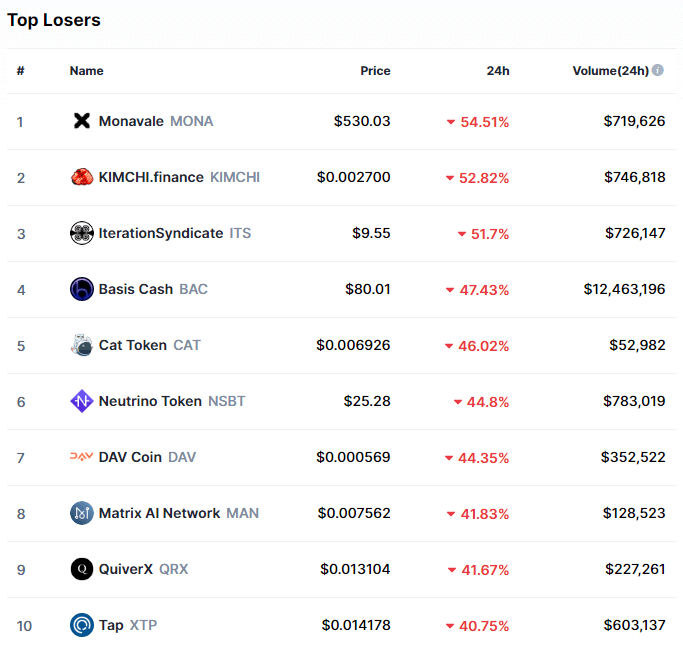
Bottom 10 24-hour Performers (Click to enlarge)
Bitcoin’s market dominance has moved to the upside just under half a percent since we last reported, with its value currently being 63%. This value represents a difference of 0.4% to the upside when compared to yesterday’s value.
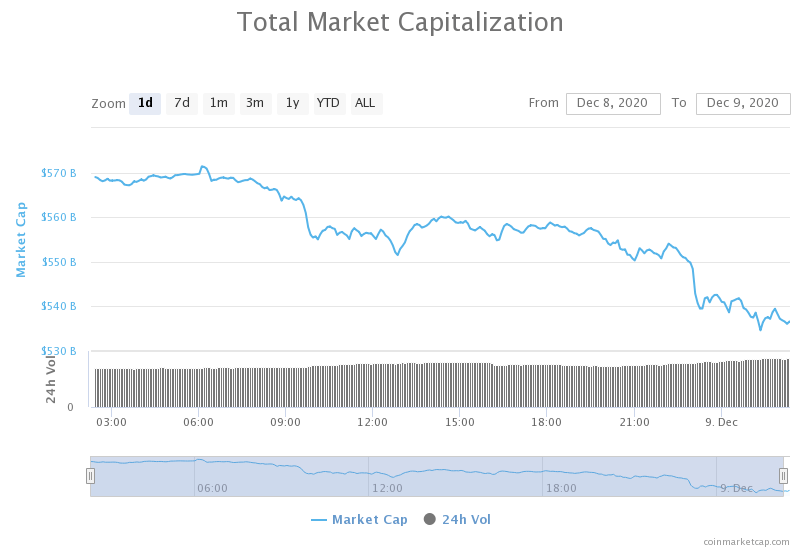
Daily Crypto Market Cap Chart
The crypto sector capitalization has decreased significantly in the past 24 hours, with its current value being $536.08 billion. This represents a $32.76 billion decrease when compared to our previous report.
_______________________________________________________________________
What happened in the past 24 hours?
_______________________________________________________________________
- Mt. Gox Users Prepare to Get Back $2.6 Billion of Bitcoin (Cryptobriefing)
- Bitcoin Investors Tested by Stimulus and Vaccine News (Cryptobriefing)
- More than 100,000 ETH locked for staking via Kraken in four days (Cointelegraph)
- Bitcoin Price Drops $1,000 in Worst Sell-Off in a Week (Coindesk)
- “Strong support” for crypto industry regulation at recent G7 meeting (Cryptoslate)
- MicroStrategy shares drop 8% after the announcement of $400m debt raise to buy Bitcoin (Cryptoslate)
- Report: South Korean authorities charge Coinbit executives with market manipulation (The Block)
- Exchanges brace as regulators turn the spotlight on crypto mixing services (The Block)
- France on the verge of imposing mandatory KYC policy for all crypto transactions, industry sources say (The Block)
- A newly-described ‘blockchain denial of service’ attack could convince miners to stop mining (The Block)
_______________________________________________________________________
Technical analysis
_______________________________________________________________________
Bitcoin
After spending the past couple of days in a very narrow range, Bitcoin has finally made a move as bears took over the market. The price went down rapidly and reached as low as $18,000 at one point, but then went slightly above this crucial level.
While Bitcoin is safe from breaking $18,000 to the downside at the moment, Micheal van de Poppe pointed out that a large CME gap is looming. The gap ranges from $18,275 to $16,995.
Lastly, the Hash Ribbons indicator has posted a buy signal, giving long-term investors the green light to invest in Bitcoin. This indicator has proven itself one of the best RoI indicators for Bitcoin when it comes to long-term investing.
BTC/USD 4-hour chart
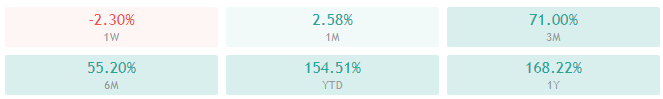
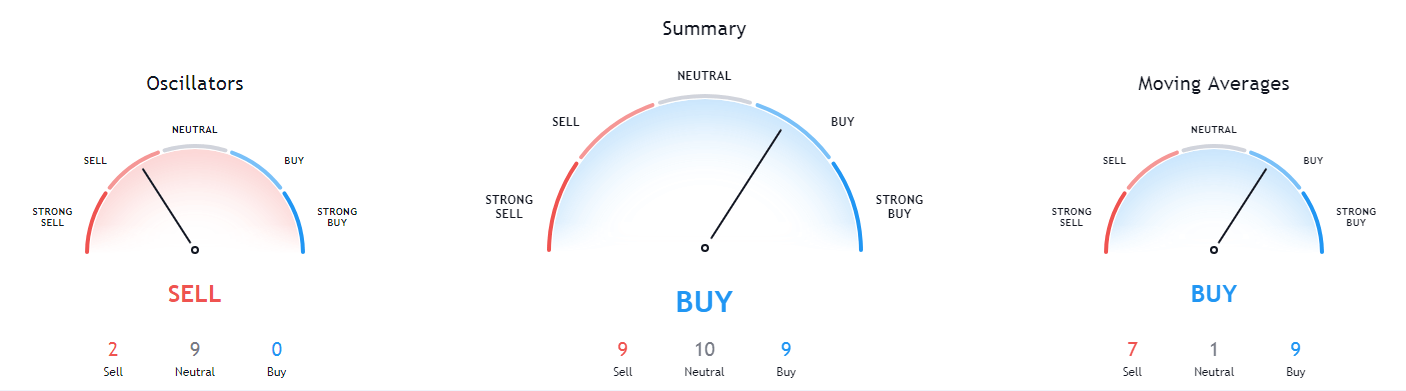
Bitcoin’s long-term technicals (weekly and monthly) are completely tilted towards the buy-side, while its daily overview is still bullish but showing slight signs of neutrality. On the other hand, its 4-hour overview is completely bearish.
BTC/USD 1-day Technicals
Technical factors (4-hour Chart):
- Price is currently below both its 50-period EMA and its 21-period EMA
- Price is at its bottom Bollinger band
- RSI is close to being oversold (31.73)
- Volume is average
Key levels to the upside Key levels to the downside
1: $18,600 1: $18,190
2: $18,790 2: $17,780
3: $19,000 3: $17,200
Ethereum

Ethereum wasn’t immune to the downturn either, with its price dropping from the sub-$600 levels all the way down to just above $550. Unlike Bitcoin, however, there are no CME gaps to worry about, and Ethereum seems quite stable above $550.
The only thing to worry about when anticipating Ether’s next price move is Bitcoin’s movement. At the moment, Bitcoin is dictating all consolidations, as well as large moves in either direction.
ETH/USD 4-hour Chart
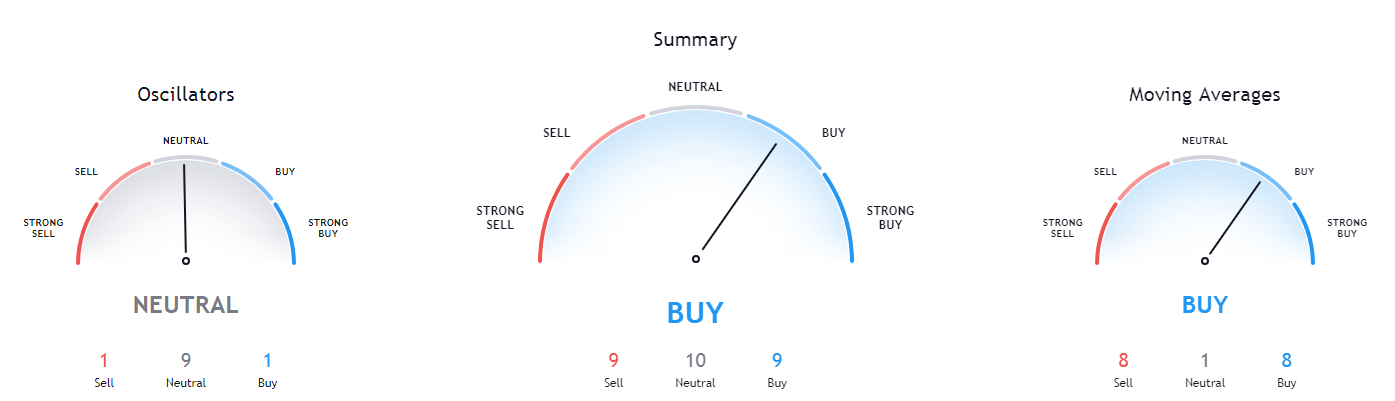
Ethereum’s monthly overview shows a full tilt towards the buy-side, while its daily and weekly overviews still show some signs of neutrality. On the other hand, its 4-hour overview is bearish but shows slight signs of neutrality.
ETH/USD 1-day Technicals
Technical Factors (4-hour Chart):
- The price is currently below both its 50-period EMA and its 21-period EMA
- Price is at its bottom Bollinger band
- RSI is in the oversold territory (28.61)
- Volume is above average
Key levels to the upside Key levels to the downside
1: $565 1: $550
2: $582 2: $525
3: $600 3: $510
Ripple
The fourth-largest cryptocurrency by market cap moved to the downside as well, with its $0.545 support level holding up as the last-resort support. XRP is currently stable and trading between $0.545 to the downside and $0.571 to the upside, with its price, seemingly creating a double bottom (today and on Dec 5).
XRP traders might want to (still) refrain from trading XRP simply due to the disbalance of the risk and reward, as well as due to its low volatility.
XRP/USD 4-hour Chart
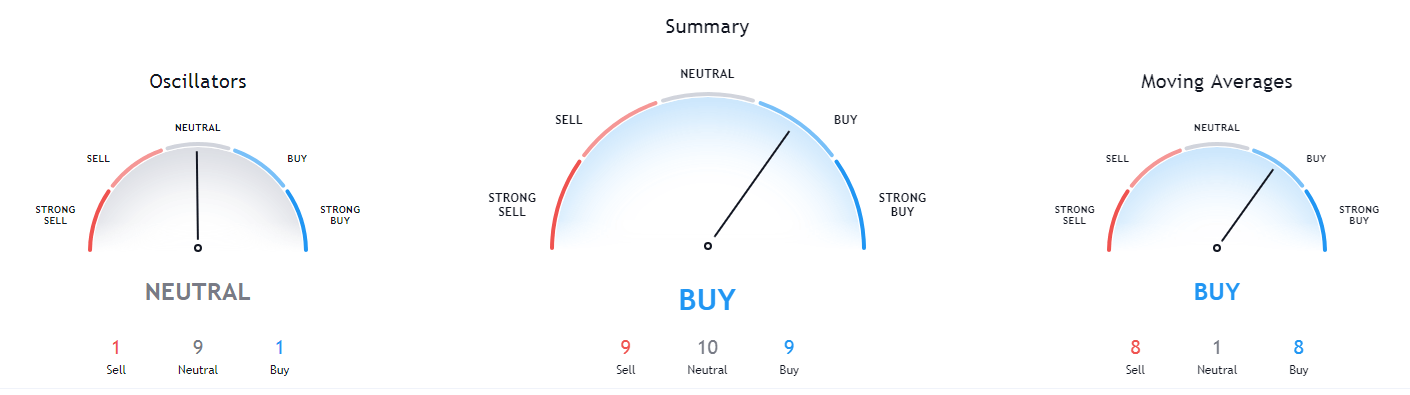
XRP’s longer weekly and monthly time-frames show complete bullishness, while its 4-hour overview is completely bearish. Its daily overview is still bullish but shows some signs of neutrality or even some bearishness.
XRP/USD 1-day Technicals
Technical factors (4-hour Chart):
- The price is currently below both its 50-period EMA, as well as its 21-period EMA
- Price is at its bottom Bollinger band
- RSI is close to being oversold (34.36)
- Volume is slightly above average
Key levels to the upside Key levels to the downside
1: $0.571 1: $0.545
2: $0.6 2: $0.5
3: $0.63 3: $0.475
Related posts
 Daily Crypto Review, Apr 9 – BCH surges after halving, BSV outperforming
 Daily Crypto Review, Apr 17 – Bitcoin above $7,000; The US expanding on the idea of the Digital Dollar
 Daily Crypto Review, Apr 20 – Blockchain Jobs Booming; Lightning Network Unsafe?
 Daily Crypto Review, August 18 – Crypto Fundamentals Booming: Bitcoin Above $12,000; XRP Skyrocketing to $0.315