
The majority of the cryptocurrency sector ended up being in the slight green since we last reported, with Bitcoin trying to reach the all-time highs (though so-far unsuccessfully). Bitcoin is currently trading for $19,106, representing an increase of 0.15% compared to yesterday’s value. Meanwhile, Ethereum’s price has decreased by 0.32% on the day, while XRP managed to lose 2.97%.

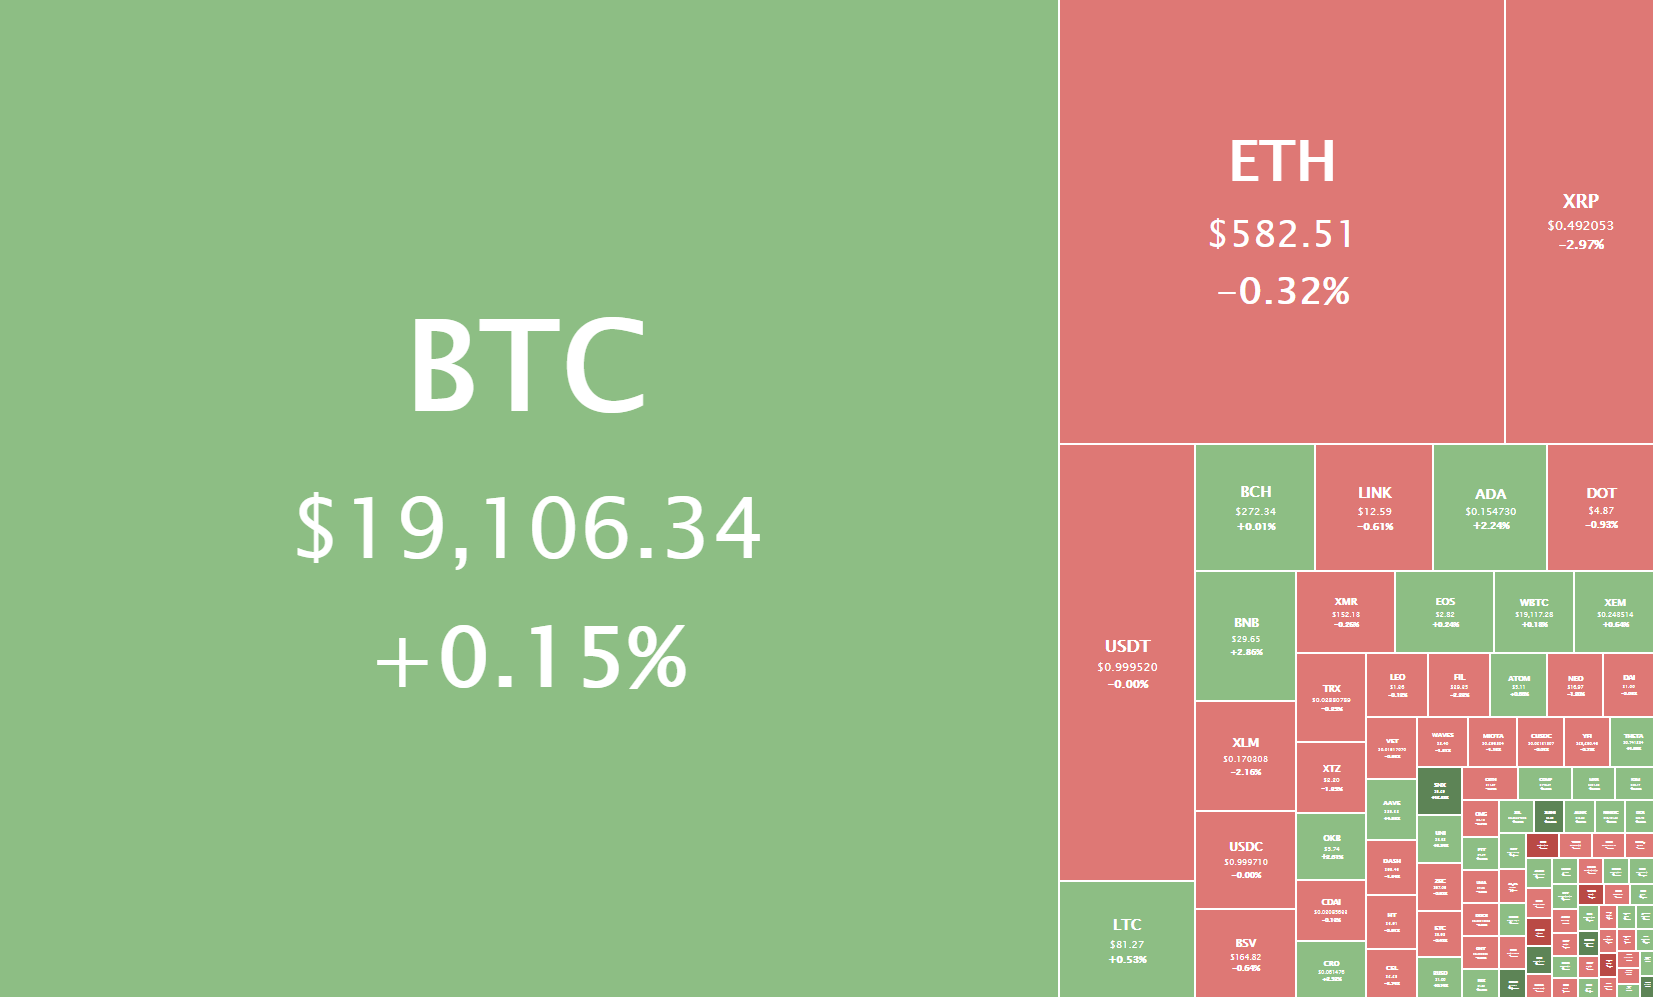
Daily Crypto Sector Heat Map
Mandi Token gained 175.35% in the past 24 hours, making it the most prominent daily crypto gainer by far. It is followed by yTSLA Finance’s 169.53% and DefHold’s 129.84% gain. On the other hand, DistX lost 98.32%, making it the most prominent daily loser. It is followed by AC Index’s loss of 94.05% and YXO’s loss of 43.16%.
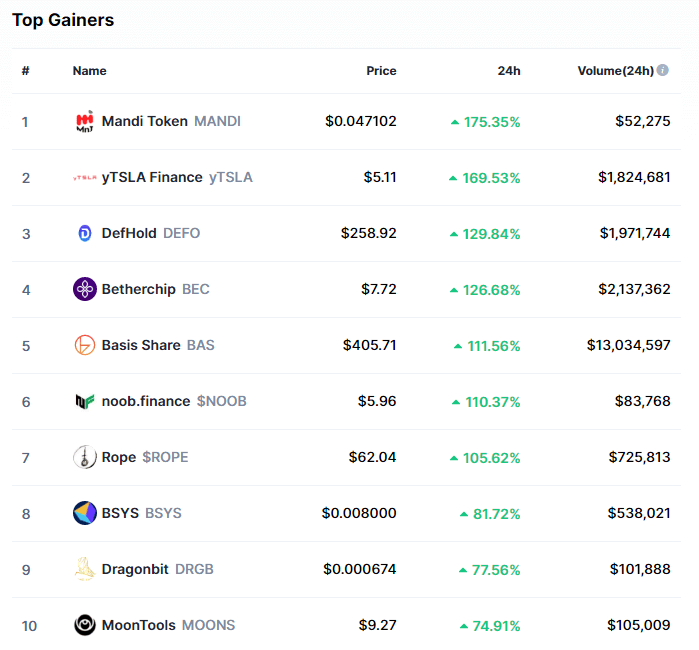
Top 10 24-hour Performers (Click to enlarge)
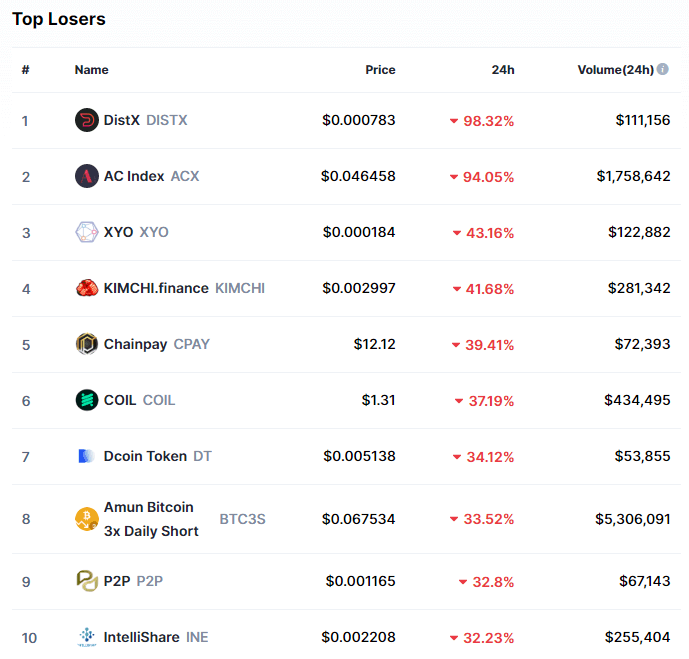
Bottom 10 24-hour Performers (Click to enlarge)
Bitcoin’s market dominance has moved up very slightly since our last report, with its value currently being 63.5%. This value represents a 0.2% difference to the upside compared to the value it had when we last reported.

Daily Crypto Market Cap Chart
The cryptocurrency sector capitalization has increased since we last reported, with its current value being $569.80 billion. This represents a $9.01 billion increase when compared to our previous report.
_______________________________________________________________________
What happened in the past 24 hours?
_______________________________________________________________________
- Kraken clients have deposited more than 160,000 ETH into its Eth2 staking service (The Block)
- Microsoft and EY unveil blockchain contract management platform for gaming partners and content creators (The Block)
- Whales Block Bitcoin, Ethereum From Reaching Highs (Cryptobriefing)
- BitMEX Will Introduce Bitcoin SegWit Support (Cryptobriefing)
- Flare Airdrop Snapshot Ushers in Ripple’s DeFi Era (Cryptobriefing)
- Why this trader says Ethereum may rally harder than Bitcoin in a new bull cycle (Cryptoslate)
- JPMorgan calls Bitcoin institutional purchases a “milestone” (Cryptoslate)
- Fidelity CEO Abigail Johnson takes rare interview, expresses excitement about Bitcoin (Cryptoslate)
- Mergers Position Yearn Finance as the Amazon of DeFi (Coindesk)
- Shock survey suggests most investors think Bitcoin won’t top $50K by 2030 (Cointelegraph)
_______________________________________________________________________
Technical analysis
_______________________________________________________________________
Bitcoin
Bitcoin had quite an interesting day as it (at one point) tried to push towards the all-time highs, or at least towards its next resistance level (sitting at $19,666). However, the sheer resistance near the $20k level was immense, and the largest cryptocurrency by market cap dipped to its immediate support level ($19,100), which is where it’s at right now.
The data provided by various sources point to Bitcoin whales blocking the way towards and past $20k, despite all the bullish sentiment currently surrounding the cryptocurrency.
BTC/USD 4-hour chart
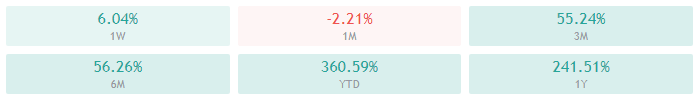
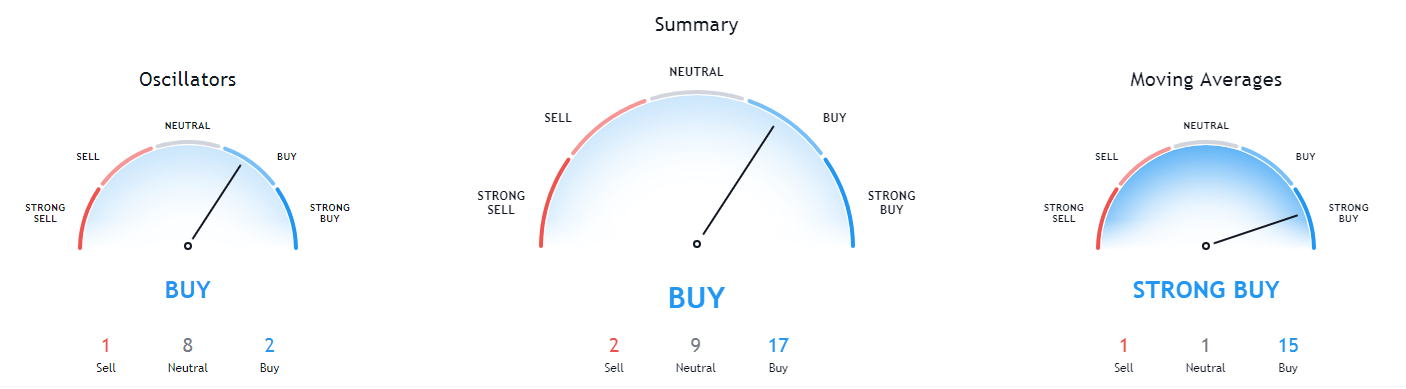
Bitcoin’s overview on all time-frames is fully bullish, with its monthly time-frame being slightly more tilted to the neutral side than the rest.

BTC/USD 1-day Technicals
Technical factors (4-hour Chart):
- Price is above its 50-period and slightly above its 21-period EMA
- Price is near its middle Bollinger band
- RSI is neutral (55.33)
- Volume is average when compared to the past week
Key levels to the upside Key levels to the downside
1: $19,100 1: $18,600
2: $19,666 2: $18,190
3: $20,000 3: $17,800
Ethereum
Ethereum was in the same boat as Bitcoin for the past couple of days, with its price movement mirroring Bitcoin’s. Ether tried to move towards the $600 mark, but got stopped out just below it, triggering a pullback to its immediate support level ($581). However, its downside is well-guarded, both by the $581 support level and the 4-hour 21-period moving average.
Ethereum will most likely continue mirroring Bitcoin’s moves in the short future, meaning that traders should either focus on trading Bitcoin or pay close attention to its movements while trading Ether.
ETH/USD 4-hour Chart
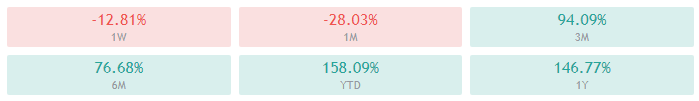
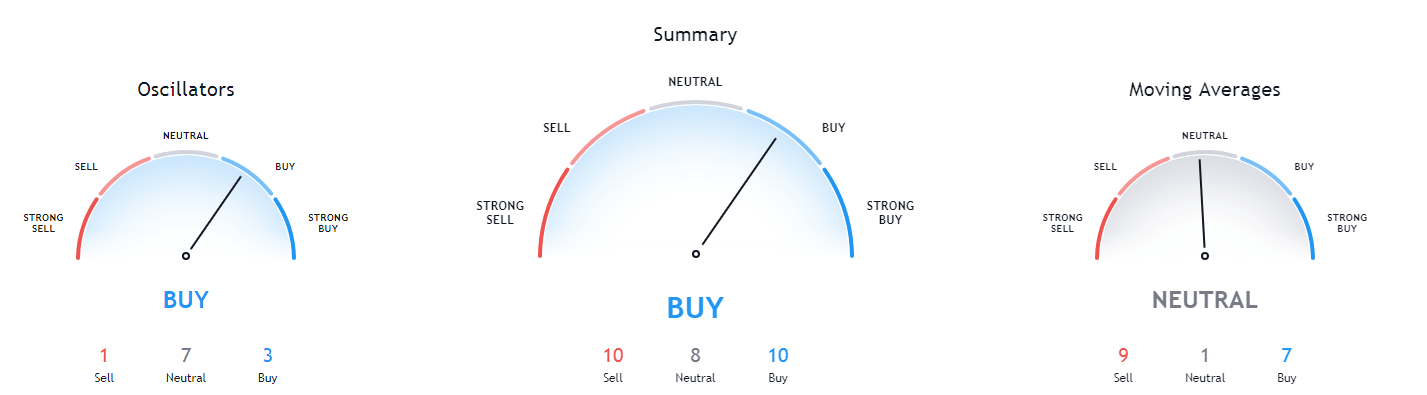
Ethereum’s overview on all time-frames is fully bullish, with its weekly time-frame being slightly more tilted to the neutral side than the rest.
ETH/USD 1-day Technicals
Technical Factors (4-hour Chart):
- Price is slightly above both its 50-period and 21-period EMAs
- Price is near its middle Bollinger band
- RSI is neutral (53.74)
- Volume is slightly below average when compared to the previous week
Key levels to the upside Key levels to the downside
1: $600 1: $581
2: $632 2: $565
3: $636.5 3: $545
Ripple
XRP is one of the cryptocurrencies that rarely mirrors Bitcoin’s movements, and that was the case in the past 24 hours as well. However, the fact that its price doesn’t mirror the largest cryptocurrency was bad news lately. XRP’s price continued its slow descent, this time breaking the $0.5 mark to the downside. At one point, there was an attempt to regain this level, which got shut down pretty quickly.
While the overall crypto sector is surrounded by bullish sentiment, XRP is looking quite bearish in the short-term. Shorting the fourth-largest cryptocurrency by market cap can be a valid trading strategy, simply due to its consistency going down in recent days.
XRP/USD 4-hour Chart
XRP’s longer-term technicals are completely bullish, while its daily overview is slightly more tilted towards neutrality. Its 4-hour time-frame, however, is slightly tilted towards the sell-side.
XRP/USD 1-day Technicals
Technical factors (4-hour Chart):
- Its price is currently below its 50-period EMA and slightly below its 21-period EMA
- Price is between its middle and bottom Bollinger band
- RSI is neutral (37.98)
- Volume is well below its average level
Key levels to the upside Key levels to the downside
1: $0.5 1: $0.475
2: $0.543 2: $0.45
3: $0.57 3: $0.425
Related posts
 Daily Crypto Review, Apr 8 – BCH and BSV halving countdown; Cryptos consolidating after a move up
 Daily Crypto Review, August 11 – yEarn Finance Token Explodes After Binance Listing; BTC Hashrate Unaffected by the Price Upswing
 Daily Crypto Review, August 20 – ETH Plummets Due To Skyrocketing Transaction Fees; $12,000 Level Too Strong For Bitcoin
 Daily Crypto Review, Dec 18 – Bitcoin at $23,000; Crypto Sector Preparing for the Next Move