
The cryptocurrency sector was mostly stable today as Bitcoin kept within its trading range. Bitcoin is currently trading for $19,393, representing an increase of 1.13% compared to yesterday’s value. Meanwhile, Ethereum’s price has increased by 0.10% on the day, while XRP managed to lose a whopping 8.56%.
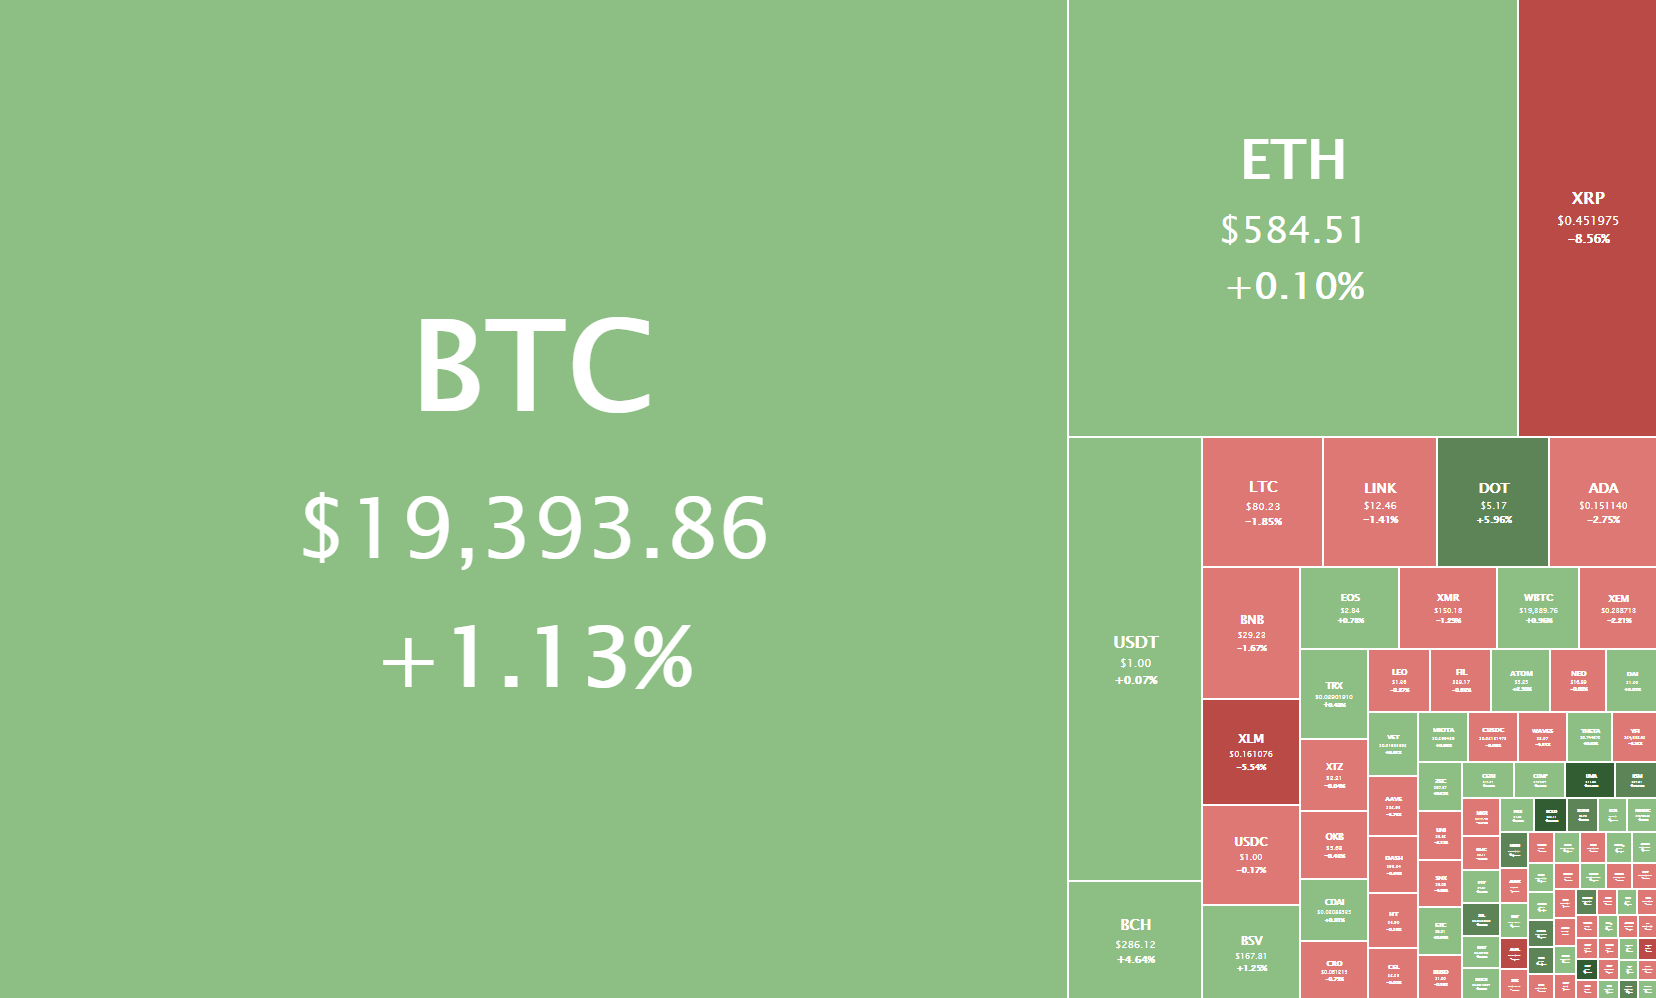
Daily Crypto Sector Heat Map
XcelToken Plus gained 263.82% in the past 24 hours, making it the most prominent daily crypto gainer by far. It is followed by Amun Bitcoin 3x Daily Long’s 161.53% and rbase.finance’s 129.84% gain. On the other hand, Maximine Coin lost 99.42%, making it the most prominent daily loser. It is followed by STEM CELL COIN’s loss of 97.69% and Patron’s loss of 89.45%.
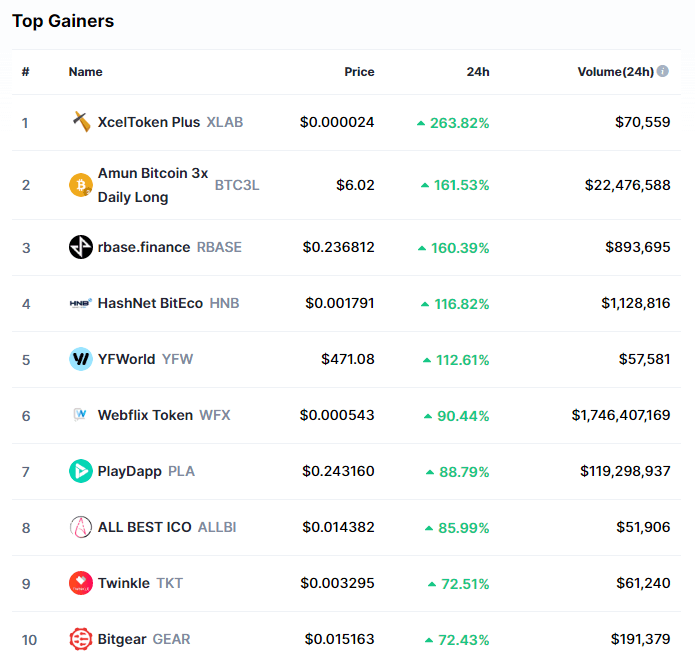
Top 10 24-hour Performers (Click to enlarge)

Bottom 10 24-hour Performers (Click to enlarge)
Bitcoin’s market dominance has moved up since our last report, with its value currently being 63.9%. This value represents a 0.4% difference to the upside than the value it had when we last reported.
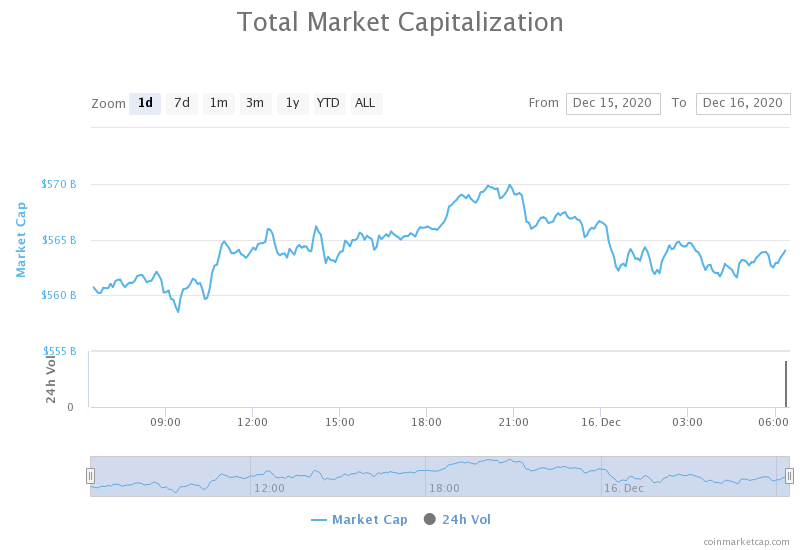
Daily Crypto Market Cap Chart
The cryptocurrency sector capitalization has decreased slightly since we last reported, with its current value being $564.0 billion. This represents a $4.20 billion decrease when compared to our previous report.
_______________________________________________________________________
What happened in the past 24 hours?
_______________________________________________________________________
- A fund operated by multi-billion dollar investment firm Ruffer has bought BTC (The Block)
- China testing its CBDC in Suzhou. Here’s an early look at the user experience (The Block)
- Draft rehab plan filed for defunct bitcoin exchange Mt Gox but details are vague (The Block)
- Cboe’s latest data deal lays the baseline for a wide range of new crypto market products (The Block)
- Open interest in Bitcoin derivatives hit brand new highs this week (The Block)
- CoinList mints largest ever single-day quantity of WBTC (The Block)
- Binance Visa Card Now Shipping to European Users (Cryptobriefing)
- Grayscale hits $13B: Why Bitcoin institutional demand soaring at $19k is bullish (Cryptoslate)
- Bitcoin May Have Hit Wall of Profit Takers Around $19,500: Analyst (Coindesk)
- Former JPMorgan exec joins Ripple’s board (Cointelegraph)
_______________________________________________________________________
Technical analysis
_______________________________________________________________________
Bitcoin
Bitcoin has continued trading within a range between $19,100 and $19,570, possibly hitting a wall of profit-taking institutional traders. Despite the overall bullishness of the market, the largest cryptocurrency by market cap failed to break the $19,666 level or even reach it. This is because of the increasing number of BTC Whales (holders of 10,000 to 100,000 Bitcoin) leaving the market and taking profit as the price approaches the $20,000 mark.
The sheer amount of resistance hovering above $19,500 will make it quite hard for Bitcoin bulls to push towards the all-time highs. In case the aforementioned push doesn’t happen, we can expect a possible dip towards $18,000.
BTC/USD 4-hour chart
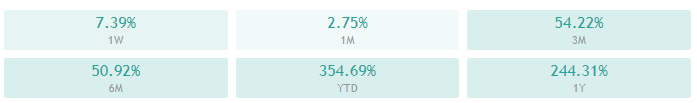
Bitcoin’s overview on all time-frames is bullish, with its weekly time-frame being the only one completely bullish. The rest of the time-frames are slightly tilted to the neutral side.
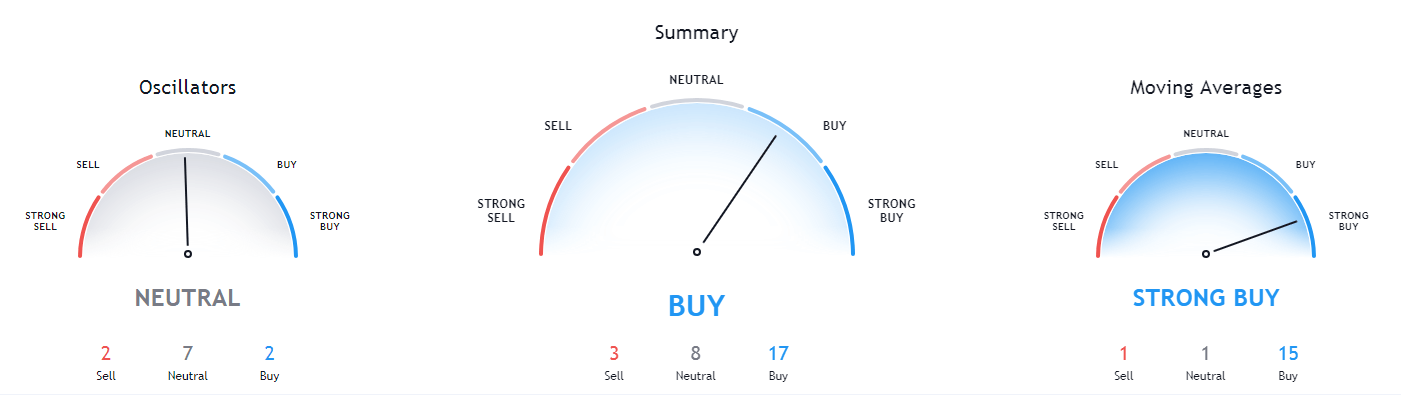
BTC/USD 1-day Technicals
Technical factors (4-hour Chart):
- Price is above its 50-period and slightly above its 21-period EMA
- Price is between its middle and top Bollinger band
- RSI is neutral (60.06)
- Volume is average
Key levels to the upside Key levels to the downside
1: $19,100 1: $18,600
2: $19,666 2: $18,190
3: $20,000 3: $17,800
Ethereum
Ethereum has hit a sell wall as well, stopping its upward price movement just below $600 for the third time in 3 days. The second-largest cryptocurrency by market cap is stuck between $581 to the downside and $600 to the upside, which is a very narrow range for long-term trading.
Ethereum will most likely experience a sharp break out of the current range, creating a potential safe trade with set parameters.
ETH/USD 4-hour Chart
Ethereum’s overview on all time-frames is bullish, with its daily time-frame being the only one completely bullish. The rest of the time-frames are slightly tilted to the neutral side.
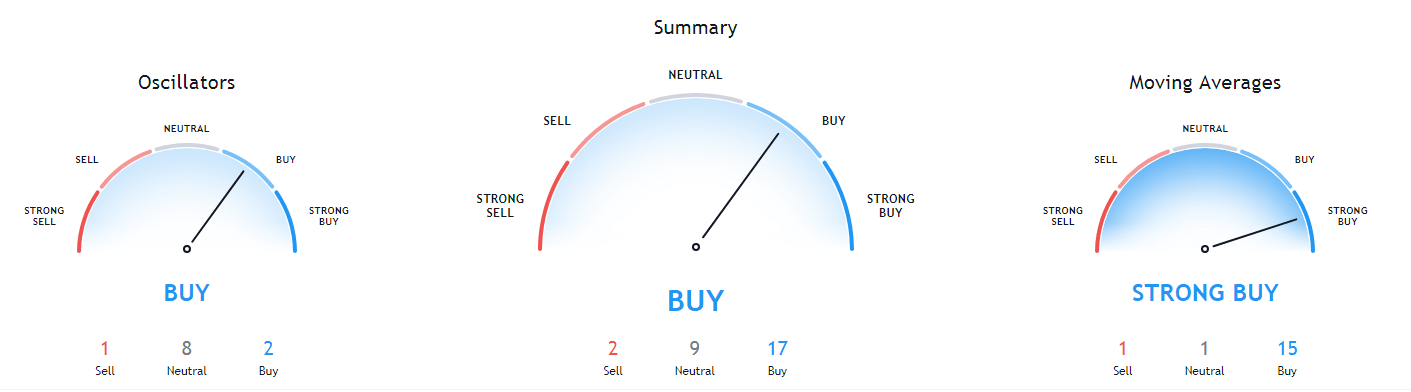
ETH/USD 1-day Technicals
Technical Factors (4-hour Chart):
- Price is slightly above its 50-period and at its 21-period EMAs
- Price is at its middle Bollinger band
- RSI is neutral (54.03)
- Volume is slightly below average when compared to the previous week
Key levels to the upside Key levels to the downside
1: $600 1: $581
2: $632 2: $565
3: $636.5 3: $545
Ripple
XRP has continued its downturn, this time breaking the crucial $0.475 level. Its price has steadily decreased ever since Dec 1, when it could not break $0.683. This steady descent has created a downtrend, which many analysts think is the death of XRP’s price.
However, there is still hope for XRP. Some analysts believe that this is the 4th of 5 waves in a pattern that XRP started creating on Aug 20 and that the next wave will start an uptrend that will propel its price above $1.
XRP/USD 4-hour Chart
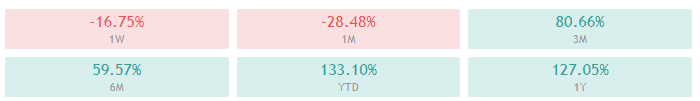
XRP’s longer-term technicals are tilted towards the buy-side, while its short-term technicals are tilted towards the sell-side. While its 4-hour time-frame is completely bearish, its daily overview is slightly more neutral.
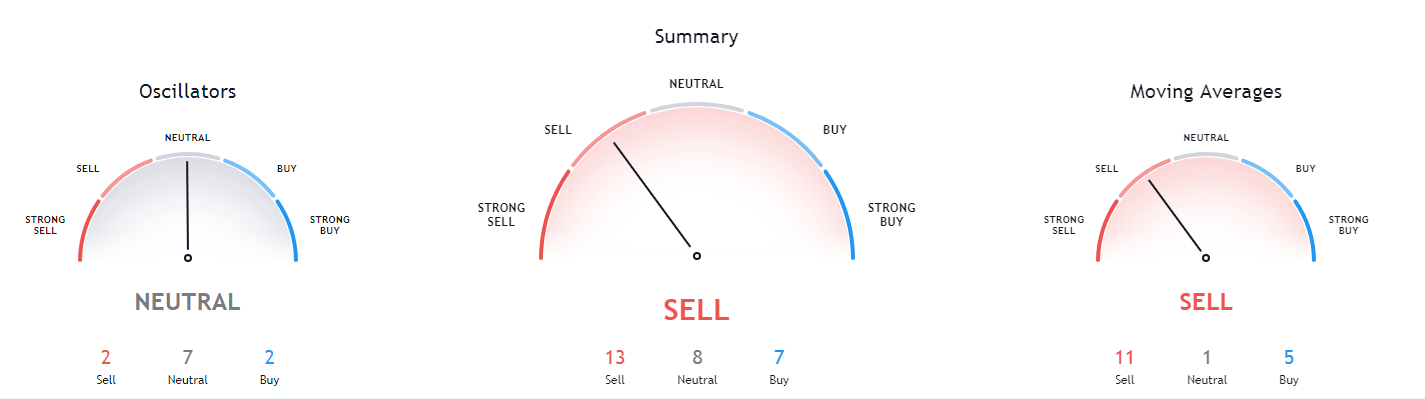
XRP/USD 1-day Technicals
Technical factors (4-hour Chart):
- Its price is currently well below both its 50-period EMA and its 21-period EMA
- Price is at its bottom Bollinger band
- RSI is close to the oversold territory (31.25)
- Volume is well below its average level
Key levels to the upside Key levels to the downside
1: $0.5 1: $0.475
2: $0.543 2: $0.45
3: $0.57 3: $0.425
Related posts
 Daily Crypto Review, Sept 3 – DeFi Flippening: Unifi’s Volume Topples Coinbase
 Daily Crypto Review, Sept 7 – Peter Schiff: “I Was Wrong About Bitcoin”; Bitcoin Facing $9,000 or Recovering?
 Daily Crypto Review, Sept 9 – Will DeFi Bubble Burst, Send Ethereum to Freefall?
 Daily Crypto Review, Sept 14 – The EU Regulating Stablecoins; Crypto Market Preparing For a Move