
The cryptocurrency sector was mostly neutral as Bitcoin gained even more market dominance. Bitcoin is currently trading for $23.498, representing an increase of 3.53% when compared to yesterday’s value. Meanwhile, Ethereum’s price has increased by 1.28% on the day, while XRP managed to lose a whopping 23.99%.
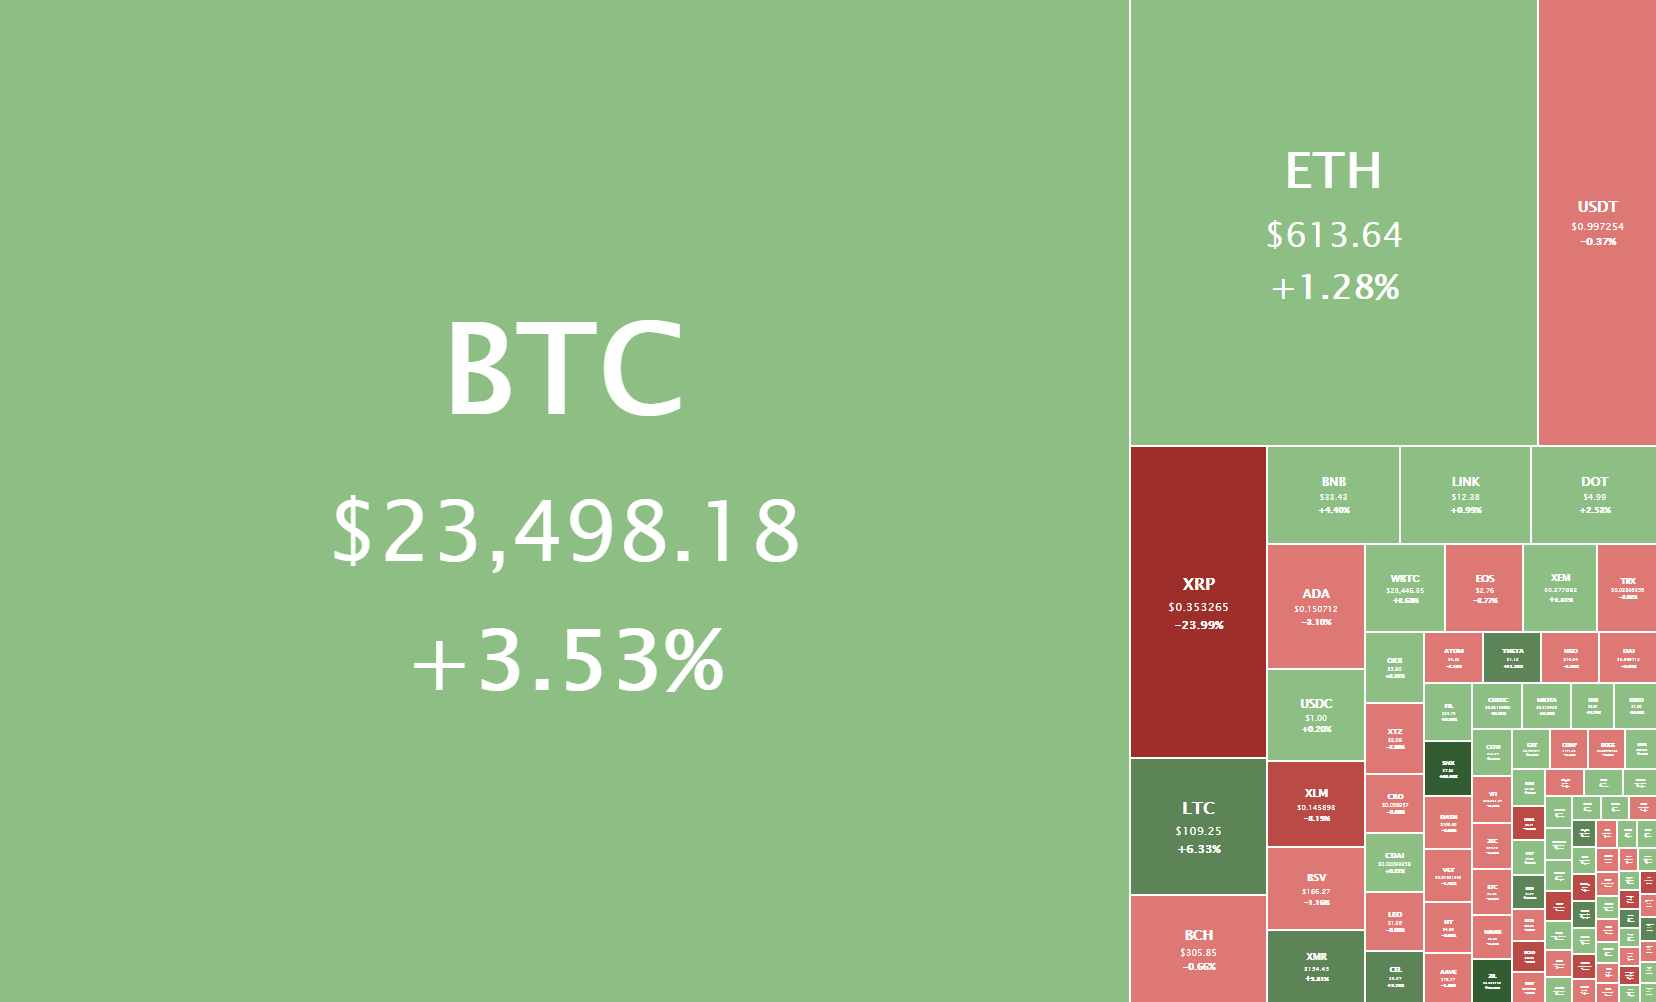
Daily Crypto Sector Heat Map
SYNC Network gained 97.23% in the past 24 hours, making it the most prominent daily crypto gainer by far. It is followed by 3x Short XRP Token’s 84.56% and Basis Share’s 77.1% gain. On the other hand, DMme lost 85.99%, making it the most prominent daily loser. It is followed by 3x Long XRP Token’s loss of 66.89% and S4FE’s loss of 60.04%.

Top 10 24-hour Performers (Click to enlarge)
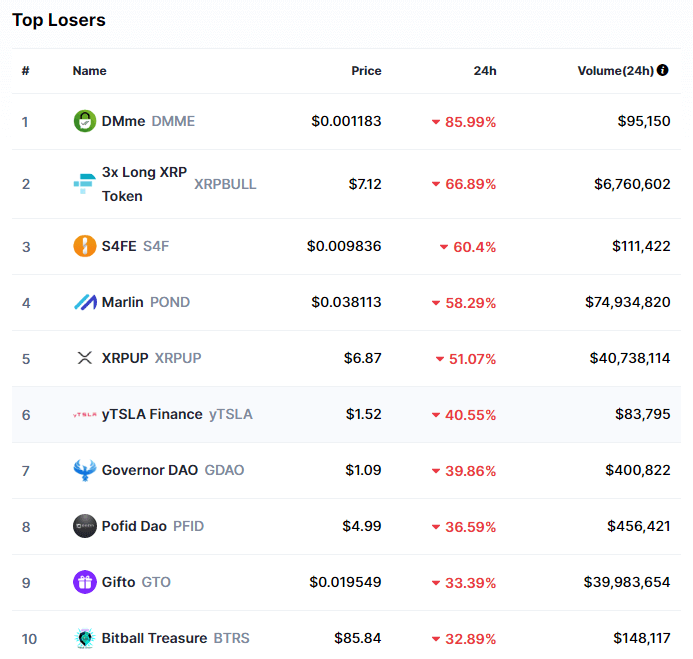
Bottom 10 24-hour Performers (Click to enlarge)
Bitcoin’s market dominance has moved up over one percent since our last report, with its value currently being 67.8%. This value represents a 1.2% difference to the downside than the value it had when we last reported.
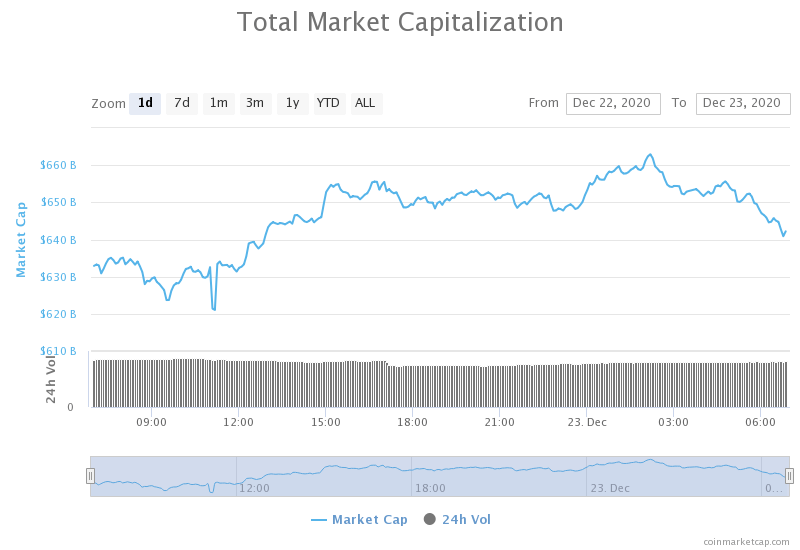
Daily Crypto Market Cap Chart
The cryptocurrency sector capitalization has increased since we last reported, with its current value being $642.21 billion. This represents a $9.69 billion increase when compared to our previous report.
_______________________________________________________________________
What happened in the past 24 hours?
_______________________________________________________________________
- SEC files lawsuit against Ripple and two executives, alleging the firm brought in over $1.3 billion in ongoing, unregistered securities sale (The Block)
- Anthony Scaramucci outlines his new Bitcoin fund, discloses initial $25 million investment during interview (The Block)
- Switzerland’s central bank will expand digital currency trials to include commercial banks (The Block)
- Coinbase Urges FinCEN to Reconsider Rushed Crypto Regulations (Cryptobriefing)
- Ledger Refuses Refunds, Tells Clients “Bank Vault Is More Secure” (Cryptobriefing)
- Crypto.com & Bison Trails Will Simplify Node Operation (Cryptobriefing)
- Even after 400% rally, analysts are still excited about DeFi protocol SushiSwap (Cryptoslate)
- MoneyGram Takes Wait-and-See Approach as SEC Sues Partner Ripple (Coindesk)
- Bitcoin’s limited supply doesn’t really matter to one markets commentator (Cointelegraph)
- TradingView GM explains rationale for continued Bitcoin bullishnessTradingView GM explains rationale for continued Bitcoin bullishness (Cointelegraph)
_______________________________________________________________________
Technical analysis
_______________________________________________________________________
Bitcoin
Bitcoin continued trading within a decently large range, bound by $22,054 to the downside and $24,315 to the upside. The largest cryptocurrency by market cap managed to gain a couple of percent on its price today, as most of the market consolidated. Therefore, Bitcoin market dominance has risen once again, almost reaching 70%.
Bitcoin’s descending volume and sideways trading were always a sign of a new move in the making. However, as the current trading range is quite wide, the sharp move to either side might not be so imminent.
BTC/USD 4-hour chart
While Bitcoin’s daily and weekly technicals are tilted towards the bull side, its 4-hour and monthly overviews are slightly bullish, but show some hints of neutrality.
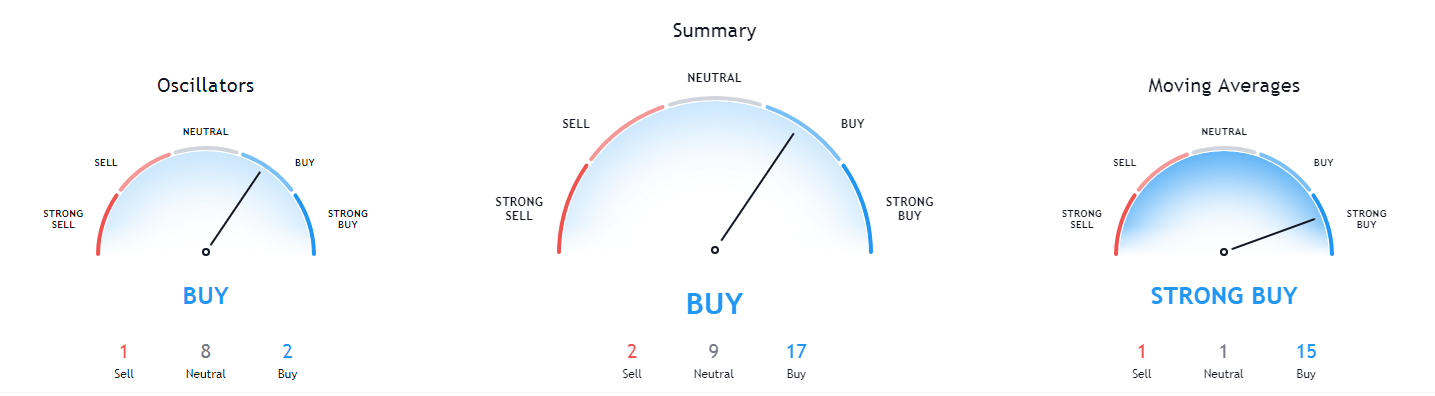
BTC/USD 1-day Technicals
Technical factors (4-hour Chart):
- Price is above its 50-period EMA and slightly above its 21-period EMA
- Price near its middle Bollinger band
- RSI is neutral (56.31)
- Volume is slightly above average
Key levels to the upside Key levels to the downside
1: $24,315 1: $22,054
2: $24,700 2: $21,350
3: $25,511 3: $19,918
Ethereum
Ethereum has followed Bitcoin to the upside and gained just enough traction to attempt a $632 level break, but not enough to actually break it. This triggered a small correction, which brought it to the middle of the range, bound by $600-$602 to the downside and $632 to the upside.
Ethereum’s price movements are (in the past couple of days) either an exact copy of Bitcoin’s moves, or an exaggerated move in the same direction. Traders could possibly use this to trade Ether’s exaggerated moves by watching Bitcoin’s movement.
ETH/USD 4-hour Chart
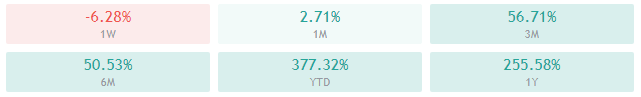
Ethereum’s daily, weekly, and monthly technicals are completely bullish, while its 4-hour overview is tilted towards the sell-side.

ETH/USD 1-day Technicals
Technical Factors (4-hour Chart):
- Price is slightly below both its 50-period and its 21-period EMA
- Price is close to its middle Bollinger band
- RSI is neutral (44.94)
- Volume is on slightly above-average levels
Key levels to the upside Key levels to the downside
1: $632 1: $600
2: $675 2: $581
3: $738.5 3: $564
Ripple
XRP got crushed today on horrible news of SEC officially filing a lawsuit against its company Ripple as well as against its cofounders. While MoneyGram took a lenient position and didn’t want to make any negative comments, most crypto exchanges are planning on delisting XRP due to concerns regarding regulation.
While some may think that short-selling XRP is a good idea, watch out for slippage and insufficient demand.
XRP/USD 4-hour Chart
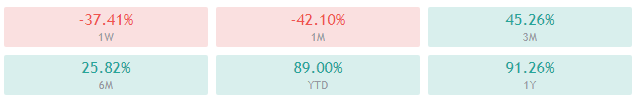
XRP’s short-term technicals show a heavy tilt towards the sell-side, while its long-term technicals (weekly and monthly) remain bullish.
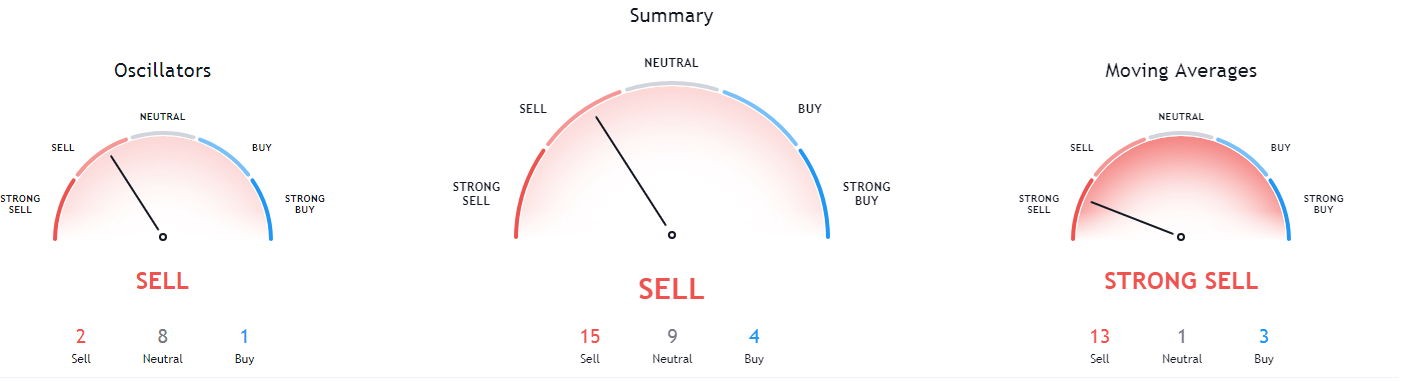
XRP/USD 1-day Technicals
Technical factors (4-hour Chart):
- Its price is currently far below both its 50-period EMA and its 21-period EMA
- Price slightly below its bottom Bollinger band
- RSI is in the oversold territory (18.53)
- Volume is on extremely high levels
Key levels to the upside Key levels to the downside
1: $0.40 1: $0.33
2: $0.475 2: $0.297
3: $0.481
Related posts
 Daily Crypto Review, Feb 6 – Is this the Start of the Altcoin Season?
 Daily Crypto Review, Feb 7 – Bitcoin Futures over 10,000; US crypto regulators stalling
 Daily Crypto Review, Mar 12 – The US creating AmeriCoin? Altcoins plunging while Bitcoin increases its dominance
 Daily Crypto Review, Apr 10 – Canada launching a BTC fund; Cryptos retesting support levels