The cryptocurrency sector had is currently in a consolidation phase as Bitcoin fell below $27,000. Bitcoin is currently trading for $26,624, representing a decrease of 1.13% compared to yesterday’s value. Meanwhile, Ethereum’s price has decreased by 2.56% on the day, while XRP had another major dip, losing 19.42% of its value.

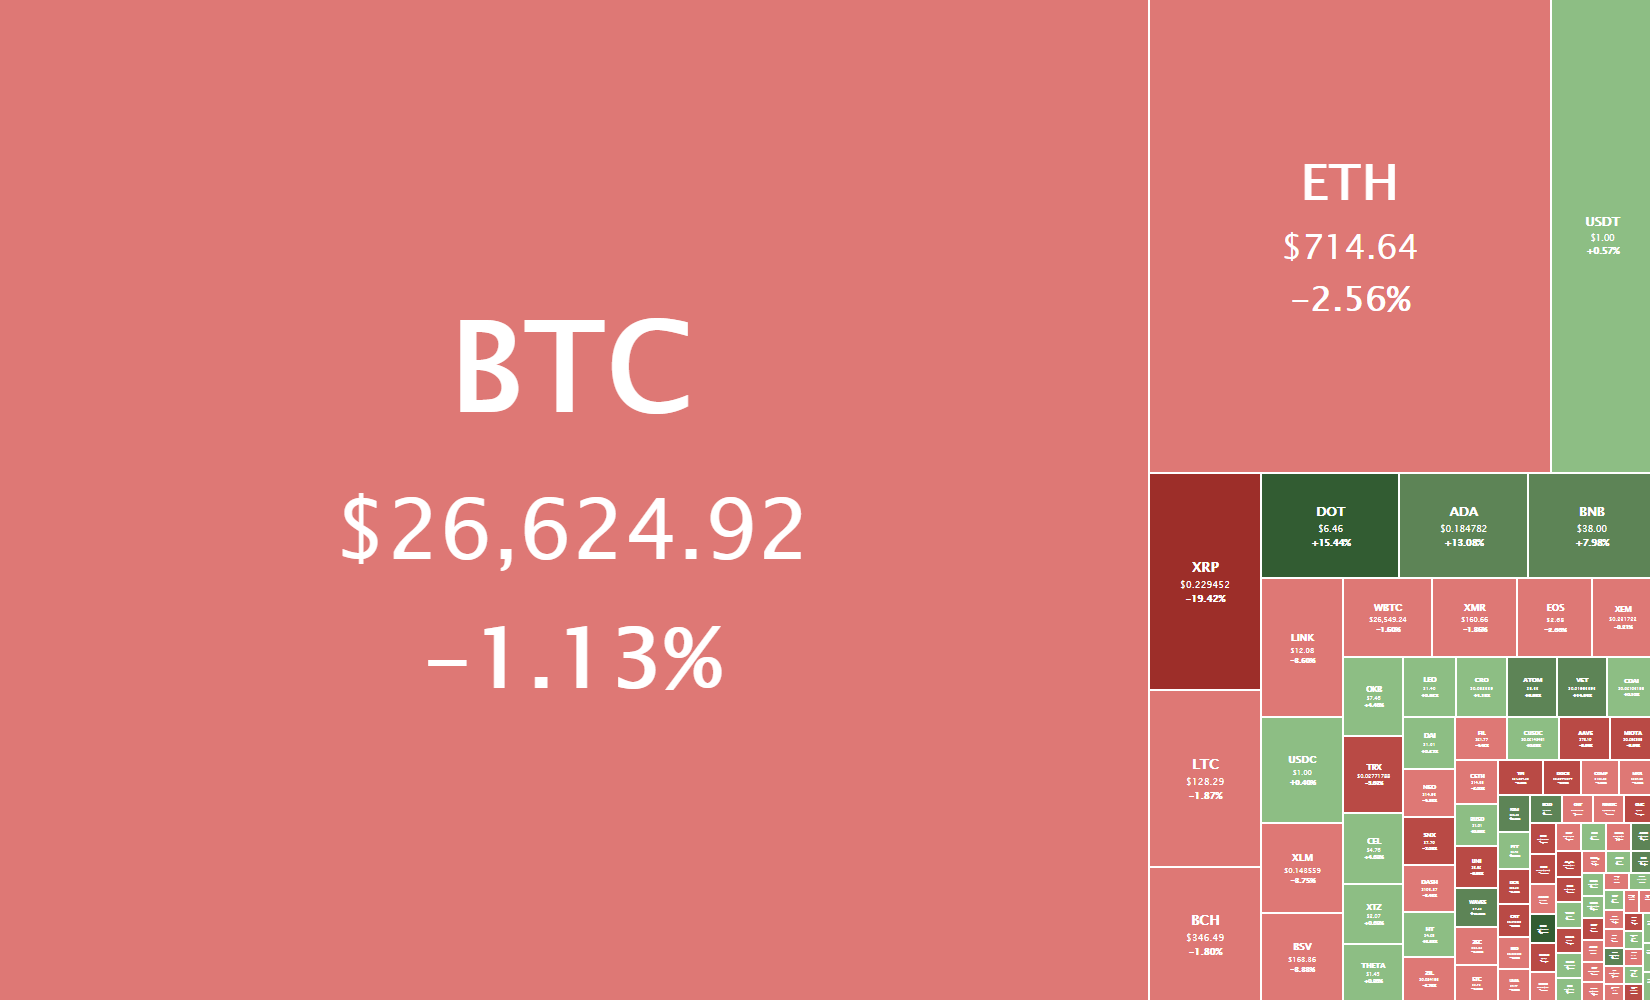
Daily Crypto Sector Heat Map
Ethereum Lightning gained 1097.36% in the past 24 hours, making it the most prominent daily crypto gainer by far. It is followed by N3RD Finance’s 94.18% and Matrix AI Network’s 86.08% gain. On the other hand, COVER Protocol lost 97.97%, making it the most prominent daily loser. It is followed by Encryptgen’s loss of 91.18% and Mining Core Coin’s loss of 69.41%.
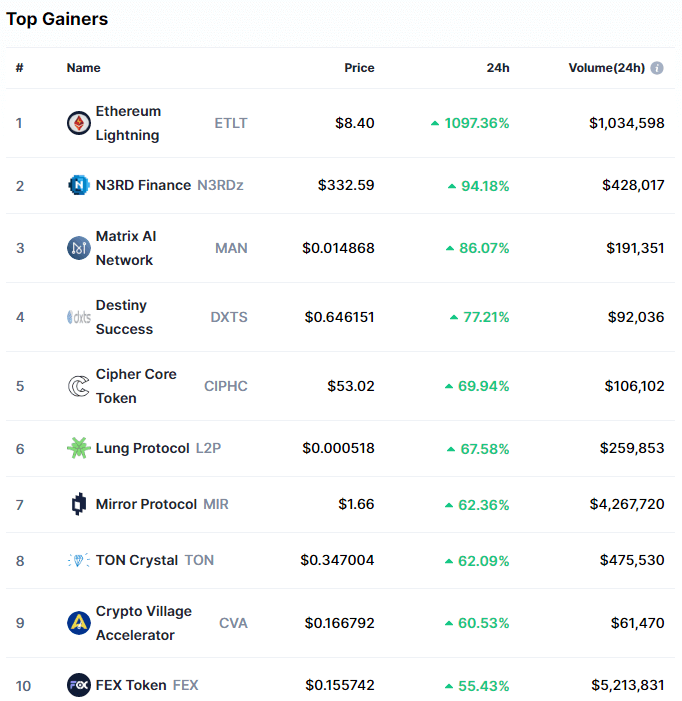
Top 10 24-hour Performers (Click to enlarge)
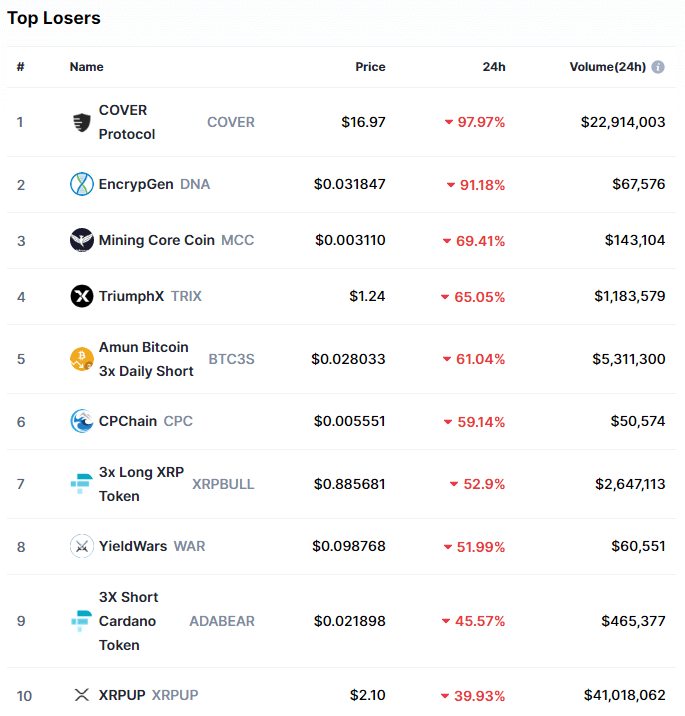
Bottom 10 24-hour Performers (Click to enlarge)
Bitcoin’s market dominance has moved up slightly since our last report, with its value currently being 69.2%. This value represents a 0.1% difference to the upside than the value it had when we last reported.
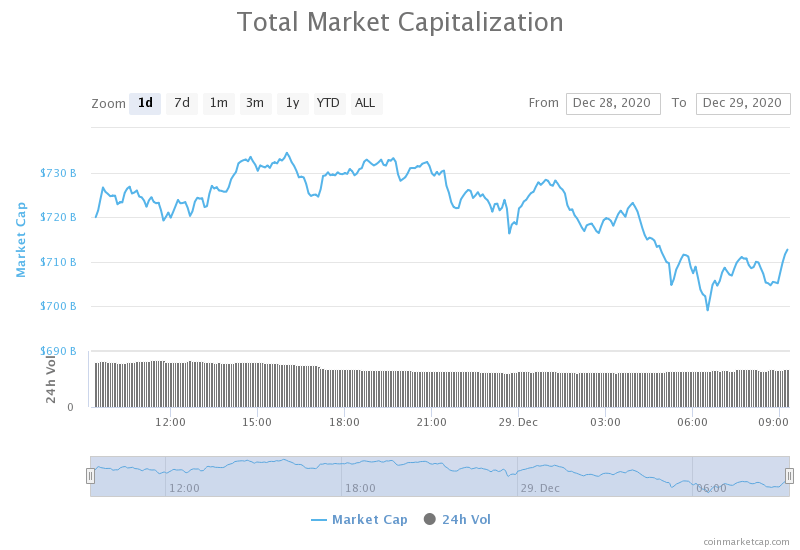
Daily Crypto Market Cap Chart
The cryptocurrency sector capitalization has decreased slightly since we last reported, with its current value being $712.73 billion. This represents an $8.45 billion decrease when compared to our previous report.
_______________________________________________________________________
What happened in the past 24 hours?
_______________________________________________________________________
- US crypto exchange OKCoin is suspending XRP trading and deposits (The Block)
- Coinbase says it will suspend XRP trading next month (The Block)
- Major darknet marketplace White House Market ends support for bitcoin payments (The Block)
- Greenpro Stock Price Leaps by 103% With Bitcoin Buy (Cryptobriefing)
- SEC Accuses Australian Fund Manager of Fraud (Cryptobriefing)
- After Bitcoin surged to $28,000 and Ethereum hit $740, analysts have begun to fear a correction (Cryptoslate)
- Bitcoin logs $28,000 all-time high, but there’s no retail interest (yet) (Cryptoslate)
- Marathon Patent Agrees to Buy 70K ASIC Miners From Bitmain for $170M (Coindesk)
- BlackRock is looking to hire a blockchain VP with experience in cryptocurrencies (Cointelegraph)
- Cover Protocol suffers infinite minting attack, price tanks 97% (Cointelegraph)
_______________________________________________________________________
Technical analysis
_______________________________________________________________________
Bitcoin
Ever since it hit the $28,391 all-time high, Bitcoin has been trading in a sideways manner. Its price is currently within a large channel, bound by $25,512 to the downside and the aforementioned all-time high to the upside.
The descending volume alongside sideways trading was never a long-term occurrence with Bitcoin, but rather good indicators of a new explosive move ahead.
Bitcoin traders should be mindful of any volume spikes when trading, and should look for smaller time-frame Fib retracements if they want to be more precise with setting their support and resistance levels.
BTC/USD 1-hour chart
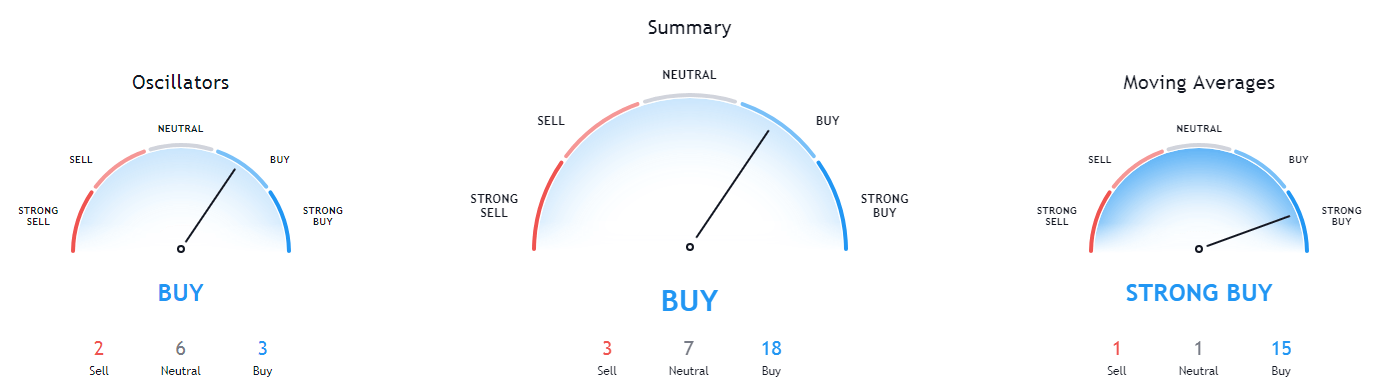
Bitcoin’s technicals on both short-term and long-term time-frames are completely bullish and show close to no signs of neutrality or bearishness.
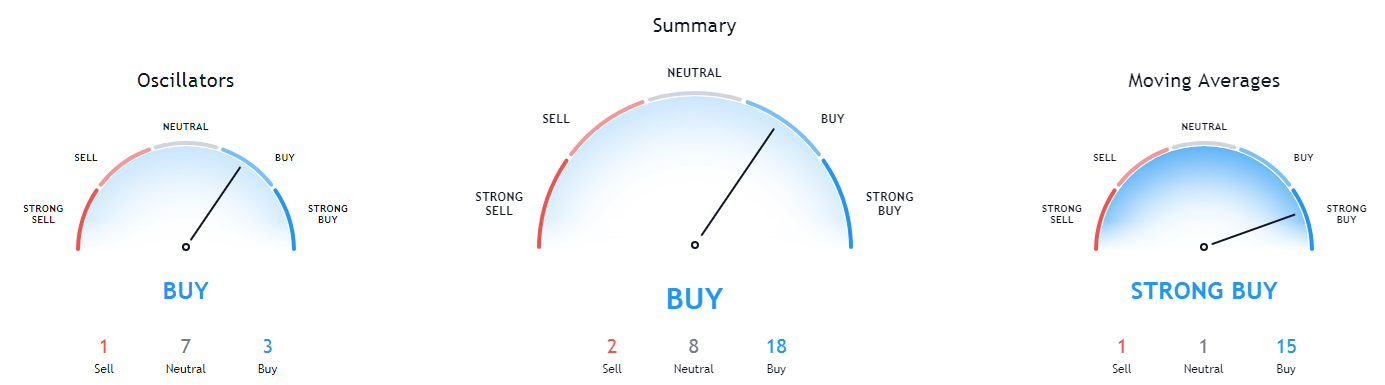
BTC/USD 1-day Technicals
Technical factors (4-hour Chart):
- Price is above its 50-period EMA and at its 21-period EMA
- Price is at its middle Bollinger band
- RSI is neutral (55.72)
- Volume is slightly above average, but descending
Key levels to the upside Key levels to the downside
1: $28,391 1: $25,512
2: $29,000 2: $24,696
3: $30,000 3: $24,315
Ethereum
Ethereum’s move towards the upside ended at $747, prompting a pullback. However, while many analysts believed that Ether would not keep its price above $700, that’s exactly what happened.
Ethereum’s signature trading move has occurred once again, with that move being: pushing up, then pulling back, and breaking the 21-hour moving average to the downside, only to find support at the 50-hour moving average and push back up. Knowing how Ethereum moves alongside watching Bitcoin’s moves is one of the safest ways to trade cryptocurrencies at the moment, as the moves have pre-determined stop-losses and targets.
ETH/USD 1-hour Chart
Ethereum’s shorter time-frames are completely bullish and show no signs of neutrality or bearishness, while its longer-time frames have some neutrality present alongside the overall bullishness.
ETH/USD 1-day Technicals
Technical Factors (4-hour Chart):
- Price is above both its 50-period and its 21-period EMA
- Price is above its middle Bollinger band
- RSI is neutral (59.39)
- Volume is trading on above-average levels
Key levels to the upside Key levels to the downside
1: $747 1: $675
2: $800 2: $653
3: $900 3: $632
Ripple
XRP has experienced another extremely bad day, as its price dropped more than 22% on the day. The move came as a result of two major exchanges, OKEx and Coinbase, dropping support for XRP due to the pending lawsuit against its company, Ripple, as well as Ripple’s executives.
Trading XRP is extremely risky at the moment due to price fluctuations that are a result of news rather than technical formations.
XRP/USD 1-hour Chart
XRP’s technicals on all time-frames are tilted towards the sell-side, with all of them showing slight signs of neutrality.
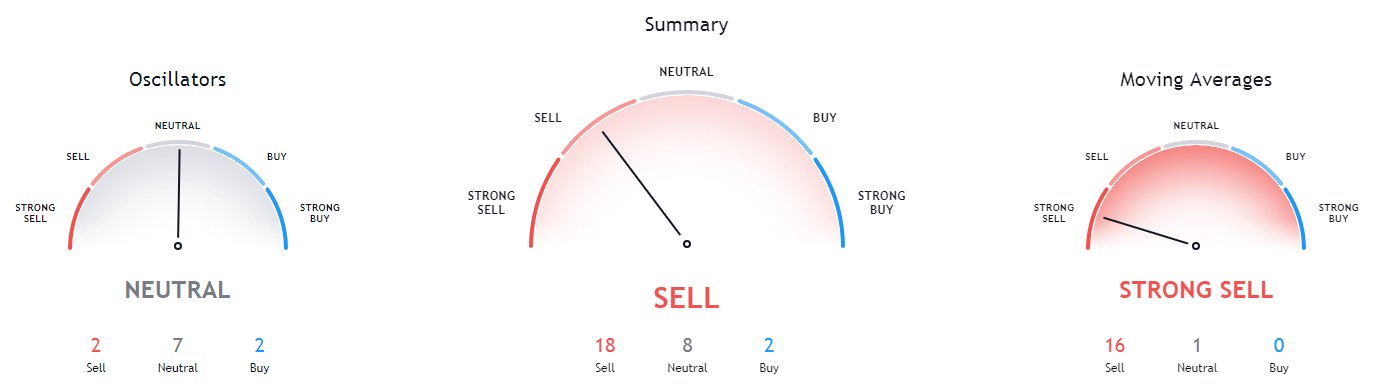
XRP/USD 1-day Technicals
Technical factors (4-hour Chart):
- Its price is currently far below both its 50-period EMA and its 21-period EMA
- Price is at its bottom Bollinger band
- RSI is in the oversold territory (28.88)
- Volume has spiked to above-average levels
Key levels to the upside Key levels to the downside
1: $0.25 1: $0.214
2: $0.30 2: $0.14
3: $0.358
Related posts
 Daily Crypto Review, Feb 24 – New Jersey regulating crypto?
 Daily Crypto Review, Feb 28 – CFTC approaching stablecoin projects; Crypto market preparing for a move
 Daily Crypto Review, Mar 5 – Bitcoin uncertainty leading to a lack of buying or selling pressure
 Daily Crypto Review, Oct 28 – Bitcoin Rushing Towards $14,000; Over 50% of US Investors Interested in Crypto