
The cryptocurrency sector is split between gainers and losers as Bitcoin consolidates right below its all-time high level. Bitcoin is currently trading for $23,825, representing an increase of 1.03% when compared to yesterday’s value. Meanwhile, Ethereum’s price has decreased by 1.42% on the day, while XRP managed to lose 3.20%.
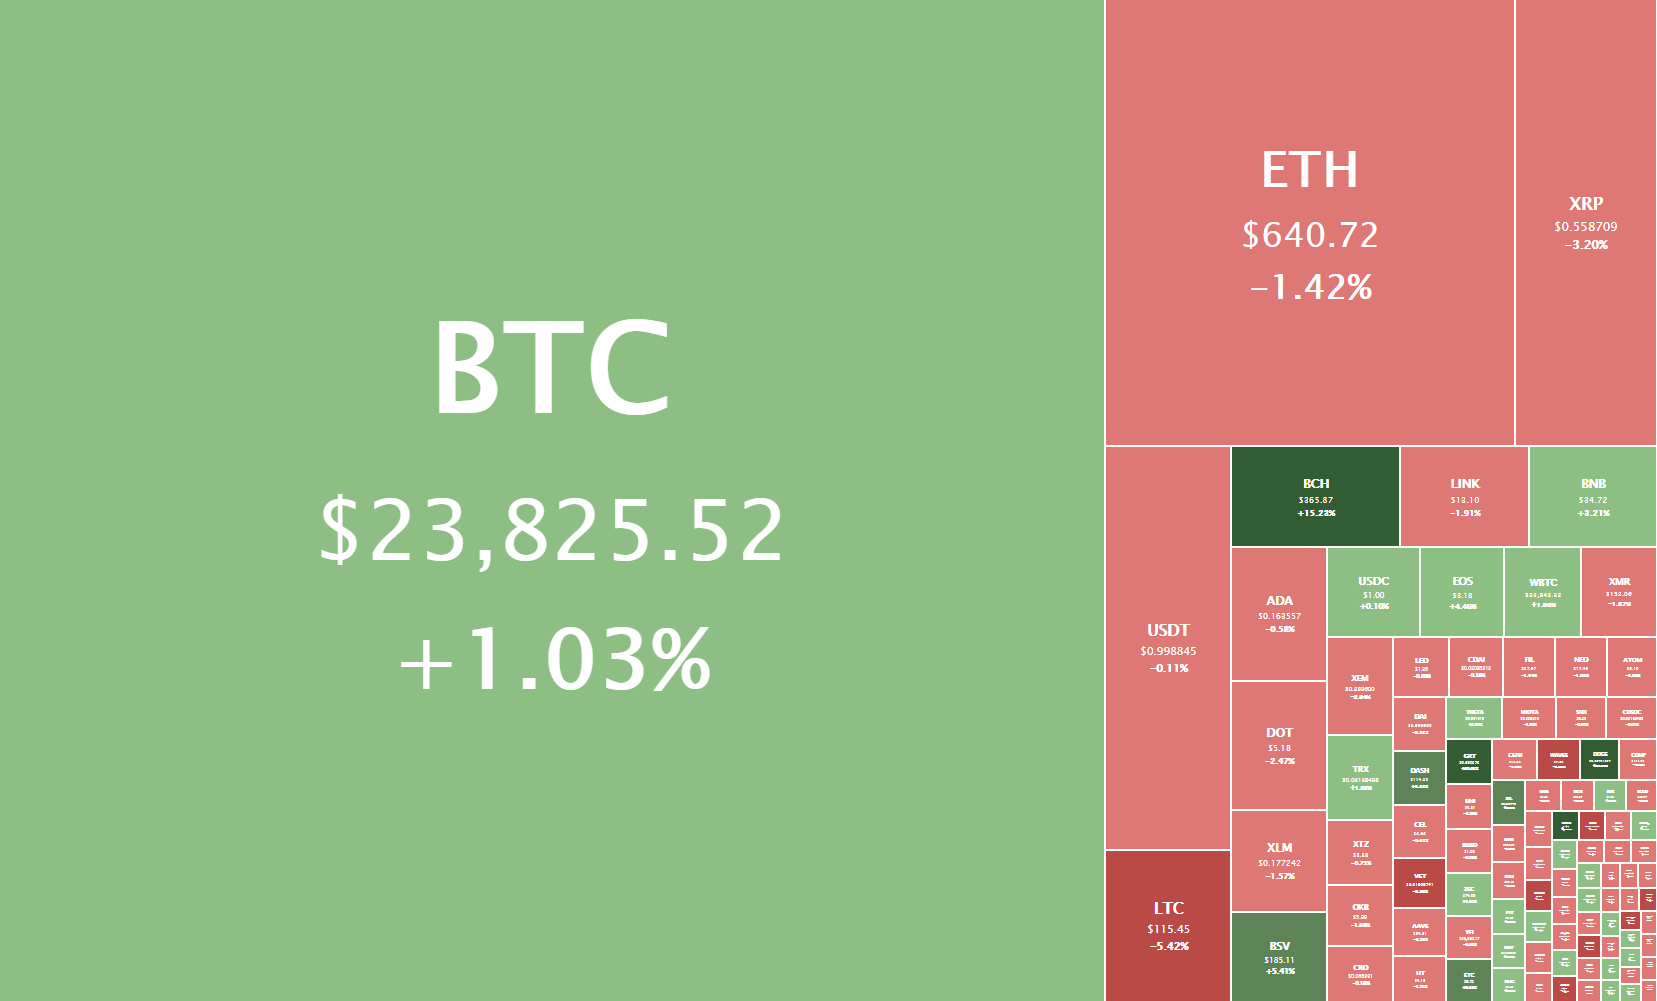
Daily Crypto Sector Heat Map
Axion gained 3402.38% in the past 24 hours, making it the most prominent daily crypto gainer by far. It is followed by MahaDAO’s 199.69% and Elxis’ 186.79% gain. On the other hand, Golden Ratio Per Liquidity lost 59.64%, making it the most prominent daily loser. It is followed by ALL BEST ICO’s loss of 50.84% and Quras’s loss of 49.42%.
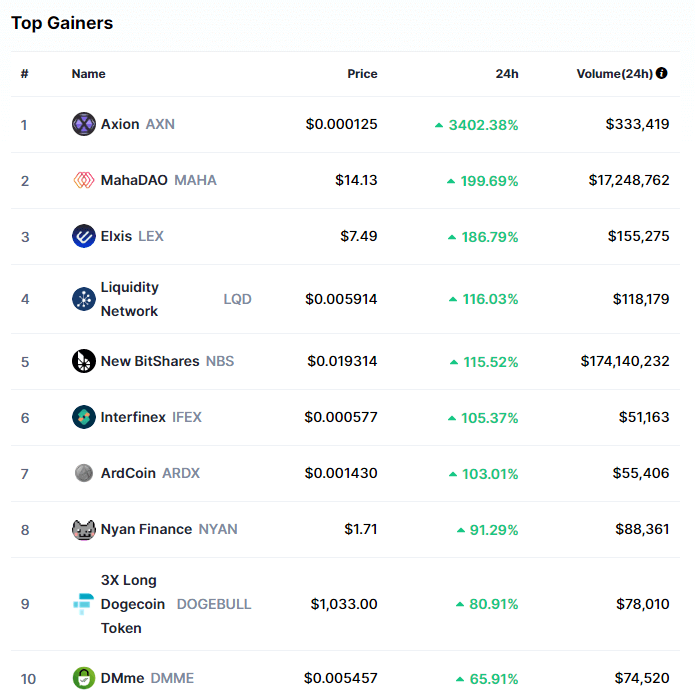
Top 10 24-hour Performers (Click to enlarge)
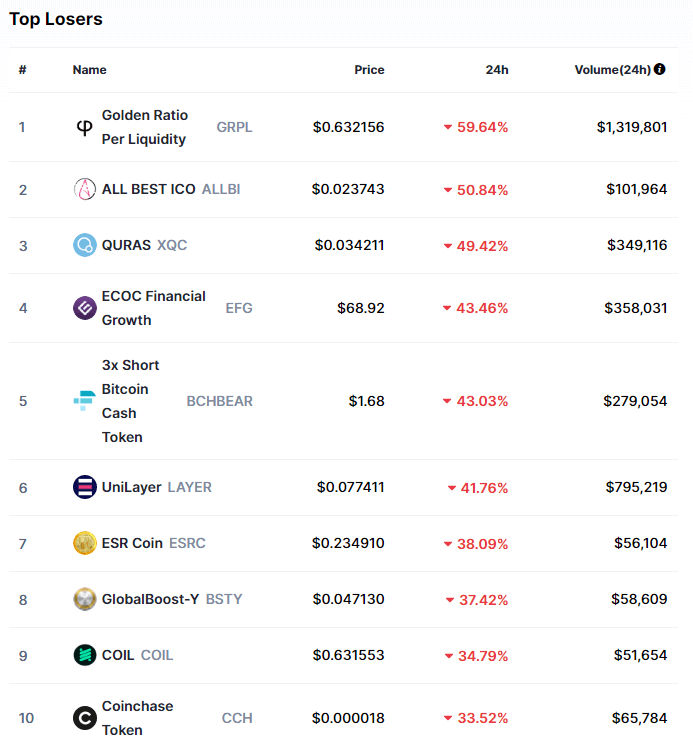
Bottom 10 24-hour Performers (Click to enlarge)
Bitcoin’s market dominance has moved down almost half a percent since our last report, with its value currently being 65.1%. This value represents a 0.4% difference to the downside than the value it had when we last reported.
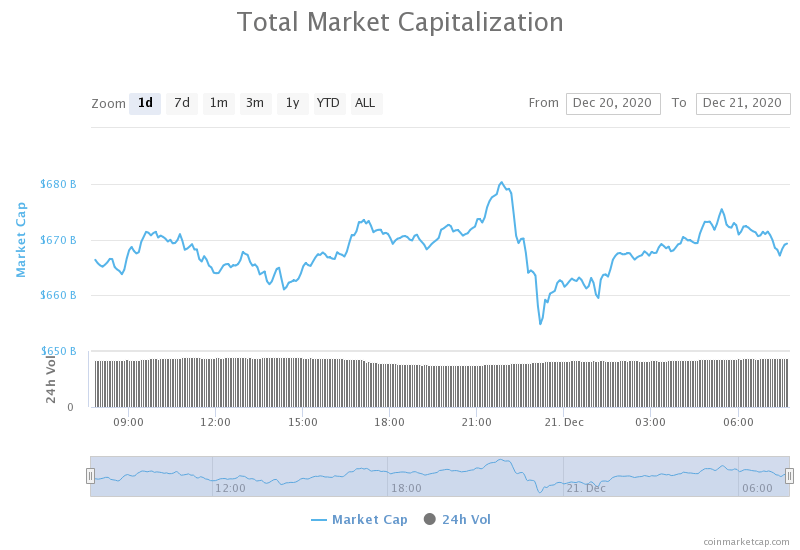
Daily Crypto Market Cap Chart
The cryptocurrency sector capitalization has increased since we last reported, with its current value being $669.26 billion. This represents an $18.25billion increase when compared to our previous report.
_______________________________________________________________________
What happened in the past 24 hours?
_______________________________________________________________________
- Outgoing Trump Administration Rushes Damaging New Crypto Bill (Cryptobriefing)
- Win Up to $300,000 Testing Crypto.com’s Native Blockchain (Cryptobriefing)
- Real Madrid Joins Ethereum-based Collectible Game Sorare (Cryptobriefing)
- Coinbase’s $30 Billion IPO to Be Led by Goldman Sachs (Cryptobriefing)
- Zilliqa (ZIL) announces CryptoSlate partnership, and there’s a prize for you! (Cryptoslate)
- 3 reasons Litecoin (LTC) is up 61% in 1 week, outperforming the market (Cryptoslate)
- Pantera says its ICO fund performance is up 362% year-to-date (The Block)
- Dogecoin Jumps 20% After Musk’s Twitter Shout-Out; Bitcoin Joke Spurs Dialogue With Saylor (Coindesk)
- DeFi boom and Bitcoin rally position NEXO to close 2020 with a 480% gain (Cointelegraph)
- How should investors value DeFi projects? A new paper might have some answers (Cointelegraph)
_______________________________________________________________________
Technical analysis
_______________________________________________________________________
Bitcoin
Bitcoin has spent its weekend slowly rising towards the resistance level of its trading channel, which is bound by $22,055 to the downside and $24,315 to the upside. However, The two attempts to break the resistance level and enter the price discovery phase failed, leaving Bitcoin just below $24,315. With volume descending ever since Dec 17, we might expect this consolidation to end with a volume boom and a very sharp move.
While it is yet unknown whether this sharp move will be to the upside or downside, the increase in volume and a strong push towards one side will make it quite clear. Traders can use this momentum to catch a very safe trade.
BTC/USD 2-hour chart
While Bitcoin’s technicals are overall bullish, they either show signs of neutrality or even hints of bearishness. Its daily and monthly overviews have some indications of sellers being present, while its 4-hour and weekly overviews are bullish-neutral.
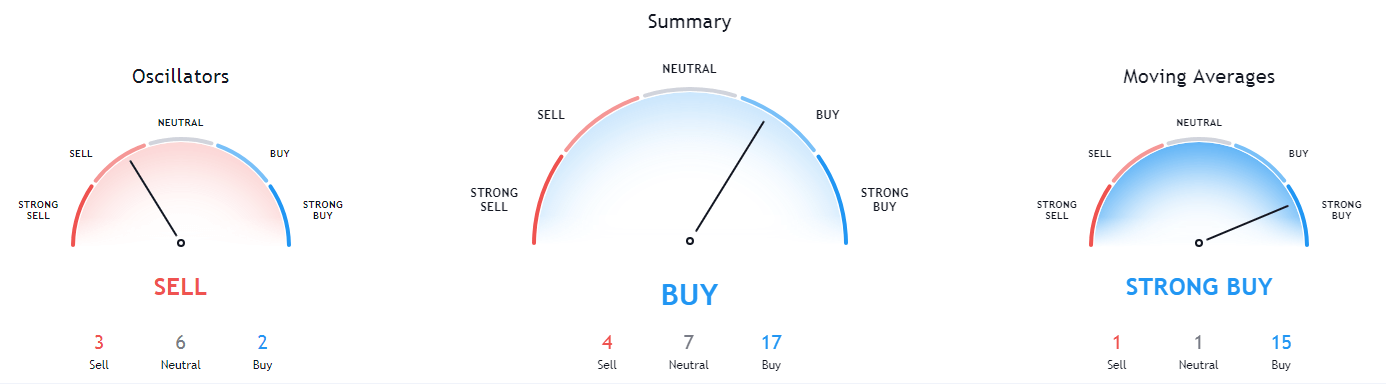
BTC/USD 1-day Technicals
Technical factors (4-hour Chart):
- Price is far above both its 50-period and its 21-period EMA
- Price slightly below its top Bollinger band
- RSI is close to being overbought (65.90)
- Volume is decreasing, and trading below the average level
Key levels to the upside Key levels to the downside
1: $24,315 1: $22,054
2: $24,700 2: $21,350
3: $25,511 3: $19,918
Ethereum

Ethereum has, unlike Bitcoin, descended slowly within its trading range, which is bound by $675 to the upside and $632. The second-largest cryptocurrency by market cap had one strong push towards the downside, which brought its price all the way down to $620 on Dec 20. However, the bulls prevailed, and Ether is now trading above $632 safely.
Ethereum’s price movements seem pretty tame, meaning that its next move will be of larger magnitude. Traders should pay close attention to Bitcoin and its moves in the near future before trading any other cryptocurrency, including Ether.
ETH/USD 2-hour Chart
Ethereum’s technicals are very bullish on all time-frames, with only its weekly overview showing slight neutrality.

ETH/USD 1-day Technicals
Technical Factors (4-hour Chart):
- Price is far above its 50-period and at its 21-period EMA
- Price is slightly below its bottom Bollinger band
- RSI is neutral (52.43)
- Volume is on slightly above-average levels
Key levels to the upside Key levels to the downside
1: $675 1: $632
2: $738.5 2: $600
3: $817.5 3: $581
Ripple
With XRP’s strong push towards the upside ending on Dec 17, the fourth-largest cryptocurrency by market cap has entered another descending channel. The price was slowly dwindling down over the weekend, breaking the $0.57 support level, and then confirming its position below it. The price even went below the $0.543 support at one point, but quickly recovered.
XRP’s volume is currently almost non-existent, and traders should pay attention to any volume spikes if they intend on trading XRP.
XRP/USD 2-hour Chart
XRP’s technicals are quite mixed, but overall tilted slightly towards the buy-side. It’s 4-hour and daily overviews are bullish-neutral, while its weekly overview shows some hints of bearishness. Its monthly overview, however, is completely bullish.
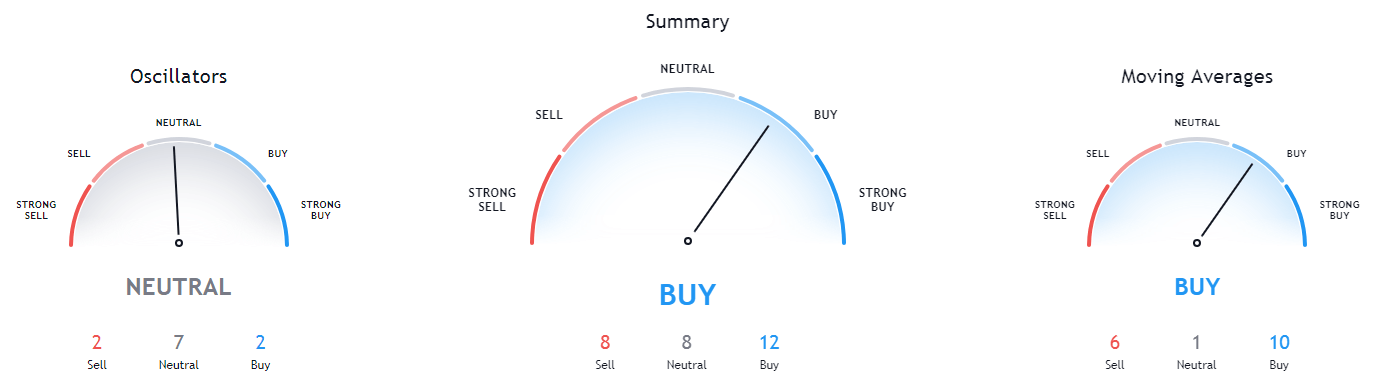
XRP/USD 1-day Technicals
Technical factors (4-hour Chart):
- Its price is currently between its 50-period EMA and its 21-period EMA
- Price slightly above its bottom Bollinger band
- RSI is neutral (48.77)
- Volume has descended to average levels
Key levels to the upside Key levels to the downside
1: $0.57 1: $0.543
2: $0.597 2: $0.5
3: $0.63 3: $0.475
Related posts
 Daily Crypto Review, Sept 4 – Bitcoin at $10,000: What Happened? Detailed Price Level Analysis
 Daily Crypto Review, Sept 8 – Peter Schiff Buying More Bitcoin; Investors Keep Buying BTC Despite Downside Potential
 Daily Crypto Review, Sept 29 – Bitcoin’s Fail to Break $11,000 Causes a Red Day for Crypto: What’s Next?
 Daily Crypto Review, Oct 5 – XRP Skyrockets and Gains Over 9%; Uniswap’s Volume Trumps Coinbase