The cryptocurrency sector bounced back from its recent highs as the news of a new COVID-19 strain came out. Bitcoin is currently trading for $22,716, representing a decrease of 5.01% when compared to yesterday’s value. Meanwhile, Ethereum’s price has decreased by 5.41% on the day, while XRP managed to lose a whopping 16.97%.
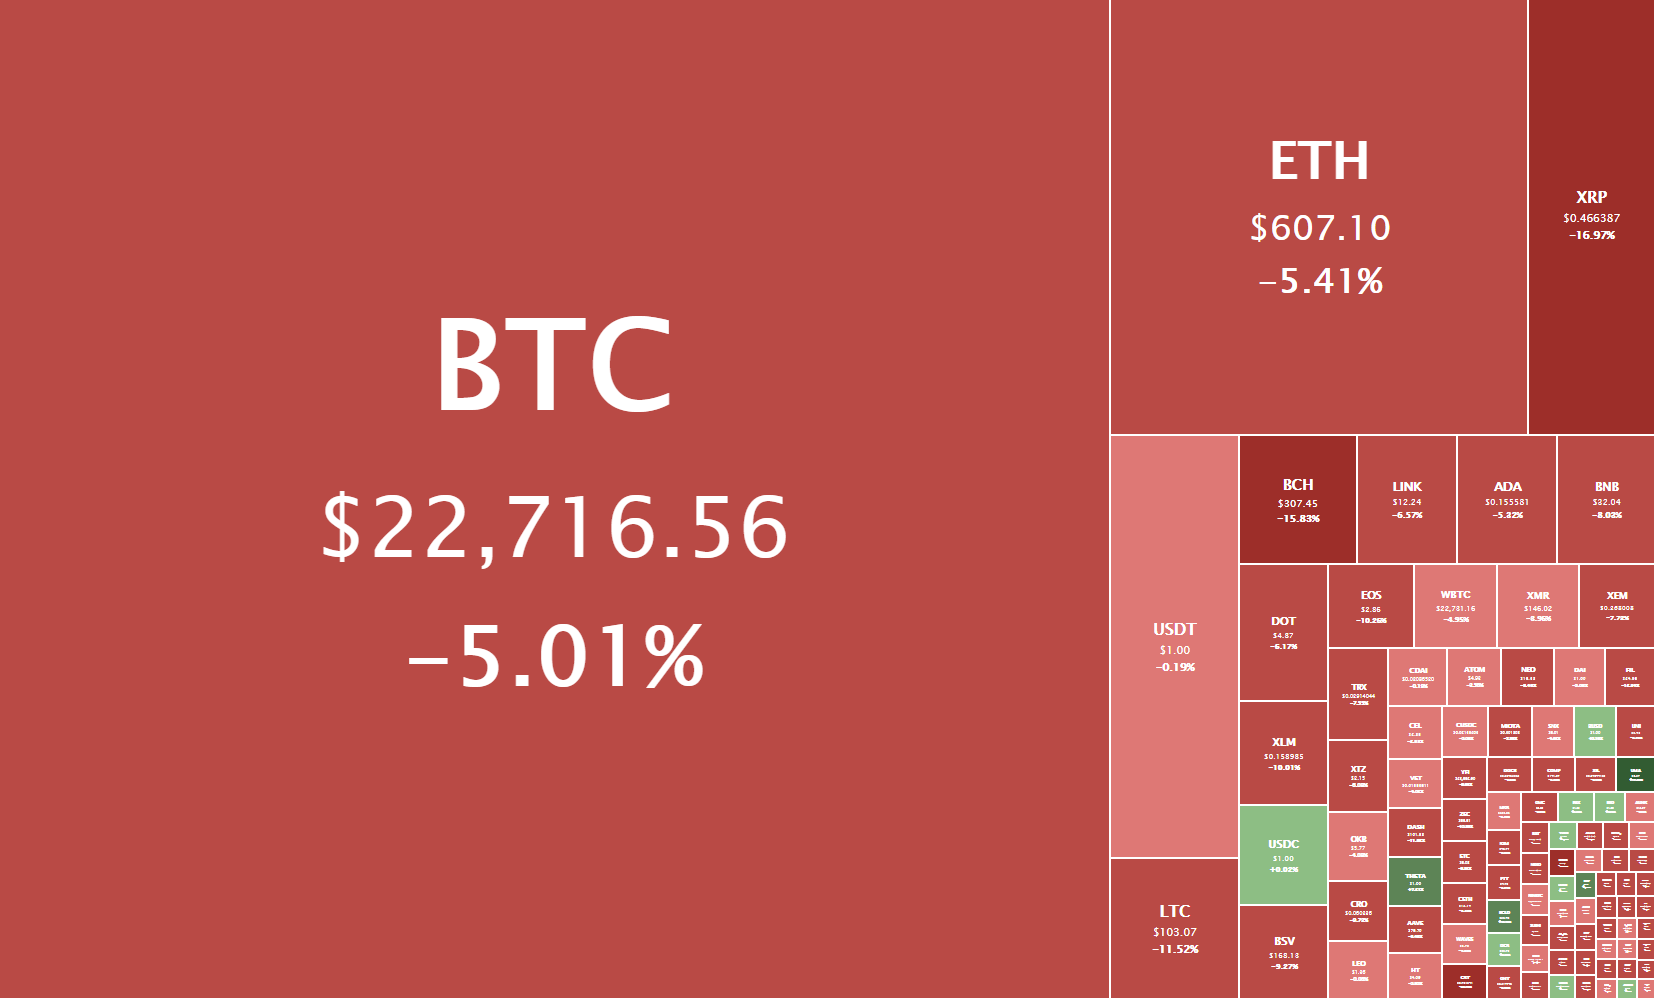
Daily Crypto Sector Heat Map
P2P gained 185.24% in the past 24 hours, making it the most prominent daily crypto gainer by far. It is followed by DMme’s 123.95% and Actinium’s 96.18% gain. On the other hand, Wownero lost 54.05%, making it the most prominent daily loser. It is followed by Tap’s loss of 47.05% and Super Bitcoin’s loss of 46.31%.
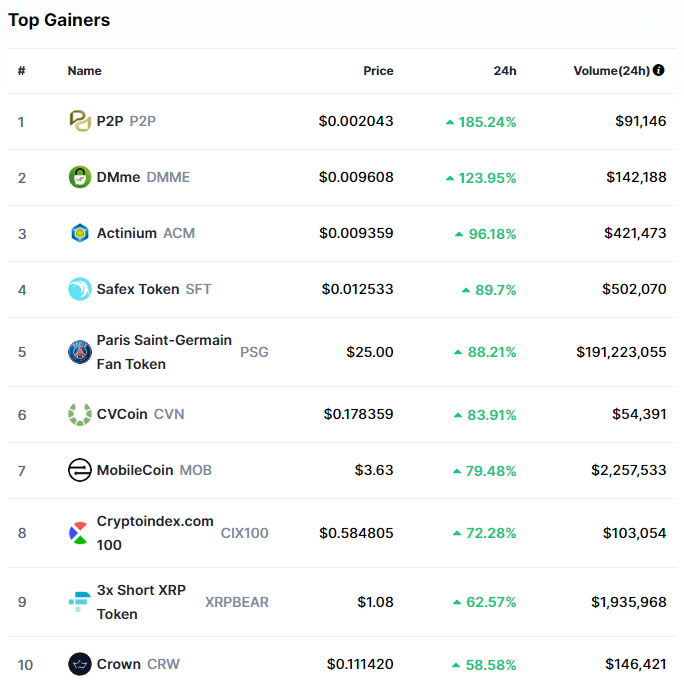
Top 10 24-hour Performers (Click to enlarge)
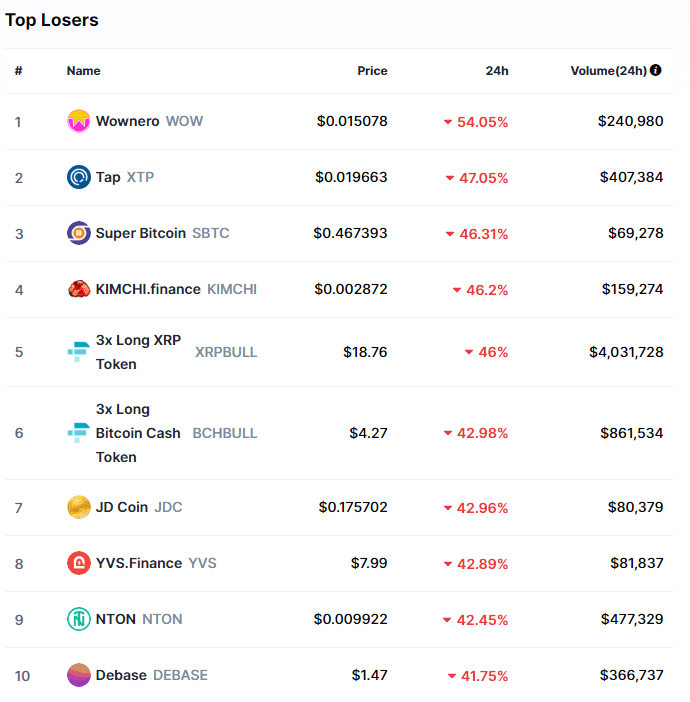
Bottom 10 24-hour Performers (Click to enlarge)
Bitcoin’s market dominance has moved up over one percent since our last report, with its value currently being 66.6%. This value represents a 1.4% difference to the downside than the value it had when we last reported.
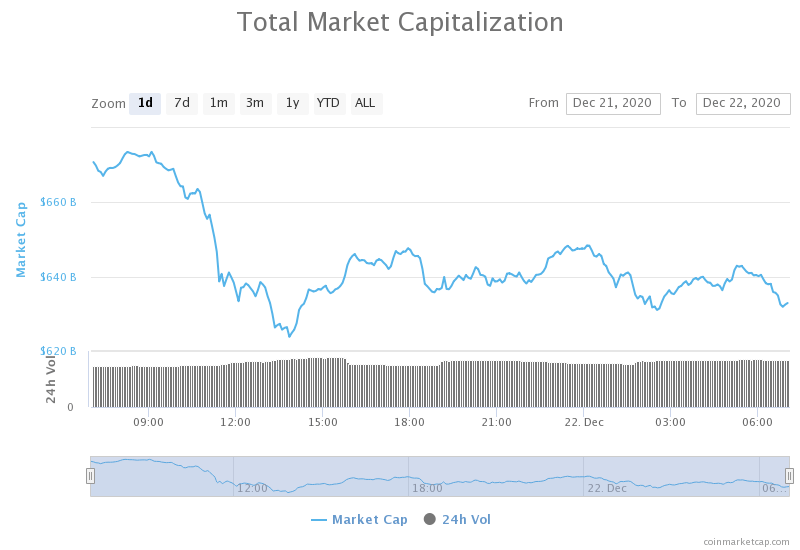
Daily Crypto Market Cap Chart
The cryptocurrency sector capitalization has decreased significantly since we last reported, with its current value being $632.90 billion. This represents a $36.72 billion decrease when compared to our previous report.
_______________________________________________________________________
What happened in the past 24 hours?
_______________________________________________________________________
- The number of bitcoin wallets holding over $10 million rose above 4,500 this weekend (The Block)
- Coinbase asks FinCEN to extend the comment period for proposed wallet rule to the traditional 60 days (The Block)
- Ripple says it will get sued by SEC: report (The Block)
- Traders Furious After Binance Crashes Two Times in Less Than a Week (Cryptobriefing)
- Zilliqa Primed for a Retracement Before Possible Bull Run (Cryptobriefing)
- Grayscale Halts Institutional Purchase of Bitcoin, Ethereum Shares (Cryptobriefing)
- Charlie Lee explains 45% Litecoin (LTC) rally in face of strong Bitcoin dominance run (Cryptoslate)
- Crypto Wall Street: Goldman Sachs to underwrite Coinbase IPO while JPMorgan says Bitcoin “overbought” (Cryptoslate)
- Ledger data leak leaves crypto community furious, here’s what to do next (Cryptoslate)
- Paris Saint-Germain and Juventus fan tokens rally 80% to 160% after listing (Cointelegraph)
_______________________________________________________________________
Technical analysis
_______________________________________________________________________
Bitcoin
Bitcoin experienced a 5% pullback after the news of a new strain of COVID-19 came out. Of course, Bitcoin was not the only one hit, as all traditional asset classes dipped in the past 24 hours as well. The downturn got stopped at the $22,054 level, and quickly sprung up to the current levels.
As mentioned in our previous daily crypto review, Bitcoin would experience an increase in volume as it exits consolidation below the recent highs, which happened today.
BTC/USD 4-hour chart
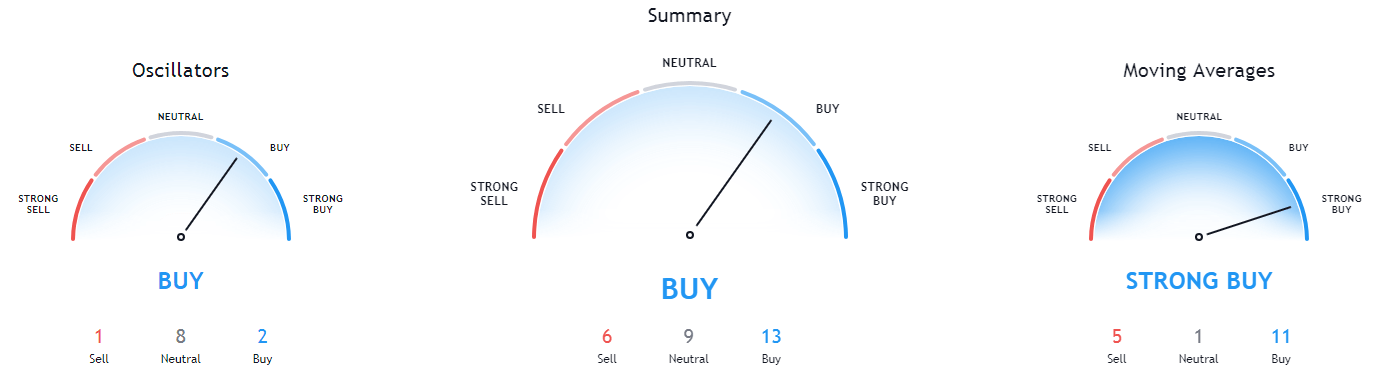
While Bitcoin’s daily technicals are tilted towards the bull side, its 4-hour overview is completely neutral. On the other hand, its weekly and monthly overviews are tilted towards the buy-side, but show hints of neutrality.
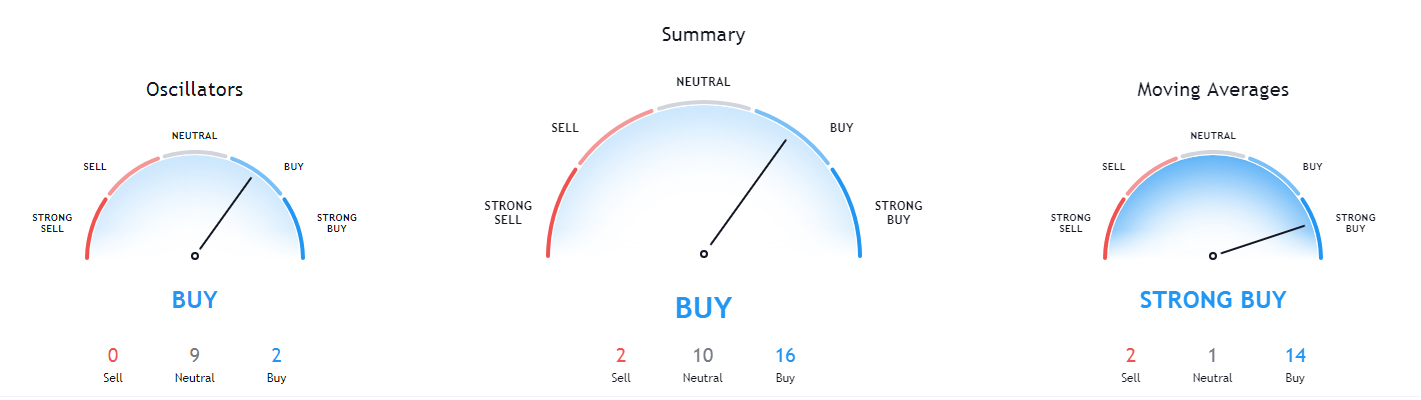
BTC/USD 1-day Technicals
Technical factors (4-hour Chart):
- Price is above its 50-period EMA and below its 21-period EMA
- Price between its bottom and middle Bollinger band
- RSI is neutral (48.91)
- Volume is slightly above average
Key levels to the upside Key levels to the downside
1: $24,315 1: $22,054
2: $24,700 2: $21,350
3: $25,511 3: $19,918
Ethereum
Ethereum has followed Bitcoin to the downside, and lost just over 5% on the day. The second-largest cryptocurrency by market cap fell below the $632 level and attempted to break the $600-$602 support line. However, ETH bulls stopped the downturn, and the cryptocurrency is now consolidating right above this level.
Ethereum’s price movements are pretty tame so far, and traders should pay close attention to Bitcoin and its movement in the near future as Ether seems to follow it almost to the tee.
ETH/USD 4-hour Chart
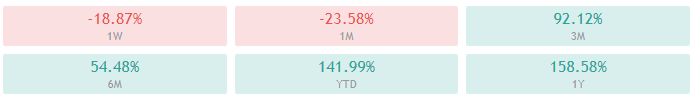
Ethereum’s daily, weekly and monthly technicals show a strong bullish tilt, while its 4-hour overview is tilted towards the sell-side.
ETH/USD 1-day Technicals
Technical Factors (4-hour Chart):
- Price is below both its 50-period and its 21-period EMA
- Price is close to its bottom Bollinger band
- RSI is heading towards being oversold (37.52)
- Volume is on slightly above-average levels
Key levels to the upside Key levels to the downside
1: $632 1: $600
2: $675 2: $581
3: $738.5 3: $564
Ripple
XRP had a horrible 24 hour trading session as its price crashed on Ripple’s announcement that they will most likely get sued by the SEC. This news brought its price down almost 20%, with it currently trading right above the $0.457 level, which stopped XRP from going down further.
XRP traders should pay attention to further updates on the lawsuit news as well as to any volume increase the cryptocurrency experiences.
XRP/USD 4-hour Chart
XRP’s long-term technicals (weekly and monthly) show a slight tilt towards the buy-side, while its short-term technicals (4-hour and daily) are completely bearish.
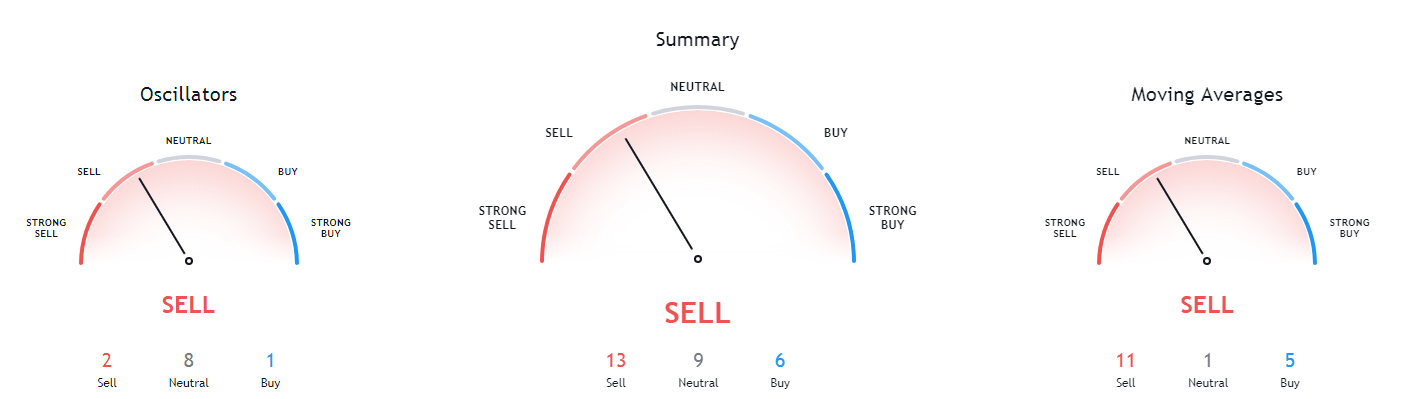
XRP/USD 1-day Technicals
Technical factors (4-hour Chart):
- Its price is currently far below both its 50-period EMA and its 21-period EMA
- Price slightly below its bottom Bollinger band
- RSI is in the oversold territory (25.83)
- Volume has returned to average levels
Key levels to the upside Key levels to the downside
1: $0.5 1: $0.475
2: $0.543 2: $457
3: $0.57 3: $45
Related posts
 Daily Crypto Review, July 15 – Fidelity Goes All-In On Bitcoin; BTC Difficulty At Historic Heights
 Daily Crypto Review, July 22 – Ethereum Passes Bitcoin and Becomes the Most Used Blockchain
 Daily Crypto Review, July 24 – Bitcoin Above $10,000; Ethereum Passing $300
 Daily Crypto Review, Nov 12 – Bitcoin Formed a Triple Top? Ethereum Accidentally Hard Forks