
The cryptocurrency sector had an incredible weekend as Bitcoin skyrocketed towards $28,000. Bitcoin is currently trading for $27,031, representing a decrease of 2.91% compared to yesterday’s value, but a massive increase compared to its value on Friday. Meanwhile, Ethereum’s price has increased by 12.79% on the day, while XRP managed to lose 4.05%.
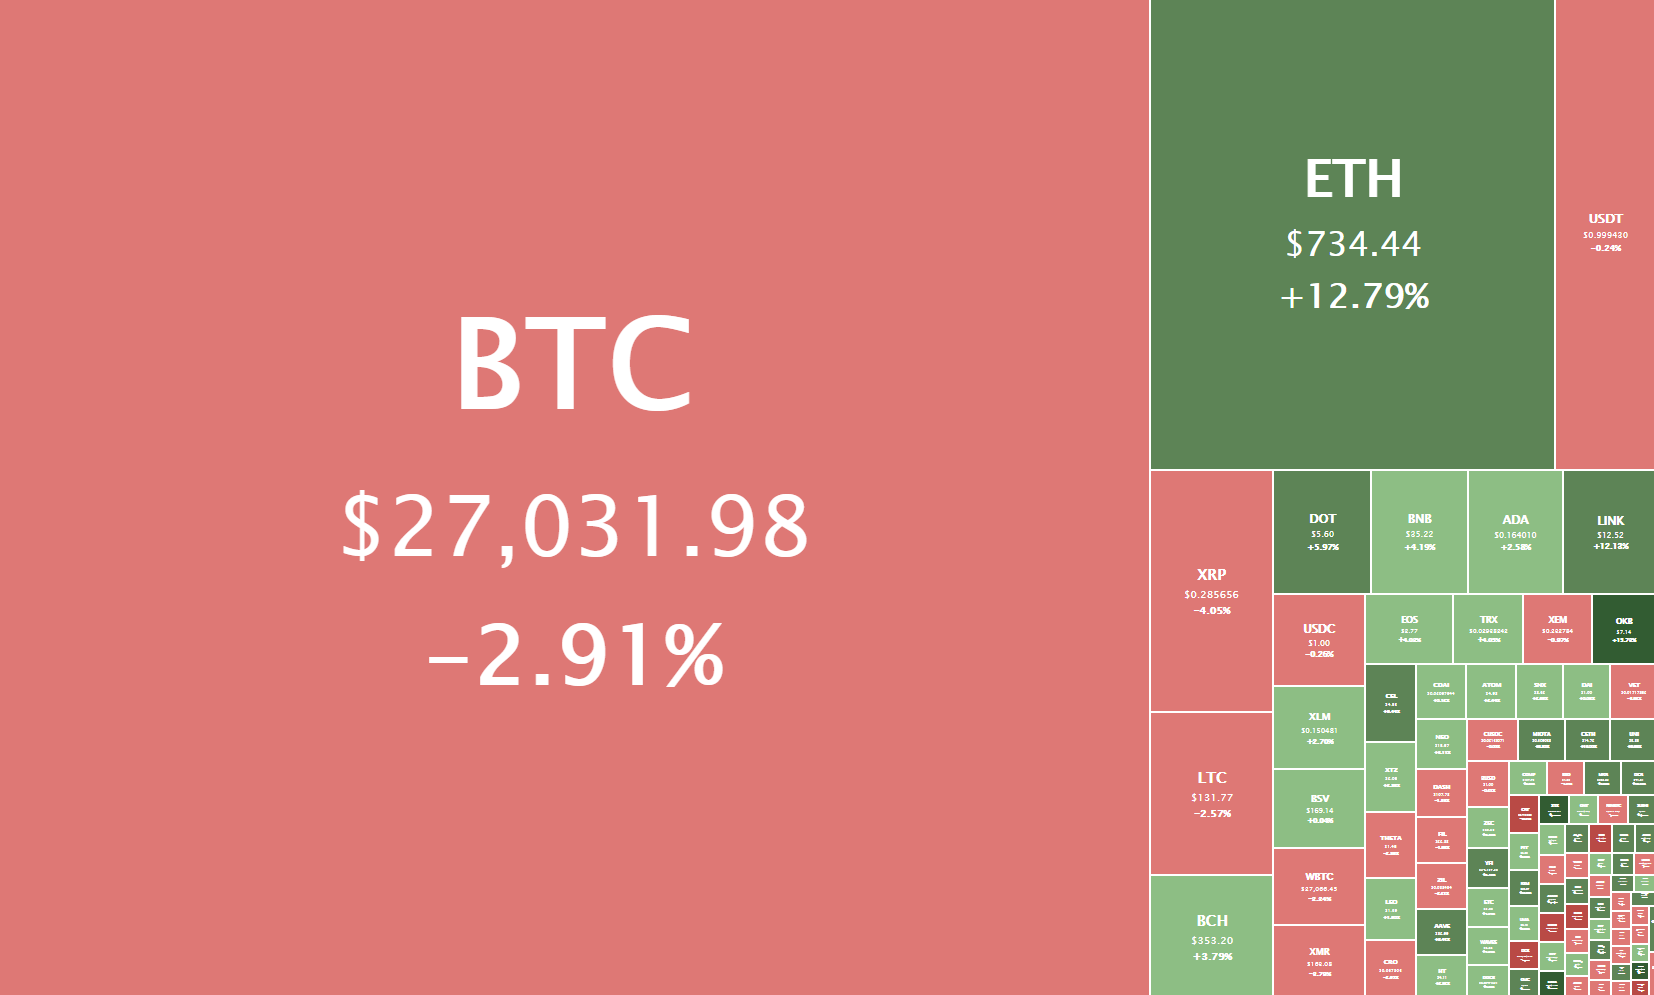
Daily Crypto Sector Heat Map
EncrypGen gained 2787.56% in the past 24 hours, making it the most prominent daily crypto gainer by far. It is followed by Bankacoin’s 212.44% and Trabzonspor Fan Token’s 178.8% gain. On the other hand, CEZO lost 89.89%, making it the most prominent daily loser. It is followed by JD Coin’s loss of 64.79% and Triumph X’s loss of 57.74%.
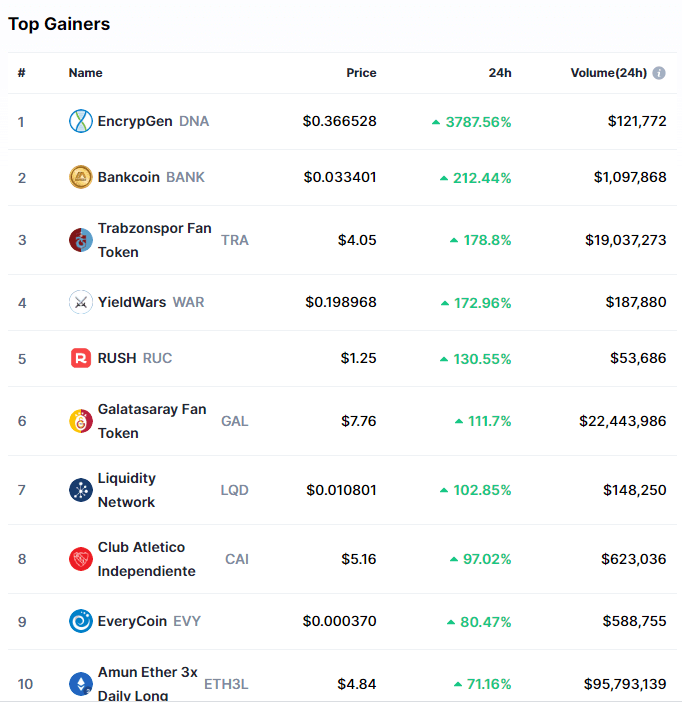
Top 10 24-hour Performers (Click to enlarge)
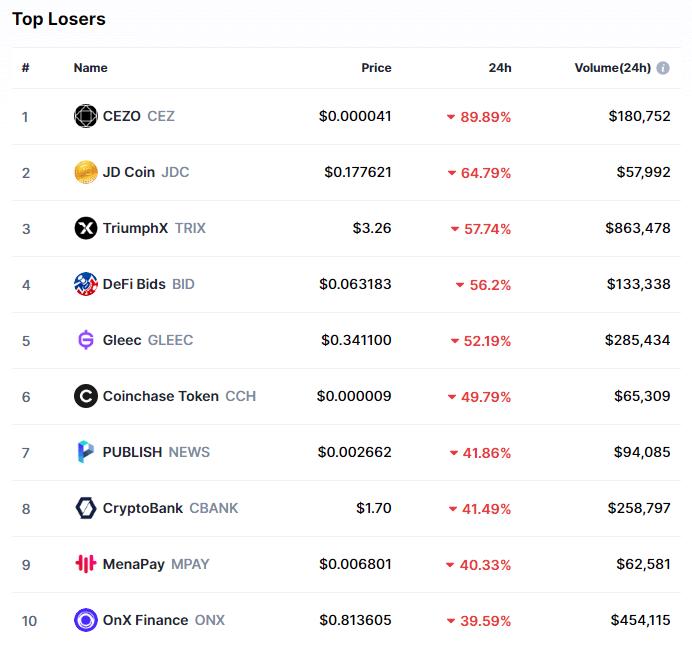
Bottom 10 24-hour Performers (Click to enlarge)
Bitcoin’s market dominance has moved down slightly since our last report, with its value currently being 69.1%. This value represents a 0.25% difference to the downside than the value it had when we last reported.
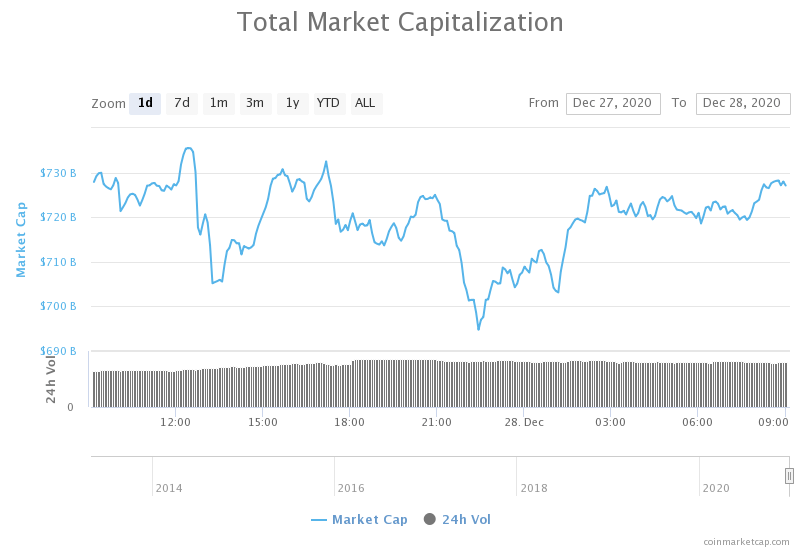
Daily Crypto Market Cap Chart
The cryptocurrency sector capitalization has increased over $100 billion since we last reported, with its current value being $721.10 billion. This represents a $101.89 billion increase when compared to our previous report.
_______________________________________________________________________
What happened in the past 24 hours?
_______________________________________________________________________
- Crypto market maker B2C2 halts XRP trading with US counterparties (The Block)
- S&P 500 companies will hold bitcoin by the end of 2021, majority of The Block’s Outlook Survey respondents say (The Block)
- ETH breaks above $700 to highs not seen since May 2018 (The Block)
- Bitcoin Buys on Christmas Day Have Been Historically Bullish (Cryptobriefing)
- Bitstamp Halts XRP Trading for U.S. Customers (Cryptobriefing)
- Litecoin (LTC) continues to surge with another intraday rally—but why? (Cryptoslate)
- These are the crypto companies that could go public in 2021 (Cryptoslate)
- Deribit Adding Options to Allow Bitcoin Traders to Bet on Rally to $120K, $140K (Coindesk)
- BlackRock Seeks VP Blockchain Lead to ‘Drive Demand’ for Firm’s Crypto Offerings (Coindesk)
- After promoting Bitcoin merch discount, Mark Cuban praises BTC monetary policy (Cointelegraph)
_______________________________________________________________________
Technical analysis
_______________________________________________________________________
Bitcoin
Bitcoin did not sleep this weekend as it took its time to push towards new all-time highs. The best-known cryptocurrency pushed towards the upside, reaching as high as $28,391 at one point. It is now consolidating around the $27,000 level and preparing for the next move.
Our Fib extensions drawn on Friday worked exactly as expected, with Bitcoin respecting every single one of them. With all of them still being a valid choice, traders should either look for a bounce off the immediate support levels or increased volume followed by a sharp increase in price. Trading Bitcoin’s pullbacks is not exactly the best option at the moment.
BTC/USD 4-hour chart
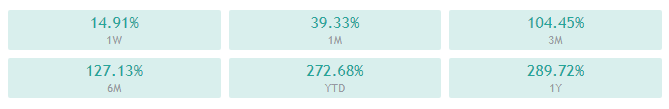
While Bitcoin’s 4-hour and weekly technicals show a full tilt towards the buy-side, its daily and monthly technicals show some neutrality signs.
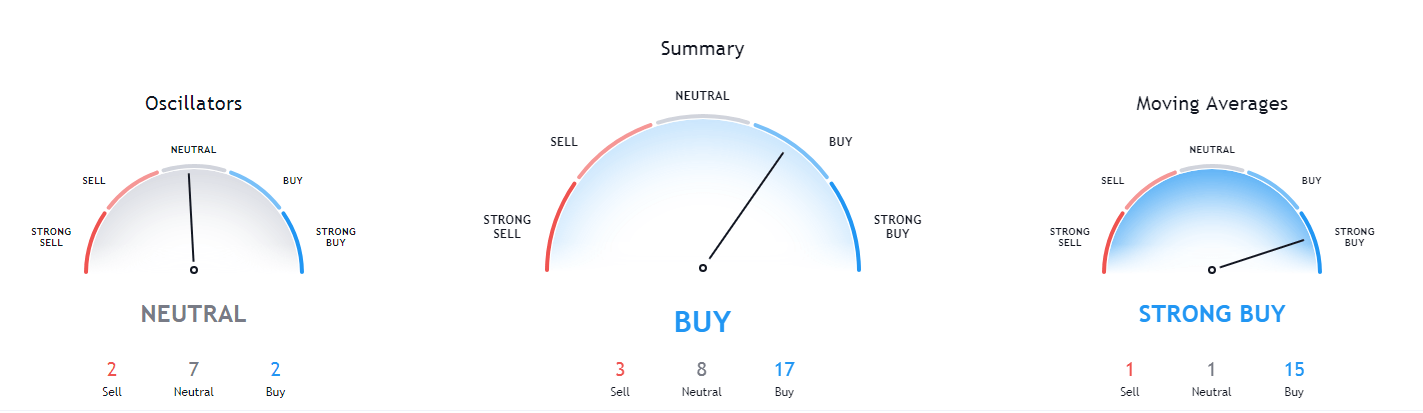
BTC/USD 1-day Technicals
Technical factors (4-hour Chart):
- Price is above its 50-period EMA and slightly above its 21-period EMA
- Price is slightly above its middle Bollinger band
- RSI is neutral (62.10)
- Volume is slightly above average
Key levels to the upside Key levels to the downside
1: $28,391 1: $25,512
2: $29,000 2: $24,696
3: $30,000 3: $24,315
Ethereum
While Ethereum did manage to score some gains over the weekend, its upside got overshadowed by Bitcoin’s growth. However, the second-largest cryptocurrency by market cap has decided to make that up by suddenly pushing from $624 all the way up to $738. While the move seemingly ended here, it is not yet certain whether the price will break the level or go even higher, or start its consolidation at slightly lower levels.
Traders should utilize the volume indicator, order books, and well-established support/resistance levels to its fullest to catch these explosive trades while remaining safe.
ETH/USD 4-hour Chart
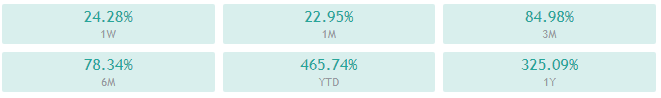
Ethereum’s shorter time-frames are completely bullish, while its longer-time frames show slight neutrality signs.
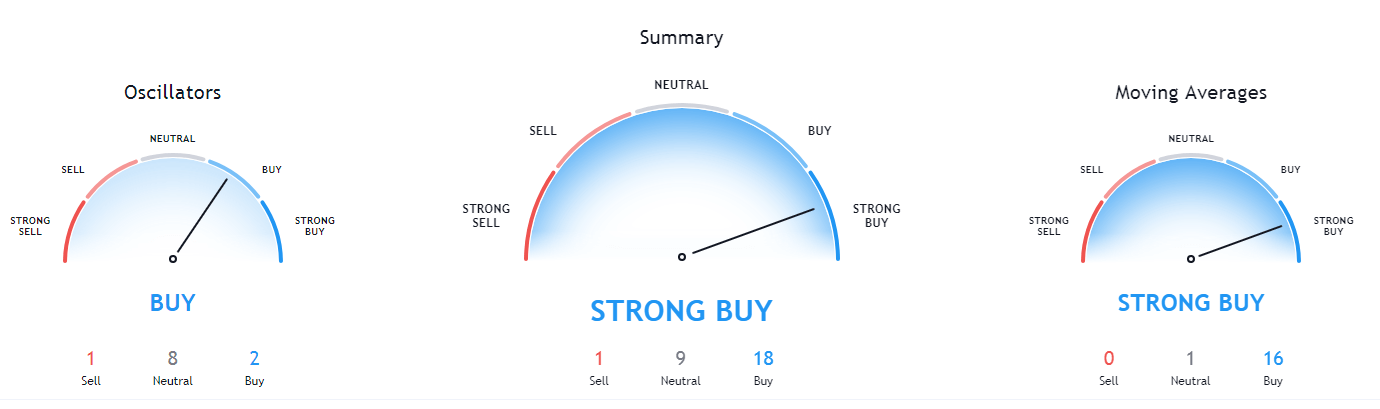
ETH/USD 1-day Technicals
Technical Factors (4-hour Chart):
- Price is far above both its 50-period and its 21-period EMA
- Price is at its top Bollinger band
- RSI has stepped into the overbought territory (71.68)
- Volume is trading on above-average levels
Key levels to the upside Key levels to the downside
1: $738 1: $675
2: $800 2: $632
3: $900 3: $600
Ripple
XRP has been trading on low volume and slowly descending after a brief rally to $0.385. The fourth-largest cryptocurrency keeps getting crushed by various companies dropping support or liquidating their XRP positions after Ripple and its executives got sued by the SEC.
XRP traders should (more than anything) pay attention to the news. However, there are many other cryptocurrencies with much safer and potentially more profitable trading setups at the moment.
XRP/USD 4-hour Chart
XRP’s technicals on all time-frames slightly tilted towards the sell-side, but they all show some signs of uncertainty.
XRP/USD 1-day Technicals
Technical factors (4-hour Chart):
- Its price is currently far below its 50-period EMA and slightly below its 21-period EMA
- Price slightly below its middle Bollinger band
- RSI has left the oversold territory (37.46)
- Volume is returning to average levels
Key levels to the upside Key levels to the downside
1: $0.30 1: $0.25
2: $0.358 2: $0.214
3: $0.475
Related posts
 Daily Crypto Review, Feb 13 – Altcoin season finally here? BTC right under $10,500
 Daily Crypto Review, Feb 14 – Cryptos consolidating as BTC fails to break $10,500
 Daily Crypto Review, Feb 18 – Altcoins on the rise yet again; India voting with Blockchain
 Daily Crypto Review, Feb 19 – IRS aiming at Crypto regulation; BTC over $10,000 once again