Categories
Crypto Market Analysis

BTC/USD Chart Overview + Possible Outcomes

In this weekly BTC /USD analysis, we will be taking a look at the most recent events, the current technical formations, as well as discussing possible outcomes.

Overview

Bitcoin has spent the week vigorously pushing towards the upside. The move went parabolic as soon as BTC crossed the $13,900 mark and entered the $14,000 zone. While the surge got stopped just before it hit $16,000, there is a lot of potential upside as there is practically no resistance holding Bitcoin from reaching its all-time high. However, many traders are taking profits and playing it safe out of fear of ending up the same way they did in 2017/2018. This has caused BTC to lose momentum and, most likely, look for a pullback soon.

Technical factors


Bitcoin has conquered the ~15,000 level after a week of constant pressure to the upside. The largest cryptocurrency by market cap is currently consolidating right above the $15,480 support level, which will act as a pivot point and a trading direction decider. The next day or two will be crucial for Bitcoin’s price movement in the short future.

While Bitcoin’s sentiment is extremely bullish at the moment, there is no denying that a pullback is quite possible (and maybe even optimal). As there are no set resistance levels to the upside (because Bitcoin only visited these price levels during the bull run of 2017), we are using Fib retracements as well as small consolidation points from that time to determine possible consolidation/direction change spots.

Another thing to note is that, as of Oct 29, the hash ribbons indicator is showing miner capitulation, sending out a major buy signal.

Likely Outcomes

Bitcoin has two main scenarios it can play out, and both end up with the price pulling back to stabilize and consolidate a bit. The possibility of these plays happening is slightly in favor of the second scenario, but it mainly depends only on where Bitcoin ends up (above or below its pivot point).

  1. If Bitcoin remains above $15,480, we may expect further attempts of conquering the upside. The next target to the upside are the $16,000 psychological resistance, 23.6% Fib retracement level (sitting at $16,570) and $16,665. If Bitcoin pushes towards the upside, we are almost certainly expecting strong resistance at these levels and an almost certain pullback in the short-term.
  2. The other scenario may be slightly more likely, and involves Bitcoin rejecting the current level and falling below its pivot point. In this case, the largest cryptocurrency by market cap will look for a support level, and will most likely find it at the $14,640 level or the 38.2% Fib retracement level (sitting at $14,380).

While moves which include Bitcoin moving straight up or down and ignoring these support/resistance levels are possible, they are far less likely and would have to be caused by some fundamental even rather than just price action and technicals.

Categories
Crypto Market Analysis

Daily Crypto Review, Nov 6 – Bitcoin Zooming Past $15,000: How Far Can it Go Before Pulling Back?

The cryptocurrency sector has exploded to the upside as Bitcoin keeps paving the path towards highs only seen during the bull run of 2017/2018. The largest cryptocurrency by market cap is currently trading for $15.632, representing an increase of 10.1% on the day. Meanwhile, Ethereum gained 7.74% on the day, while XRP gained 4.5%.

 Daily Crypto Sector Heat Map

Uniswap gained 28.39% in the past 24 hours, making it the most prominent daily gainer out of the top100 cryptos ranked by market capitalization. It is closely followed by Aave’s gain of 25.21% and NEAR Protocol’s 23.87% gain. On the other hand, The Midas Touch Gold lost 6.16%, making it the most prominent daily loser. It is followed by Numeraire’s loss of 5.03% and Celo’s loss of 3.94%.

Top 10 24-hour Performers (Click to enlarge)

Bottom 10 24-hour Performers (Click to enlarge)

Bitcoin’s market dominance level has increased slightly since we last reported, with its value is currently staying at 65.3%. This value represents a 0.4% difference to the upside when compared to the value it had yesterday.

Daily Crypto Market Cap Chart

The crypto sector capitalization has skyrocketed in the past 24 hours. Its current value is $440.94 billion, representing a $28.77 billion increase compared to our previous report.

_______________________________________________________________________

What happened in the past 24 hours?

_______________________________________________________________________

_______________________________________________________________________

Technical analysis

_______________________________________________________________________

Bitcoin

The largest cryptocurrency by market capitalization has surged past the $15,000 psychological resistance and entered the zone last seen in Jan 2018, right before the BTC crash. Bitcoin scored double-digit gains on the day and destroyed the $14,640 resistance on the way, turning it into support. While it is currently slowing down as it is approaching $16,000, many analysts call for $17,000 before a pullback.

Traders should wait for Bitcoin to start pulling back if they want a safer trade, or they can ride the wave whenever Bitcoin’s price spikes if they are quick on their feet to enter and leave the trade.

BTC/USD 4-hour Chart

Bitcoin’s technicals are extremely bullish on all time-frames, and no time-frame is showing any signs of bearishness or neutrality.

BTC/USD 1-day Technicals

Technical factors (4-hour Chart):
  • Price is well above both its 50-period EMA and its 21-period EMA
  • Price is at its top Bollinger band
  • RSI is heavily in the overbought zone (79.75)
  • Volume is elevated
Key levels to the upside          Key levels to the downside

1: $15,420                                 1: $14,640

2: $16,665                                 2: $14,100

3: $17,260                                  3: $13,900

Ethereum

Ethereum has, due to Bitcoin pulling it up as well as due to the hype created around its 2.0 version coming out, surged and almost scored a double-digit gain on the day. The second-largest cryptocurrency by market cap has established itself back in the ascending channel after briefly dropping out of it. However, that wasn’t enough for the Ethereum bulls as they tried to push its price above the channel completely.

As the upper channel line held amazingly and stopped Ethereum’s rise, we can conclude that (unless Bitcoin doesn’t have any extreme surges), Ethereum traders can safely trade within a range bound by the ascending channel.


ETH/USD 4-hour Chart

Ethereum’s technicals are somewhat neutral on the 4-hour and daily time-frames, while its longer time-frames show a heavy tilt towards the buy-side.

ETH/USD 1-day Technicals

Technical Factors (4-hour Chart):
  • The price is well above both its 50-period and its 21-period EMA
  • Price is at its top Bollinger band
  • RSI is extremely overbought (78.03)
  • Volume is elevated
Key levels to the upside          Key levels to the downside

1: $445                                     1: $420

2: $451                                     2: $415 

3: $490                                      3: $400

Ripple

As we predicted in our previous article, the fourth-largest cryptocurrency by market cap has broken the triangle formation that was forming from Nov 3. The price has sparked up by Bitcoin’s push towards the upside, moved to the upside as well, reaching past the $0.2454 resistance level and up towards $0.25.

One thing to note is that, while XRP has managed to break $0.2454, it needs to confirm its position above it in order to be safe in the short-term.

XRP/USD 4-hour Chart

XRP’s technicals on the 4-hour, daily, and weekly chart are slightly tilted towards the buy-side but are not completely bullish. Its monthly overview, however, is tilted towards the sell-side.

XRP/USD 1-day Technicals

Technical factors (4-hour Chart):
  • The price is well above its 50-period EMA and its 21-period EMA
  • Price at its top Bollinger band
  • RSI is on the verge of being overbought (68.49)
  • Volume is elevated
Key levels to the upside          Key levels to the downside

1: $0.26                                 1: $0.2454

2: $0.266                                     2: $0.235

3: $0.27                                  3: $0.227


Categories
Crypto Market Analysis

Daily Crypto Review, Nov 5 – Bitcoin Finally Above $14,000 as the Bull Run Continues; Ethereum 2.0 Contract Release Live

The cryptocurrency sector has explosively pushed towards the upside as Bitcoin broke the $14,316 and entered the territory explored only during the 2017/2018 bull run and last seen in July 2018. The largest cryptocurrency by market cap is currently trading for $14,316, representing an increase of 5.54% on the day. Meanwhile, Ethereum gained 4.78% on the day, while XRP gained 0.67%.

 Daily Crypto Sector Heat Map

HedgeTrade gained 38.24% in the past 24 hours, making it the most prominent daily gainer out of the top100 cryptos ranked by market capitalization. It is closely followed by Celsius’ gain of 9.37% and CyberVain’s 7.78% gain. On the other hand, Uniswap lost 16.95%, making it the most prominent daily loser. It is followed by yearn.finance’s loss of 16.73% and ABBC Coin’s loss of 9.35%.

Top 10 24-hour Performers (Click to enlarge)

Bottom 10 24-hour Performers (Click to enlarge)

Bitcoin’s market dominance level has increased slightly since we last reported, with its value is currently staying at 64.9%. This value represents a 0.6% difference to the upside when compared to the value it had yesterday.

Daily Crypto Market Cap Chart

The crypto sector capitalization has increased over the course of the day. Its current value is $412.17 billion, representing a $7.35 billion increase when compared to our previous report.

_______________________________________________________________________

What happened in the past 24 hours?

_______________________________________________________________________

_______________________________________________________________________

Technical analysis

_______________________________________________________________________

Bitcoin

The largest cryptocurrency by market capitalization had finally broken the $13,900 resistance with confidence and confirmed its position above it. Not only that, but it has entered the price level last seen in July 2018. This means that there will be a lot of uncertainty and unset support and resistance levels, and also a lot of random volatility due to various entities taking profit and new investors FOMOing in.

However, a couple of potential resistance levels have formed, one of them being at $14,640. Traders should pay close attention to this level as well as use Fib retracements to create possible targets when trading.

BTC/USD 1-hour Chart

Bitcoin’s technicals on showing a strong buy at all time-frames. No neutrality is being shown as Bitcoin is currently in an extremely favorable place price-wise.

BTC/USD 1-day Technicals

Technical factors (4-hour Chart):
  • Price is above both its 50-period EMA and its 21-period EMA
  • Price is slightly below its top Bollinger band
  • RSI is coming out of the overbought zone (69.10)
  • Volume is average
Key levels to the upside          Key levels to the downside

1: $14,640                                 1: $14,100

2: $16,665                                 2: $13,900

3: $17,260                                  3: $13,570

Ethereum

Bitcoin’s push towards the upside has fueled Ethereum, and the hype surrounding its version 2.0 launch, managed to surge above the ascending channel bottom line and re-enter the channel once again. The second-largest cryptocurrency by market cap reached as high as $409 before pulling back. It is now consolidating at slightly below $400.

If we don’t see any explosive moves from BTC and ETH in the short term, we can expect Ethereum to pull back slightly more and test the ascending channel’s bottom line as support. Traders can wait for the results of the “test” and trade off of that.

ETH/USD 4-hour Chart

Ethereum’s technicals on all time-frames are tilted towards the buy-side. However, its shorter time-frames (4-hour and daily) are showing hints of neutrality, while its longer time-frames are completely bullish.

ETH/USD 1-day Technicals

Technical Factors (4-hour Chart):
  • The price is above both its 50-period and its 21-period EMA
  • Price is between its middle and top Bollinger band
  • RSI is neutral (57.63)
  • Volume is average
Key levels to the upside          Key levels to the downside

1: $400                                     1: $378

2: $415                                     2: $371

3: $420                                      3: $361

Ripple

The fourth-largest cryptocurrency by market cap hardly even moved in the past 24 hours despite the rest of the crypto market booming. As we mentioned in our previous article, if Bitcoin’s next explosive move doesn’t fuel XRP, it will move within a range bound by $0.235 and $0.2454, exactly what happened.

XRP seems to be creating a triangle formation on its 4-hour chart. If that is the case, it is bound to move above or below it extremely soon. However, the move will most likely be stopped at its immediate support or resistance level.

XRP/USD 4-hour Chart

XRP’s technicals have improved slightly, as they were extremely bearish the last time we reported. While its daily overview is still heavily tilted towards the sell-side, its weekly and monthly overviews are almost neutral (though still slightly tilted towards the bear side), and its 4-hour time-frame is even showing some bullishness.

XRP/USD 1-day Technicals

Technical factors (4-hour Chart):
  • The price is below its 50-period EMA and at its 21-period EMA
  • Price at its middle Bollinger band
  • RSI is neutral (48.73)
  • Volume is average
Key levels to the upside          Key levels to the downside

1: $0.2454                                 1: $0.235

2: $0.26                                     2: $0.227

3: $0.266                                  3: $0.221


Categories
Crypto Guides

An Introductory Guide To NEAR Protocol

Introduction

NEAR Protocol is a smart contract compatible cryptocurrency, a highly scalable and low-cost platform for developers, allowing them to create dApps or decentralized apps for various purposes. In the cryptocurrency space, the competition can turn out to be vicious. Nevertheless, cooperation is also widespread in the crypto space, particularly because it is a new asset class.

Crypto creators and experts have understood that it is highly beneficial to cooperate rather than to compete for the time being. And you will struggle to find any crypto project better than NEAR Protocol when it comes to cooperation in the cryptocurrency space. If you are interested in understanding what NEAR Protocol actually is, including its elements and features, this post will explain everything you need to know about it. Let’s get started.

What is NEAR Protocol?

NEAR or NEAR Protocol is a cryptocurrency blockchain that features smart contract functionality. NEAR Protocol is designed and developed to facilitate the creation of decentralized applications. It is also developer-friendly and is interoperable with Ethereum as well.

Coming down to its functionality, NEAR Protocol uses a block generation mechanism known as ‘Doomslug’ that processes over 100,000 transactions per second and a Sharding mechanism known as ‘Nightshade’ that splits the entire cryptocurrency network into multiple portions. The transaction fees on NEAR Protocol are so low that it requires a special unit of measurement for quantification called ‘yocto.’

Furthermore, the developers at NEAR Protocol are working to make the platform secure enough to handle valuable assets like identity or money. And with the likes of proof of stake, combined with sharding, the platform can prove useful for everyday customers.

How does it work?

NEAR Protocol is a dedicated proof of stake blockchain, which, to optimize performance, uses sharding. Sharding is quite different in NEAR Protocol as compared to other cryptocurrencies. That is, all shards on NEAR Protocol are considered a part of the same network. Using Nightshade, the cryptocurrency is interoperable with ETH using Rainbow Bridge. The Nightshade works to add a single snapshot of each shard’s existing state on the NEAR Protocol blockchain. Each shard has its own set of validator nodes that broadcast the shard’s existing state each time a block is produced.

Elements and Features of NEAR Protocol

NEAR Protocol comes with numerous functionalities that cater to the validators, end-users, and developers differently.

  • NEAR Protocol allows the developers to prepay and sign the transactions in the end-users’ best interest, significantly reducing the need for the users to know about how the decentralized application works and other technical anomalies.
  • It boasts a ‘Progressive UX,’ which is specifically designed for users so that they can use the platform without requiring to use tokens or wallets.
  • When we talk about the validators, NEAR Protocol allows them to create an assortment of offerings for the users.

Conclusion

It is still too early to say whether people will accept NEAR Protocol or will it dethrone Ethereum. But it is certainly not impossible. Given the features and functionalities of the cryptocurrency, it can be said that NEAR Protocol is the future of the cryptocurrency market, especially because it can help create state-of-the-art decentralized applications.

Categories
Crypto Market Analysis

Daily Crypto Review, Nov 4 – Bitcoin Contesting $14,000; Crypto Sector in the Green

The cryptocurrency sector has explosively pushed towards the upside as Bitcoin is contesting the $14,000 level yet again. The largest cryptocurrency by market cap is currently trading for $13,863, representing an increase of 3.81% on the day. Meanwhile, Ethereum gained 2.93% on the day, while XRP gained 3.67%.

 Daily Crypto Sector Heat Map

The Midas Touch Gold gained 13.90% in the past 24 hours, making it the most prominent daily gainer out of the top100 cryptos ranked by market capitalization. It is closely followed by ABBC Coin’s gain of 11.68% and Ampleforth’s 9.31% gain. On the other hand, CyberVain lost 9.64%, making it the most prominent daily loser. It is followed by NEAR Protocol’s loss of 9.57% and VeChain’s loss of 8.87%.

Top 10 24-hour Performers (Click to enlarge)

Bottom 10 24-hour Performers (Click to enlarge)

Bitcoin’s market dominance level has increased slightly since we last reported, with its value is currently staying at 64.3%. This value represents a 0.3% difference to the upside when compared to the value it had yesterday.

Daily Crypto Market Cap Chart

The crypto sector capitalization has increased over the course of the day. Its current value is $399.05 404.52 billion, representing a $10.79million increase when compared to our previous report.

_______________________________________________________________________

What happened in the past 24 hours?

_______________________________________________________________________

_______________________________________________________________________

Technical analysis

_______________________________________________________________________

Bitcoin

The largest cryptocurrency by market capitalization had a great day as its price moved above the $13,900 mark. While the move got stopped out near $14,000, its price is still above the level it just passed.

Due to no strong pullbacks happening at the moment and Bitcoin staying within a very narrow range ($13,000-$14,100), we can expect a strong move to either side very soon. Traders should pay attention to any attempt to break its support/resistance levels Bitcoin makes.

BTC/USD 4-hour Chart

Bitcoin’s technicals on all time-frames are bullish, with the weekly overview being the only one with a considerable amount of neutrality.

BTC/USD 1-day Technicals

Technical factors (4-hour Chart):
  • Price is above both its 50-period EMA and its 21-period EMA
  • Price above its middle Bollinger band
  • RSI is neutral (58.89)
  • Volume is average
Key levels to the upside          Key levels to the downside

1: $13,900                                 1: $13,570

2: $14,000                                 2: $13,180

3: $14,100                                  3: $13,000

Ethereum

Ethereum has bounced off of its $371 support level and started moving back towards its ascending channel. However, the channel bottom line was too strong to pass, and Ethereum ended up consolidating slightly below it. As time passes, the possibility of Ethereum breaking the level will be diminished due to the constant increase in the line’s price position.

Ethereum is now trading in a range between $378 and the ascending channel bottom line, which can be taken advantage of. However, Bitcoin is preparing a move, and Ethereum will most likely respond to it by following its direction and intensity, which can be used by the traders.

ETH/USD 4-hour Chart

Ethereum’s short-term technicals are unclear (4-hour overview being slightly bearish while daily overview is slightly bullish), while its longer-term technicals are heavily tilted towards the buy-side.

ETH/USD 1-day Technicals

Technical Factors (4-hour Chart):
  • The price is below its 50-period and at its 21-period EMA
  • Price is at its middle Bollinger band
  • RSI is neutral (49.02)
  • Volume is average
Key levels to the upside          Key levels to the downside

1: $400                                     1: $378

2: $415                                     2: $371

3: $420                                      3: $361

Ripple

The fourth-largest cryptocurrency by market cap took the day to push back above $0.235 and consolidate above it. This returned XRP back within a range bound by $0.235 to the downside and $0.2454 to the upside.

As we mentioned in our previous articles, if the next Bitcoin’s explosive move does not fuel XRP, traders can comfortably trade sideways action within this range. If, however, Bitcoin’s price moves to either side and XRP follows the direction, traders can use this event to trade alongside the direction XRP is moving in.

XRP/USD 4-hour Chart

XRP’s technicals on all time-frames are heavily tilted towards the sell-side. However, the longer the time-frame, the more neutral the technicals are, with the monthly indicator being very close to being completely neutral.

XRP/USD 1-day Technicals

Technical factors (4-hour Chart):
  • The price below its 50-period EMA and above its 21-period EMA
  • Price is slightly above its middle Bollinger band
  • RSI is close to the oversold territory (50.52)
  • Volume is slightly above average
Key levels to the upside          Key levels to the downside

1: $0.2454                                 1: $0.235

2: $0.26                                     2: $0.227

3: $0.266                                  3: $0.221


Categories
Crypto Guides

Looking For Easy Crypto Payment? Switch To NOWPayments!

Introduction

Digital payment has undoubtedly blessed the financial industry by offering a seamless transaction mode. With the inclusion of blockchain, things have become even more efficient. More and more blockchain platforms have been introducing their tokens and coins to facilitate blockchain-based transactions. Crypto holders are making use of their crypto coins to conduct everyday financial transactions.

Owing to the increasing demand for crypto payments, blockchain platforms are designing their currency. ChangNow has also been working to introduce NOWPayments to offer a convenient blockchain payment service that will accept crypto coins all over the globe. In this article, we are going to talk about NOWPayment and everything that has to be discovered regarding this revolutionized payment service.

What is NOWPayments?

NOWPayments is powered by ChangeNOW and has been operating in the industry since 2019. It is also tied up worth Ledger, Binance, and Atomic Wallet to increase its services’ efficiency. NOWPayments has been designed to primarily offer a crypto payment gateway for both customers and merchants and make transactions seamless. It allows merchants to accept crypto payment on their online stores, social media accounts, and website. Being a non-custodial service, NOWPayments will not store funds in any means. It supports more than 50 cryptocurrencies and facilitates transactions at lower fees.

What Are The Benefits of Choosing NOWPayments?

As online/offline merchants and crypto coin holders are increasing at a staggering rate, it has become essential to introduce a hassle-free payment gateway. NOWPayment is that one-stop destination where you can conduct crypto transactions without any hassle. It has partnered with all the popular crypto exchanges to strengthen its potential and meet customers’ needs. Here are a few crucial benefits of using NOWPayments-:

Faster Payments: NOWPayments is known for its lightning-fast payments. Unlike other gateways, NOWPayments will complete the transaction within minutes.

Non-Custodial Services: There are no intermediaries involved in the transactions except holding the fees. So, the payments are directly forwarded to the merchants.

Comprehensive Support: Complete guidance and inclusive support is another major takeaway of this payment gateway. From installing plugins to integrating API, you can get all answers to your queries via a 24/7 support team.

Transparency Compliance: NOWPayment prioritizes the safety of the clients and partners. The legal team dedicatedly works to ensure compliance. It secures all the transactions and safeguards it from illegal acts, and protects the users’ rights.

How To Integrate NOWPayments?

NOWPayment claims to be the easiest and best way to accept crypto payments. The easy-to-use interface makes NOWPayments offers hassle-free, secure, and simple API that you can integrate into any platform. Follow the below steps-:

  • Sign up for NOWPayment with email and set up your account
  • Access the Dashboard after signing up
  • Go to Add New Key and save the API
  • Visit the Outcome Wallet page to access your digital wallet
  • Use the API to send and accept crypto payments

The Bottom Line

NOWPayments has established a safer, reliable, and faster crypto payment gateway that everyone needed. It can be embedded in online stores and websites to make payment easier for customers and merchants. The above mentioned were all the vital information you need to know about this amazing payment gateway.

Categories
Crypto Market Analysis

Daily Crypto Review, Nov 3 – Crypto Sector in the Red; Altcoins Plummeting

The cryptocurrency sector experienced an overall price drop as Bitcoin pushed down towards sub-$13,500 levels. Most cryptocurrencies ended in the red as they lost quite a bit more than Bitcoin itself. The largest cryptocurrency by market cap is currently trading for $13,411, representing a decrease of 1.88% on the day. Meanwhile, Ethereum lost 5.68% on the day, while XRP lost 3.96%.

 Daily Crypto Sector Heat Map

The Midas Touch Gold gained 8.44% in the past 24 hours, making it the cryptocurrency to gain the most in a day (out of the top100 cryptos by market capitalization). The rest of the cryptocurrencies experienced close to no gains. On the other hand, Reserve Rights lost 17.14%, making it the most prominent daily loser. It is followed by SushiSwap’s loss of 14.07% and Compound’s loss of 12.86%.

Top 10 24-hour Performers (Click to enlarge)

Bottom 10 24-hour Performers (Click to enlarge)

Bitcoin’s market dominance level has increased since we last reported, with its value is currently staying at 64%. This value represents a 0.9% difference to the upside when compared to the value it had yesterday.

Daily Crypto Market Cap Chart

The crypto sector capitalization has decreased over the course of the day. Its current value is $388.84 404.52 billion, representing a $5.32 million decrease when compared to our previous report.

_______________________________________________________________________

What happened in the past 24 hours?

_______________________________________________________________________

_______________________________________________________________________

Technical analysis

_______________________________________________________________________

Bitcoin

The largest cryptocurrency by market cap has (as said in our previous article) moved away from the sideways trading as it could not stand trading in such a narrow range. Bitcoin pulled back below $13,570 and even went as low as ~13,200 before bouncing back to ~$13,400 (where it is currently consolidating).

The recent days have brought us a lot of support/resistance hopping, which is what we may expect in the near future as well. Traders should focus on capitalizing on these movements as they almost always overextend. The trades can be made both while Bitcoin is creating overextension (riskier but a bigger profit potential) or during the pullback (safer but less profit potential).

BTC/USD 4-hour Chart

Bitcoin’s 4-hour technicals are showing a bear tilt, while its longer time-frames are tilted towards the buy-side (longer time-frames have less neutrality and more of a buy-tilt than the shorter ones).

BTC/USD 1-day Technicals

Technical factors (4-hour Chart):
  • Price is far at its 50-period EMA and below its 21-period EMA
  • Price below its middle Bollinger band
  • RSI is neutral (43.90)
  • Volume is average
Key levels to the upside          Key levels to the downside

1: $13,570                                 1: $13,180

2: $13,900                                 2: $13,000

3: $14,000                                  3: $12,870

Ethereum

Ethereum has plummeted after failing to break the $400 mark, and losing all the most recent gains in the process. The second-largest cryptocurrency by market cap has left the ascending channel since the end of September. Its price drop was stopped at the $371 resistance level, which has held up quite well.

Ethereum is now trading in a narrow range bound by $371 to the downside and $378 to the upside. Traders should look for any breakouts to enter trades, while the ones that want to trade the sideways action should wait and see if Ethereum is likely to stay within this range.

ETH/USD 4-hour Chart

Ethereum’s 4-hour and daily technicals are tilted towards the sell-side, while its weekly and monthly overviews remain bullish.

ETH/USD 1-day Technicals

Technical Factors (4-hour Chart):
  • The price is far below both its 50-period and its 21-period EMA
  • Price is at its bottom Bollinger band
  • RSI is close to being overbought (35.83)
  • Volume is slightly above average
Key levels to the upside          Key levels to the downside

1: $378                                     1: $371

2: $400                                     2: $361

3: $415                                      3: $358

Ripple

The fourth-largest cryptocurrency by market cap has had a red day as well, with its price falling through major support levels. A failed attempt to break the $0.2454 level has triggered a pullback, which pushed XRP’s price below $0.235 and even attempted to break $0.227. However, this support level held up, and XRP is now trading slightly above it.

If not fueled by Bitcoin’s explosive move towards either side, XRP will most likely trade sideways between $0.227 and $0.235. While traders could trade the sideways action without much problem, the lack of intra-range volatility is low, which brings the profit potential way down.

XRP/USD 4-hour Chart

XRP’s daily, weekly, and monthly technicals are all showing a strong tilt towards the sell-side, while its 4-hour overview is slightly bullish with hints of neutrality.

XRP/USD 1-day Technicals

Technical factors (4-hour Chart):
  • The price far below both its 50-period EMA and its 21-period EMA
  • Price is at its bottom Bollinger band
  • RSI is close to the oversold territory (31.89)
  • Volume is slightly above average
Key levels to the upside          Key levels to the downside

1: $0.235                                   1: $0.227

2: $0.2454                                 2: $0.221

3: $0.26                                    3: $0.217


Categories
Crypto Market Analysis

Daily Crypto Review, Nov 2 – Ethereum’s Price Explodes; Bitcoin’s Whitepaper Celebrates its 12th Birthday

The cryptocurrency sector was full of volatility over the weekend as Bitcoin tried to break the $14,000 mark. Bitcoin is currently trading for $13,735, representing a decrease of 0.13% on the day. Meanwhile, Ethereum gained 3.12% on the day, while XRP gained 1.31%.

 Daily Crypto Sector Heat Map

Taking a look at the top 100 cryptocurrencies, Ocean Protocol gained 20.20% in the past 24 hours, making it the crypto to gain the most in a day. Aave (10.97%) and Ox (8.84%) also did great. On the other hand, ABBC Coin lost 10.72%, making it the most prominent daily loser. It is followed by CyberVain’s loss of 7.62% and Ren’s loss of 3.92%.

Top 10 24-hour Performers (Click to enlarge)

Bottom 10 24-hour Performers (Click to enlarge)

Bitcoin’s market dominance level had stayed at the same place since we last reported, with its value is currently 63.1%. This value represents a 0% difference when compared to the value it had on Friday.

Daily Crypto Market Cap Chart

The crypto sector capitalization has increased slightly over the weekend. Its current value is $404.52 billion, representing a $4.91 million increase compared to our previous report.

_______________________________________________________________________

What happened in the past 24 hours?

_______________________________________________________________________

_______________________________________________________________________

Technical analysis

_______________________________________________________________________

Bitcoin

The largest cryptocurrency by market cap had quite a volatile weekend, with its price breaking the $13,900 mark at one point and even reaching as high as $14,100. However, this price didn’t hold up, and Bitcoin fell back below $13,900, where it is consolidating at the moment. Bitcoin is now trading within a tight range, bound by $13,570 to the downside and $13,900 to the upside. History has shown us that BTC doesn’t stay range-bound for long; thus, we may expect a large move soon.

Traders should look for a trade when Bitcoin breaks one of its immediate resistances.

BTC/USD 4-hour Chart

Bitcoin’s overview on all time-frames is slightly bullish, with hints of neutrality. The neutrality is more present on the shorter time-frames as opposed to less neutrality on longer time-frames.

BTC/USD 1-day Technicals

Technical factors (4-hour Chart):
  • Price is far above its 50-period EMA and above its 21-period EMA
  • Price slightly above its middle Bollinger band
  • RSI is neutral (53.43)
  • Volume is slightly above average
Key levels to the upside          Key levels to the downside

1: $13,900                                 1: $13,570

2: $14,000                                 2: $13,180

3: $14,660                                  3: $12,870

Ethereum

Ethereum had spent the weekend slowly following the ascending channel bottom line until Sunday when its price bounced off and pushed past $400. The second-largest cryptocurrency by market cap managed to reach as high as $405 before pulling back and consolidating. The fight for $400 will continue, and it will decide if Ethereum will push towards $415 and $420 in the near future or not.

Traders should look for Ethereum’s break (or the failure to break) the $400 level and trade off of that.

ETH/USD 4-hour Chart

Ethereum’s 4-hour technicals have changed to a strong buy after Ether’s price spike, while its daily, weekly, and monthly time-frames are all slightly bullish with hints of neutrality.

ETH/USD 1-day Technicals

Technical Factors (4-hour Chart):
  • The price is far above both its 50-period and its 21-period EMA
  • Price is at its top Bollinger band
  • RSI is close to being overbought (64.51)
  • Volume is slightly above average
Key levels to the upside          Key levels to the downside

1: $400                                     1: $378

2: $415                                     2: $371

3: $420                                      3: $361

Ripple

The fourth-largest cryptocurrency by market cap spent the weekend consolidating below the $0.2454 level, which it has dropped below just before the weekend started. XRP tested both the $0.235 downside and $0.2454 upside, and both have proven to be strong support/resistance levels, which has left XRP range-bound.

XRP will take a lot of buying power to break above $0.2454 again, which means that the traders should consider trading sideways inside the range XRP is currently in.

XRP/USD 4-hour Chart

XRP’s daily, weekly, and monthly technicals are all showing a strong tilt towards the sell-side, while its 4-hour overview is slightly bullish with hints of neutrality.

XRP/USD 1-day Technicals

Technical factors (4-hour Chart):
  • The price below its 50-period EMA and above its 21-period EMA
  • Price is slightly above its middle Bollinger band
  • RSI is neutral (50.10)
  • Volume is average
Key levels to the upside          Key levels to the downside

1: $0.26                                     1: $0.2454

2: $0.266                                   2: $0.235

3: $0.27                                    3: $0.227


Categories
Crypto Market Analysis

BTC/USD Chart Overview + Possible Outcomes

In this weekly BTC /USD analysis, we will be looking at the most recent events, the current technical formations, as well as discussing possible outcomes.

Overview

Bitcoin has spent another week pushing towards the upside. This time, it has passed the resistance zone at ~13,200 and pushed further towards the 2019 yearly high of $13,900. Breaking this level signifies a crucial move towards reaching all-time highs as the zone between $13,900 and the $20,000 level has close to no volume, meaning that it is “air-filled.” The moves in this zone will include a lot of volatility due to people taking profits as well as FOMO-ing in.

Technical factors


Bitcoin has conquered the ~13,200 zone after a week of trading above it and a couple of retests. However, a new high is in sight, the 2019 yearly high of $13,900.

Bitcoin is booming with bullish indicators, with its downside being guarded by the 21-period moving average, as well as hash ribbons making a crossover into miner capitulation (a huge bullish signal).
Hash Ribbons are great for detecting market bottoms or preparations for another spike, and it is one of the indicators that has provided traders with the most stable and predictable returns (and with low drawdowns).

However, the technicals factors will have no effect on the strength of the move once it happens, and Bitcoin’s short-term direction will remain unclear until it confidently breaks or pulls back from the $13,900 level.

Likely Outcomes

Bitcoin has two main scenarios it can play out, which will depend on how the “fight” for $13,900 ends.
1: If it confirms its position above the level, we can expect the unexpected, as there is close to no sell pressure above. However, many will start taking profits so unexpected downswings might happen. With that being said, the most likely target after breaking $13,900 is $13,640, which is one of the small consolidation points which happened during the 2017/2018 spike.
2: The other scenario is just as likely, and involves Bitcoin rejecting $13,900, thus creating a double top and a short-term pullback. This pullback might end at the $13,200 zone, which historically has a lot of buy and sell pressure, or even further down towards $12,470.

We also have to note that, whichever of these scenarios play out, Bitcoin’s overall sentiment is extremely bullish and that investors that do not like trading should just stick with what they are comfortable with.

Categories
Crypto Guides

Secure Trades using Safex- A Decentralised, Open-Source Crypto Marketplace

Introduction

If you are frequently updated with the blockchain trend, then you must have come across Safex. Unlike most blockchain technologies used for security and transactional purposes, Safex is focused on e-commerce. Even since Bitcoin emerged as a P2P electronic cash system (peer-to-peer), the idea of a decentralized system on which people could easily trade with each other without requiring a centralized governing body has been at the forefront of every technological leap in the blockchain industry.

Living up to crypto enthusiasts and professionals’ expectations of wanting a truly borderless and open P2P trading system that helps both sellers and buyers. Safex is a community and a decentralized protocol built and designed on the original concepts of the individual rights to control, security, and privacy over transactions.

Let’s understand why Safex is the real attraction for crypto investors all across the globe.

What is Safex?

Safex is a privacy-based, decentralized, and open-source e-commerce marketplace designed to help both sellers and buyers and make transactions hassle-free. It allows you to create powerful web stores that are powered by blockchain. Safex has been using the heavily modified blockchain technology called cryptonote that leads to a world-class marketplace. What’s interesting about Safex is that the platform boasts a unique type of commerce-focused smart contract function.

Since data breach is the major vulnerability suffered by most centralized commerce platforms, Safex primarily focuses on privacy, addressing issues like opaque and unfair system for visibility of listings and trades, snooping on online behavior, unwarranted collection of personal data, and arbitrarily large and non-transparent commissions.

Industry experts claim that Safex has revolutionized the e-commerce sector by streamlining the processes and providing the e-commerce ecosystem with sheer privacy, which was previously not there.

More than 10,000 individuals have already invested in Safex Token and Cash after recognizing the project’s potential.

Why Safex?

Credit card fraud, privacy issues, and unfairness to small to medium-scale sellers are a few of the many problems affecting everyday users. With Safex, users get a solution in the form of secure online payment, an embedded privacy coin for free, and a marketplace on a blockchain. Safex combines Shopify, Upwork, and Amazon’s functionalities into a single platform, creating a new future for online shopping that eliminates the difficulties and challenges that users have to deal with every day.

Safex Features and Functionalities

With Safex, small sellers from across the world will have access to a global client base.

Engine for E-Commerce – Safex offers a decentralized database and an integrated global payment engine, which adds security and a privacy layer to online stores.

Safex Marketplace – Safex is a decentralized marketplace on a privacy blockchain, allowing sellers to gain exposure to the wide network of Safex users.

Privacy Blockchain -Safex uses functionalities like One-Time Address and Ring Signatures to maintain the senders’ anonymity and recipients of transactions.

Conclusion

Safex has already developed a strong community of users who believe in the project. Since blockchain is the future of online payment, Safex can prove to be a game-changer in how people carry out online transactions.

Categories
Crypto Market Analysis

Daily Crypto Review, Oct 30 – Bitcoin Bounces Back Above $13,500; XRP Breaks Crucial Support Level

The cryptocurrency sector was full of volatility today but ended the day with close to no gains. Bitcoin is currently trading for $13,561, representing an increase of 2.50% on the day. Meanwhile, Ethereum gained 0.01% on the day, while XRP lost 1.12%.

 Daily Crypto Sector Heat Map

None of the top100 cryptocurrencies gained much over the course of the day. NEM gained 3.57% in the past 24 hours, making it the crypto to gain the most in a day. Celsius (2.68%) and FTX Token (2.63%) also did great. On the other hand, yearn.finance lost 16.68%, making it the most prominent daily loser. It is followed by Ocean Protocol’s loss of 16.06% and Reserve Rights’ loss of 15.74%.

Top 10 24-hour Performers (Click to enlarge)

Bottom 10 24-hour Performers (Click to enlarge)

Bitcoin’s market dominance level had increased since we last reported, with its value is currently 63.1%. This value represents a 0.8% difference to the upside when compared to when we last reported.

Daily Crypto Market Cap Chart

The crypto sector capitalization has increased slightly in the past 24 hours. Its current value is $399.63 billion, representing a $6.58billion increase compared to our previous report.

_______________________________________________________________________

What happened in the past 24 hours?

_______________________________________________________________________

_______________________________________________________________________

Technical analysis

_______________________________________________________________________

Bitcoin

The largest cryptocurrency by market capitalization had quite a volatile day, with its price bouncing back from the $13,180 resistance and pushing up. While the price has reached ~$13,700 level, it has pulled back since, currently contesting the $13,570 resistance.

Traders should look at Bitcoin contesting the $13,570 level and trade in whichever direction the price confirms its move in.

BTC/USD 4-hour Chart

Bitcoin’s 4-hour and weekly overviews are neutral bullish, while its daily and monthly overviews are tilted towards the buy-side with close to no neutrality.

BTC/USD 1-day Technicals

Technical factors (4-hour Chart):
  • Price is far above its 50-period EMA and above its 21-period EMA
  • Price slightly above its middle Bollinger band
  • RSI is ascending towards overbought (59.94)
  • Volume is slightly above average
Key levels to the upside          Key levels to the downside

1: $13,570                                 1: $13,180

2: $13,900                                 2: $12,870

3: $14,000                                  3: $12,500

Ethereum

Ethereum had, just like Bitcoin, quite a volatile day today. Its price first bounced off of the ascending channel bottom line, which prompted a push towards $395 before falling yet again. As things stand now, the leg down is still not over yet, and Ethereum is yet to decide whether it will change its course towards the upside or break the channel down.

Traders should look for Ethereum’s response to the bottom channel line and trade in continuation to where it chooses to go.

ETH/USD 4-hour Chart

Ethereum’s technicals on all time-frames except for the 4-hour one are tilted towards the buy-side, with hints of neutrality. On the other hand, its 4-hour time-frame is tilted towards the sell-side with slight hints of neutrality.

ETH/USD 1-day Technicals

Technical Factors (4-hour Chart):
  • The price is below its 50-period and its 21-period EMA
  • Price is between its middle and bottom Bollinger band
  • RSI is neutral (40.64)
  • Volume is slightly above average
Key levels to the upside          Key levels to the downside

1: $400                                     1: $378

2: $415                                     2: $371

3: $420                                      3: $361

Ripple

The fourth-largest cryptocurrency by market cap had a bad day, as its price dropped below the crucial $0.2454 support level. XRP tried to recover and went above it at one point but failed to keep the price above the level, therefore triggering another push towards $0.24, where it is currently consolidating.

It is hard to say how traders should look at XRP, though the outlook is certainly bearish. Any push towards the upside will almost certainly result from Bitcoin making a large move towards the upside.

XRP/USD 4-hour Chart

XRP’s technicals are uniformed in its bearishness, with the 1-day and monthly overviews showing a bit more neutrality than the others.

XRP/USD 1-day Technicals

Technical factors (4-hour Chart):
  • The price well below both its 50-period EMA and its 21-period EMA
  • Price is slightly above its bottom Bollinger band
  • RSI is near oversold (35.97)
  • Volume is average
Key levels to the upside          Key levels to the downside

1: $0.2454                                 1: $0.235

2: $0.26                                     2: $0.227

3: $0.266                                  3: $0.221


Categories
Crypto Market Analysis

Daily Crypto Review, Oct 29 – Bitcoin Back At $13,000: What’s Next? Trading Ideas and Market Overview

The cryptocurrency sector quite a bad day, as Bitcoin led the rest of the sector down by dropping from $13,900 all the way to below $13,000. Bitcoin is currently trading for $13,240, representing a decrease of 3.70% on the day. Meanwhile, Ethereum lost 3.60% on the day, while XRP lost 2.93%.

 Daily Crypto Sector Heat Map

If we check out the top 100 cryptocurrencies, Ocean Protocol gained 11.69% in the past 24 hours, making it the crypto to gain the most in a day. Nexo (7.86%) and DigiByte (4.49%) also did great. On the other hand, ABBC Coin lost 12.3%, making it the most prominent daily loser. It is followed by Band Protocol’s loss of 11.46% and Quant’s loss of 11.36%.

Top 10 24-hour Performers (Click to enlarge)

Bottom 10 24-hour Performers (Click to enlarge)

Bitcoin’s market dominance level had decreased slightly since we last reported, with its value is currently 62.3%. This value represents a 0.1% difference to the downside when compared to when we last reported.

Daily Crypto Market Cap Chart

The crypto sector capitalization has decreased significantly in the past 24 hours. Its current value is $393.05 billion, representing a $15.07 billion decrease compared to our previous report.

_______________________________________________________________________

What happened in the past 24 hours?

_______________________________________________________________________

_______________________________________________________________________

Technical analysis

_______________________________________________________________________

Bitcoin

The largest cryptocurrency by market capitalization pulled back as its price couldn’t pass the crucial resistance of $13,900. The move was strong and lasted three candles (around 12 hours), over which Bitcoin fell as low as $12,895, where it bounced off of its 50-period moving average. Bitcoin is now consolidating above the $13,180 level.

Traders should look at how Bitcoin trades within the range bound by $13,180 and $13,570 and trade off of that.

BTC/USD 4-hour Chart

Bitcoin’s 4-hour, daily, and monthly technicals are looking almost identical, with all of them being tilted towards the buy-side, with a bit of neutrality sprinkled in. On the other hand, its weekly overview is a bit more bearish, with oscillators leaning towards the sell-side.

BTC/USD 1-day Technicals

Technical factors (4-hour Chart):
  • Price is above its 50-period EMA and at its 21-period EMA
  • Price is at its middle Bollinger band
  • RSI is neutral (52.27)
  • Volume is descending
Key levels to the upside          Key levels to the downside

1: $13,570                                 1: $13,180

2: $13,900                                 2: $12,870

3: $14,000                                  3: $12,500

Ethereum

Ethereum has followed Bitcoin to the downside, ultimately following its own predicted path within an ascending channel and reaching the bottom of $380 (as predicted in our previous articles) before bouncing back. It is currently trading slightly below $400, with a good chance of retesting this level once again.

Traders should watch for how Ethereum looks to retest the $400 resistance level and trade the pullback or the spike after that.

ETH/USD 4-hour Chart

Ethereum’s daily and monthly technicals are tilted towards the buy-side (with slight neutrality next to them). However, its shorter time-frame (the 4-hour overview) looks completely bearishness, while its weekly overview is completely neutral.

ETH/USD 1-day Technicals

Technical Factors (4-hour Chart):
  • The price is below its 50-period and its 21-period EMA
  • Price is slightly below its middle Bollinger band
  • RSI is neutral (42.03)
  • Volume is slightly above average
Key levels to the upside          Key levels to the downside

1: $400                                     1: $378

2: $415                                     2: $371

3: $420                                      3: $361

Ripple

The fourth-largest cryptocurrency by market cap managed to push above the ascending dotted yellow line (as predicted in our previous articles) but quickly failed as Bitcoin was dragging the market down. XRP followed and fell to its $0.2454 support level, which is holding for now. However, XRP is still quite close to the support level, which might break at any moment.

Traders should look for an entry if XRP breaks $0.2454 to the downside. When looking at trades to the upside, traders can look at Bitcoin’s upside pushes and trade off of that.

XRP/USD 4-hour Chart

XRP’s technicals are almost uniformed in how bearish they are, with its 4-hour, daily, and monthly overviews showing a slight tilt towards the sell-side. Its weekly overview, however, is completely neutral.

XRP/USD 1-day Technicals

Technical factors (4-hour Chart):
  • The price far below both its 50-period EMA and its 21-period EMA
  • Price is slightly above its bottom Bollinger band
  • RSI is neutral (38.72)
  • Volume is average
Key levels to the upside          Key levels to the downside

1: $0.26                                     1: $0.2454

2: $0.266                                   2: $0.235

3: $0.2855                                3: $0.227


Categories
Crypto Market Analysis

Daily Crypto Review, Oct 28 – Bitcoin Rushing Towards $14,000; Over 50% of US Investors Interested in Crypto

The cryptocurrency sector had a great day, with most cryptocurrencies ending up in the green due to Bitcoin pushing towards $13,900. Bitcoin is currently trading for $13.720, representing an increase of 4.81% on the day. Meanwhile, Ethereum gained 3.63% on the day, while XRP gained 1.61%.

 Daily Crypto Sector Heat Map

If we check out the top 100 cryptocurrencies, Flexacoin had another amazing day, gaining an astonishing 332.35% in the past 24 hours, making it the crypto to gain the most in a day. Nexo (13.94%) and Compound (13.71%) also did great. On the other hand, ABBC Coin lost 13.58%, making it the most prominent daily loser. It is followed by Reserve CyberVein’s loss of 10.32% and Quant’s loss of 7.90%.

Top 10 24-hour Performers (Click to enlarge)

Bottom 10 24-hour Performers (Click to enlarge)

Bitcoin’s market dominance level had increased quite a bit since we last reported, with its value is currently 62.4%. This value represents a 0.8% difference to the upside when compared to when we last reported.

Daily Crypto Market Cap Chart

The crypto sector capitalization has increased significantly since we last reported. Its current value is $408.12 billion, representing an increase of $13.35 billion compared to our previous report.

_______________________________________________________________________

What happened in the past 24 hours?

_______________________________________________________________________

_______________________________________________________________________

Technical analysis

_______________________________________________________________________

Bitcoin

The largest cryptocurrency by market capitalization surprised the market once again by pushing even further up. Our weekly chart overview has listed a push towards $13,900 as one of the likely scenarios for this week, which is exactly what happened. Bitcoin has pushed past the descending (yellow dotted) line and above the $13,180 resistance level, all the way to $13,800.

Traders should look at how Bitcoin behaves around $13,900 and follow the next push (either a pullback below $13,570 or a break past $13,900).

BTC/USD 4-hour Chart

Bitcoin’s technicals have changed to extremely bullish on all time frames since yesterday, with only the 4-hour chart oscillators showing some signs of a tilt towards the sell-side.

BTC/USD 1-day Technicals

Technical factors (4-hour Chart):
  • Price is far above both its 50-period EMA and its 21-period EMA
  • Price is at its top Bollinger band
  • RSI is overbought (74.76)
  • Volume is above average
Key levels to the upside          Key levels to the downside

1: $13,570                                 1: $13,200

2: $13,900                                 2: $12,870

3: $14,000                                  3: $12,500

Ethereum

Ethereum has spent the day bouncing off of the support level dating back from early September. While Ether had a slightly bigger chance of continuing its path down the projected path towards the bottom of the channel, Bitcoin’s rise sparked up Ether’s bounce. Its price is now hovering slightly above $400, with a solid chance of testing $415 again.

Traders should watch for how Ethereum plays out in the next few days to evaluate if it pushes towards $415-$420 or goes below $400.

ETH/USD 4-hour Chart

Ethereum’s technicals are tilted towards the buy-side on all time-frames, but only the daily time-frame is completely bullish. On the other hand, the 4-hour, weekly, and monthly overviews have signs of neutrality, mostly when it comes to oscillators.

ETH/USD 1-day Technicals

Technical Factors (4-hour Chart):
  • The price is above its 50-period and slightly above its 21-period EMA
  • Price is at its middle Bollinger band
  • RSI is neutral (55.78)
  • Volume is average
Key levels to the upside          Key levels to the downside

1: $415                                     1: $400

2: $420                                     2: $378

3: $435                                      3: $371

Ripple

The fourth-largest cryptocurrency by market cap has stayed at the same place over the course of the past 24 hours, possibly preparing itself for a move towards the yellow ascending line. Even if it keeps following it, XRP will gain a significant boost in price and an opportunity to test $0.26 once again.

Traders should look for a trade when XRP reaches $0.26, as they can enter a trade on either the pullback or the push above.

XRP/USD 4-hour Chart

XRP’s technicals are slightly tilted towards the buy-side, but the 1-day, as well as 4-hour and weekly technicals, show slight neutrality. On the other hand, its monthly overview is still bearish.

XRP/USD 1-day Technicals

Technical factors (4-hour Chart):
  • The price at both its 50-period EMA and its 21-period EMA
  • Price is at its middle Bollinger band
  • RSI is neutral (50.04)
  • Volume is average
Key levels to the upside          Key levels to the downside

1: $0.26                                     1: $0.2454

2: $0.266                                   2: $0.235

3: $0.2855                                3: $0.227


Categories
Crypto Guides

How DeFi Is Solving The Problem That Bitcoin Always Wanted To?

Introduction 

When you hear the word ‘cryptocurrency,’ Bitcoin is the first thing that pops into your mind. For the longest time, bitcoin has been synonymous with cryptocurrency and regarded as the future currency. In the recent past, bitcoin’s monopoly has been diluted by the entrance of thousands of other cryptocurrencies.

The cryptocurrencies’ primary objective was to serve as an alternative, and down the line, a replacement to the global fiat financial system. This objective has failed to take off. This failure can be attributed to the skepticism cryptocurrencies have faced, which has slowed their role as a legitimate alternative to fiat currencies. DeFi has helped address some of these challenges and help make cryptocurrencies mainstream.

What is DeFi?

DeFi is the short form for Decentralised Finance.  At its core, decentralized finance is the provision of conventional financial services on platforms built on the public blockchain. Specifically, DeFi is based on the Ethereum blockchain platform.

DeFi is heralded as the most suitable alternative to the global financial system. This new enthusiasm about the decentralization of finance is owed to the fact that DeFi is seen as being able to solve the problems that bitcoin failed to solve.

Advancements Made by DeFi

Here are some of the advancements made DeFi, which bitcoin failed to achieve.

Creation of issuance and investing platform

These platforms operate like an ordinary stock exchange. DeFi has made it possible so that cryptocurrencies can be issued and traded like conventional financial securities. The platform brings together broker-dealers, legal advisors, and custodians, who will advise issuers through the process. Furthermore, the platform also makes it possible for asset and investment managers’ proliferation for crypto-based financial assets.

Establishment of a decentralized prediction market

A prediction market is one where individuals can bet on any future occurrences. With decentralized prediction markets, there is no form of censorship whatsoever. Therefore, it offers an incredible opportunity to hedge against future risks financially and speculate on all forms of social events globally.

Growth of open lending protocols

Decentralized open lending championed by DeFi involves the following: collateralization of cryptocurrencies; elimination of credit checks among borrowers; lending and borrowing of cryptocurrencies for trading purposes; and real-time settlement of transactions. The financial inclusion resulting from open lending is unparalleled.

Facilitated the issuance of stablecoins

DeFi made it possible for the issuance of stablecoins by facilitating the auditing of crypto reserves and ensuring manageable volatility of such cryptocurrencies. With DeFi, stablecoins can be pegged on another asset. Categories of stable coins that have been spurred by DeFi include crypto-collateralized stablecoins, fiat-collateralized stable coins, and non-collateralized stablecoins whose stability depends on an algorithm controlling the expansion and contraction of its supply.

Bottom Line

DeFi undoubtedly offers a higher potential for financial inclusion, censorship-free transactions, and improved privacy. Although DeFi is offered as an alternative to the centralized financial system, it is almost impossible to envision an economy where the centralized financial system ceases to exist. Thus, it is prudent to co-mingle the two systems to ensure complementarity, which will tone down the inherent risks associated with either system.

Categories
Crypto Market Analysis

Daily Crypto Review, Oct 27 – Bitcoin Preparing For a Retracement; XRP Tumbles on the Daily

The cryptocurrency sector spent the day with cryptocurrencies trying to find consolidation points as preparation for Bitcoin’s next move. Bitcoin is currently trading for $13.049, representing an increase of 0.61% on the day. Meanwhile, Ethereum lost 2.74% on the day, while XRP lost 1.73%.

 Daily Crypto Sector Heat Map

If we check out the top 100 cryptocurrencies, Flexacoin gained an astonishing 144.03% in the past 24 hours, making it the crypto to gain the most in a day. Kusama (28.07%) and Ocean Protocol (20.44%) also did great. On the other hand, Quant lost 13.61%, making it the most prominent daily loser. It is followed by Reserve Rights’ loss of 10.28% and Cybervein’s loss of 8.60%.

Top 10 24-hour Performers (Click to enlarge)

Bottom 10 24-hour Performers (Click to enlarge)

Bitcoin’s market dominance level had increased slightly since we last reported, with its value is currently 61.6%. This value represents a 0.5% difference to the upside when compared to when we last reported.

Daily Crypto Market Cap Chart

The crypto sector capitalization has stayed at the same place since we last reported. Its current value is $394.54 billion, representing an increase of $1.86 billion compared to our previous report.

_______________________________________________________________________

What happened in the past 24 hours?

_______________________________________________________________________

_______________________________________________________________________

Technical analysis

_______________________________________________________________________

Bitcoin


The largest cryptocurrency by market capitalization has spent the past 24 hours slowly gaining value and reaching the $13,180 mark. However, it managed to make (at the moment) the third lower high in a row, creating a short-term bearish indicator. The decaying volume, as well as an increase in sell pressure around the $13,200 level, supports the claim that Bitcoin is more likely to retrace first before moving up.

Traders should pay attention to how BTC approaches $13,180 and if it (more likely) enters a price correction phase, or if it rather (less likely) pushes past $13,180 and towards #13,900.

BTC/USD 4-hour Chart

Bitcoin’s technicals are a bit more bearish than the day before, despite its price being a bit higher. Its 4-hour, daily and weekly overviews all have sell-tilted oscillators and buy-tilted moving averages, while the overall summary is slightly bullish. The monthly overview is still fully bullish.

BTC/USD 1-day Technicals

Technical factors (4-hour Chart):
  • Price is above both its 50-period EMA and its 21-period EMA
  • Price is slightly above its middle Bollinger band
  • RSI is slightly below being overbought (61.54)
  • Volume is descending
Key levels to the upside          Key levels to the downside

1: $13,200                                 1: $12,870

2: $13,900                                 2: $12,500

3: $14,000                                  3: $12,300

Ethereum

Ethereum has spent the day following its ascended trading channel but to the downside. The second-largest cryptocurrency by market cap bounced off of the $420 highs as it couldn’t pass either of the $415 and $420 resistance levels and pushed towards the downside. The move will most likely end somewhere between $400 and $378. However, if Bitcoin pushes towards the upside, Ethereum will most likely abandon its current pattern and trade alongside it.

Traders should watch for how Ethereum retraces and what it does after, as many safe trading patterns may emerge from that.

ETH/USD 4-hour Chart

Ethereum’s technicals are quite confusing, as its 4-hour overview is completely bearish, while its daily overview is completely bullish. Its weekly and monthly overviews are tilted towards the buy-side, but the weekly one is slightly more neutral.

ETH/USD 1-day Technicals

Technical Factors (4-hour Chart):
  • The price is below both its 50-period and its 21-period EMA
  • Price is at its lower Bollinger band
  • RSI is nearly oversold (38.94)
  • Volume is average
Key levels to the upside          Key levels to the downside

1: $415                                     1: $400

2: $420                                     2: $378

3: $435                                      3: $371

Ripple

The fourth-largest cryptocurrency by market cap trying to decide its direction. Its price started to fall down after it failed to break $0.26, but it was expected for the ascending trend line (yellow dotted line) to hold at least for a bit more. However, XRP quickly broke that level to the downside, opening itself towards more possibility of moving down.

On the other hand, some people call the most recent moves a bull flag and are entering long positions. While this is unlikely, all traders must be aware of and respect this stance as well before entering their own trades.

XRP/USD 4-hour Chart

XRP’s technicals split into two sides, with the 4-hour and monthly overviews being tilted towards the sell-side and daily and weekly overviews being tilted towards the bull-side (with a bit of neutrality).

XRP/USD 1-day Technicals

Technical factors (4-hour Chart):
  • The price slightly below both its 50-period EMA and its 21-period EMA
  • Price is between its lower and middle Bollinger band
  • RSI is ascending (42.18)
  • Volume is average
Key levels to the upside          Key levels to the downside

1: $0.26                                     1: $0.2454

2: $0.266                                   2: $0.235

3: $0.2855                                3: $0.227


Categories
Crypto Market Analysis

Daily Crypto Review, Oct 26 – JP Morgan Calls Bitcoin “Currency With A Large Upside Potential”; Crypto Preparing For A Big Move

The cryptocurrency sector spent the weekend hovering around the same spot as Bitcoin was testing its ~$13,000 level. Bitcoin is currently trading for $13.049, representing a decrease of 0.80% on the day. Meanwhile, Ethereum lost 1.52% on the day, while XRP gained 0.18%.

 Daily Crypto Sector Heat Map

If we check out the top 100 cryptocurrencies, Flexacoin gained an astonishing 171.94% in the past 24 hours, making it the crypto to gain the most in a day. Filecoin (56.89%) and Reserve Rights (13.22%) also did great. On the other hand, Energy Web Token lost 7.94%, making it the most prominent daily loser. It is followed by Cosmos’ loss of 5.78% and ABBC Coin’s loss of 5.71%.

Top 10 24-hour Performers (Click to enlarge)

Bottom 10 24-hour Performers (Click to enlarge)

Bitcoin’s market dominance level had increased slightly since when we last reported, with its value is currently 61.1%. This value represents a 0.3% difference to the upside when compared to when we last reported.

Daily Crypto Market Cap Chart

The crypto sector capitalization has stayed at the same place since we last reported. Its current value is $396.38 billion, representing an increase of $1.83 billion compared to our previous report.

_______________________________________________________________________

What happened in the past 24 hours?

_______________________________________________________________________

_______________________________________________________________________

Technical analysis

_______________________________________________________________________

Bitcoin

The largest cryptocurrency by market capitalization has spent the weekend hovering around the $13,000 mark, and even attempted to break through the $13,200 resistance level (but failed to). With the volume is descending ever since Oct 21, most analysts are expecting a big move very soon. However, they are torn when it comes to the direction.

Traders should pay attention to how BTC handles its push towards the resistance level, as there might be good trading opportunities after (more likely) the level holds and a pullback occurs, or after BTC breaks the level and pushes higher (less likely).

BTC/USD 4-hour Chart

Bitcoin’s sentiment is highly bullish, with its shorter time-frames showing a bigger tilt towards neutrality, while its longer time-frames are more titled to the buy-side.

BTC/USD 1-day Technicals

Technical factors (4-hour Chart):
  • Price is far above its 50-period EMA and slightly above its 21-period EMA
  • Price is at its middle Bollinger band
  • RSI is slightly below being overbought (62.22)
  • Volume is descending
Key levels to the upside          Key levels to the downside

1: $12,870                                 1: $12,500

2: $13,200                                 2: $12,300

3: $14,000                                  3: $12,000

Ethereum

Ethereum has continued its descent from the highs it made on Oct 22, with its price moving slowly towards the downside. The smaller time-frame charts are showing that ETH kept creating new lower highs, with one (failed) attempt to break out of the trend. The next couple of hours will be crucial, as Ethereum is about to hit the trend line, break it or continue pushing down towards $400.

Traders should watch for how Ethereum reacts to the descending trend line and trade off of it.

ETH/USD 2-hour Chart

Ethereum’s technicals are tilted towards the buy-side on all time-frames, with its lower time frames being slightly more neutral.

ETH/USD 1-day Technicals

Technical Factors (4-hour Chart):
  • The price is above its 50-period and slightly above its 21-period EMA
  • Price is at its Bollinger band
  • RSI is overbought (52.24)
  • Volume is average
Key levels to the upside          Key levels to the downside

1: $415                                     1: $400

2: $420                                     2: $378

3: $435                                      3: $371

Ripple

The fourth-largest cryptocurrency by market cap spent the weekend testing its ascending support level (the dotted yellow line), which dates back from Oct 16. XRP has slowly descended from its most recent highs and reached the support line at the ~$0.252 level. The line provided good support, and XRP shot up as a result of it. However, it could not break the $0.26 resistance level, which may prove a problem in the long run.

XRP is unlikely to pass $0.26 unless it is fueled by Bitcoin’s push towards the upside. The more likely scenario would be that XRP hovers between the support line and the $0.26 level for some time.

XRP/USD 4-hour Chart

XRP’s technicals are bullish with hints of neutral sentiment on the 4-hour, 1-day, and 1-week time-frames, while its monthly time-frame shows strong bearish sentiment.

XRP/USD 1-day Technicals

Technical factors (4-hour Chart):
  • The price above both its 50-period EMA and its 21-period EMA
  • Price is near its top Bollinger band
  • RSI is ascending (58.25)
  • Volume is elevated
Key levels to the upside          Key levels to the downside

1: $0.26                                     1: $0.2454

2: $0.266                                   2: $0.235

3: $0.2855                                3: $0.227


Categories
Crypto Market Analysis

BTC/USD Chart Overview + Possible Outcomes

In this weekly BTC /USD analysis, where we are looking at the most recent events, the current technical formations, as well as discussing possible outcomes.

Overview

Bitcoin has had another week of explosive gains, mostly due to its fundamentals. This week’s spike can’t go without mentioning PayPal’s announcement that it will enable its users to buy, sell and hold crypto, as well as that it will not be just a gimmick but rather a crucial factor in PayPal’s future business development (PayPal will offer crypto payments to its 26 million merchants, as well as enable the usage of crypto on its payment processing app Venmo). This news, alongside other news of large corporations investing tens of millions in Bitcoin and crypto, sparked the push past $12,000 and up to $13,235.

Technical factors


Bitcoin has abruptly left its triangle formation last week, pushing a little above $11,700 before consolidating and pulling back. After being pressed between $11,300 and $11,500 for some time, the PayPal news broke out, and Bitcoin surged, reaching as far as $13,235 before the move stopped.
Bitcoin is now in a consolidation phase, creating a triangle formation on the smaller time-frames. The formation is accompanied by descending volume, indicating that the move that will follow will be quite strong. Its RSI is overbought on all time-frames above 4 hours, while its moving averages are at play only at the 1-hour chart, where the current price is supported by the 21-period moving average.
Sentiment built around Bitcoin is certainly bullish at the moment, and any serious downturns are very unlikely. However, a slight pullback before the next push is likely.
Another thing to add is that Bitcoin is one step away from moving into the “fresh air” territory (after the 2019 high of $13,900) where there is no technical or historical volume ahead, meaning that this territory will be full of new people entering the market to chase profits as well as smart money taking profits.

Likely Outcomes

Bitcoin currently has two main scenarios it can play out. Both of these scenarios are bullish, where one breaks out above the current 1h time-frame triangle formation to the upside and past the $13,200 area, while the other one involves a pullback before the spike.
1: As shown in the chart, Bitcoin will most likely have to retrace slightly and reset its RSI level. While the bull sentiment is prevailing, the largest cryptocurrency by market cap should establish and confirm its support at the ~$12,500 level (which it breezed through) before going further up.
2: The other scenario is slightly less likely, and involves a simple breakout scenario of the current triangle formation to the upside and a push towards (ultimately) $13,900. This level will certainly be contested as it is the last frontier before the all-time high territory. On top of that, many investors will most likely take profit at this level.

The scenario in which Bitcoin suddenly down sharply and swiftly is incredibly unlikely. While a strong move in this direction is possible only if it’s backed by some bearish news/events, the bull phase Bitcoin is in at the moment is highly resistant to bad news.

Categories
Crypto Market Analysis

Daily Crypto Review, Oct 23 – PayPal Enabling Crypto Not as Good as it Sounds; Ethereum Pushes Towards $420

The cryptocurrency sector was mostly consolidating after Bitcoin’s surge, with almost every single cryptocurrency in the top100 ending up in the green. Bitcoin is currently trading for $12,961, representing an increase of 1.21% on the day. Meanwhile, Ethereum gained 5.64% on the day, while XRP gained 2.34%.

 Daily Crypto Sector Heat Map

If we check out the top 100 cryptocurrencies, Ampleforth gained 19.04% in the past 24 hours, making it the crypto to gain the most in a day. Energy Web Token (17.44%) and Reserve Rights (12.20%) also did great. On the other hand, Filecoin lost 13.57%, making it the most prominent daily loser. It is followed by HedgeTrade’s loss of 8.57% and ABBC Coin’s loss of 8.49%.

Top 10 24-hour Performers (Click to enlarge)

Bottom 10 24-hour Performers (Click to enlarge)

Bitcoin’s market dominance level had decreased slightly since when we last reported, with its value is currently 60.8%. This value represents a 0.4% difference to the downside when compared to when we last reported.

Daily Crypto Market Cap Chart

The crypto sector capitalization has experienced an increase since we last reported. Its current value is $394.96 billion, representing an increase of $4.72 billion compared to our previous report.

_______________________________________________________________________

What happened in the past 24 hours?

_______________________________________________________________________

While most of the market rejoices Bitcoin’s surge, confirmation of a bull market, and PayPal enabling its users to buy, sell and hold crypto, not everyone is equally happy. Some analysts have pointed out that PayPal will almost certainly bring adoption, but perhaps at a steep price. If the payment processor giant doesn’t get involved in the community and refuses to give private keys to its users, the benefits may not outweigh the setbacks.

With that being said, additional adoption and introduction of Bitcoin to the wider masses is certainly a positive thing.

_______________________________________________________________________

Technical analysis

_______________________________________________________________________

Bitcoin

The largest cryptocurrency by market capitalization stayed strong after yesterday’s push and even gained some more value. The price pushed past $13,000 once again but couldn’t hold the level, which prompted a pullback towards the sub-$13,000 level. However, the $12,870 level has turned to a support level (though it still needs proper confirmation), which is certainly positive.

At the moment, traders should look Bitcoin’s pullback and trade-off of that. However, if Bitcoin manages to push past $13,000 with confidence, traders shouldn’t wait much but rather join in quickly.

BTC/USD 4-hour Chart

Bitcoin’s technical overview has a strong bullish sentiment on longer time-frames (weekly and monthly), while its short-term sentiment is slightly more neutral.

BTC/USD 1-day Technicals

Technical factors (4-hour Chart):
  • Price is far above its 50-period EMA and at its 21-period EMA
  • Price between its middle and top Bollinger band
  • RSI is overbought but descending(73.99)
  • Volume is extremely elevated
Key levels to the upside          Key levels to the downside

1: $12,870                                 1: $12,500

2: $13,200                                 2: $12,300

3: $14,000                                  3: $12,000

Ethereum

Ethereum’s push from yesterday was just a weaker iteration of Bitcoin’s push. However, the second-largest cryptocurrency by market cap has pushed further towards the upside on its own today, testing the $415 and $420 levels. While tests towards both levels failed, Ethereum is still very near $415 and may have the opportunity to strike again, or just consolidate near this level.

Traders should pay attention to Ethereum’s pullback towards $400 or push past $415 and trade off of that.

ETH/USD 4-hour Chart

Ethereum’s technicals are slightly confusing, as its 4-hour overview is completely bullish, while its daily overview is neutral-bullish. However, its long term technicals all tilt towards the buy-side.

ETH/USD 1-day Technicals

Technical Factors (4-hour Chart):
  • The price is far above its 50-period and its 21-period EMA
  • Price is near the top Bollinger band
  • RSI is overbought (75.95)
  • Volume is elevated
Key levels to the upside          Key levels to the downside

1: $415                                     1: $400

2: $420                                     2: $378

3: $435                                      3: $371

Ripple

The fourth-largest cryptocurrency by market cap had a day filled with volatility, ups, and downs. XRP started the day off strong with a push past $0.26 and towards $0.266. However, bulls have reached exhaustion quickly, and bears stepped in, pulling the price back down to $0.257, where XRP is now consolidating.

XRP has a high-resistance zone above $0.26, which we have seen today as well. For this reason, it is much more plausible that XRP will push towards the downside and retest the $0.25 or $0.2454 levels.

XRP/USD 4-hour Chart

XRP’s technicals are extremely bullish on the 4-hour and 1-day chart, while they are tilting towards the sell-side the longer time-frame we choose.

XRP/USD 1-day Technicals

Technical factors (4-hour Chart):
  • The price far above its 50-period EMA and above its 21-period EMA
  • Price is between its middle and top Bollinger band
  • RSI has left the overbought territory (61.12)
  • Volume is elevated
Key levels to the upside          Key levels to the downside

1: $0.26                                     1: $0.2454

2: $0.266                                   2: $0.235

3: $0.2855                                3: $0.227


Categories
Crypto Market Analysis

Daily Crypto Review, Oct 22 – PayPal to Enable its Users to Buy and Sell Crypto; Bitcoin Skyrockets to $13,000 as a Response

The cryptocurrency sector has rallied up and skyrocketed as PayPal announced that it will now support cryptocurrencies. Bitcoin has led the rally with an almost double-digit increase. It is currently trading for $12,886, representing an increase of 7.25% on the day. Meanwhile, Ethereum gained 6.69% on the day, while XRP gained 4.78%.

 Daily Crypto Sector Heat Map

If we check out the top 100 cryptocurrencies, we can see that Reserve Rights gained 45.36% in the past 24 hours, making it the top daily gainer. Litecoin (16.03%) and Ampleforth (14.02%) also did great. On the other hand, ABBC Coin lost 18.97%, making it the most prominent daily loser. It is followed by Filecoin’s loss of 14.56% and The Midas Touch Gold’s loss of 7.03%.

Top 10 24-hour Performers (Click to enlarge)

Bottom 10 24-hour Performers (Click to enlarge)

Bitcoin’s market dominance level had increased slightly since when we last reported, with its value is currently 61.2%. This value represents a 0.7% difference to the upside when compared to when we last reported.

Daily Crypto Market Cap Chart

The crypto sector capitalization has experienced a huge increase since we last reported. Its current value is $390.24 billion, representing an increase of $23.98 billion compared to our previous report.

_______________________________________________________________________

What happened in the past 24 hours?

_______________________________________________________________________

_______________________________________________________________________

Technical analysis

_______________________________________________________________________

Bitcoin

The largest cryptocurrency by market capitalization has had quite an amazing day filled with volatility and extremely high bull presence. Fueled by PayPal’s announcement that it will enable its users to buy,  sell and hold crypto,  Bitcoin skyrocketed and reached as high as $13,235 before pulling back. It’s currently trying to consolidate just under the $12,870 resistance level.

Any skepticism regarding whether the bull market has started has been shattered with Bitcoin’s most recent move. However, while this move was intense, Bitcoin will need a lot of great news, adoption, and ultimately time to reach its all-time highs.

At the moment, traders should look at how Bitcoin handles the pullback and trade-off of that.


BTC/USD 1-day Chart

Bitcoin’s technical overview is very strongly tilted towards the buy-side on longer time-frames (weekly and monthly), while its short-term overviews are slightly more neutral.

BTC/USD 1-day Technicals

Technical factors (4-hour Chart):
  • Price is far above its 50-period EMA and at its 21-period EMA
  • Price above its top Bollinger band
  • RSI is extremely overbought (81.74)
  • Volume is extremely elevated
Key levels to the upside          Key levels to the downside

1: $12,870                                 1: $12,500

2: $13,200                                 2: $12,300

3: $14,000                                  3: $12,000

Ethereum

Ethereum has followed Bitcoin’s lead and pushed towards the upside, though with much less strength. Its price ultimately reached the $400 resistance before pulling back slightly. It is currently trying to consolidate right under the $400 level, which is still a great increase in price since yesterday when Ether was fighting to stay above $378.

Ethereum traders should pay attention to how the second-largest cryptocurrency by market cap handles its immediate resistance level, as well as an eventual further pullback.

ETH/USD 4-hour Chart

Ethereum’s technicals on all time-frames show bullishness, with its 4-hour and long-term technicals being a bit more tilted towards the neutral position, while its 1-day overview is completely bullish.

ETH/USD 1-day Technicals

Technical Factors (4-hour Chart):
  • The price is far above its 50-period and its 21-period EMA
  • Price is at the top Bollinger band
  • RSI is close to overbought (66.91)
  • Volume is elevated
Key levels to the upside          Key levels to the downside

1: $400                                     1: $378

2: $415                                     2: $371

3: $420                                      3: $360

Ripple

The fourth-largest cryptocurrency by market cap has, like yesterday, used the momentum that Bitcoin has provided to push further up. Its price has established itself above the $0.2454 support level and pushed past $0.25. However, the $0.26 resistance level has not fallen, and XRP is now consolidating at the ~$0.255 level.

XRP’s upside is a zone of strong resistance, which this cryptocurrency will hardly surpass without Bitcoin’s push. XRP traders should pay attention to Bitcoin’s moves while focusing on XRP’s moves towards the downside.

XRP/USD 4-hour Chart

XRP’s technicals have changed quite a bit since our last report. Its 4-hour, 1-day, and weekly overviews are strongly tilted towards the buy-side, while its monthly overview is still bearish with a slight hint of neutrality.

XRP/USD 1-day Technicals

Technical factors (4-hour Chart):
  • The price far above its 50-period EMA and above its 21-period EMA
  • Price is at its top Bollinger band
  • RSI is close to overbought (65.61)
  • Volume is below average
Key levels to the upside          Key levels to the downside

1: $0.26                                     1: $0.2454

2: $0.266                                   2: $0.235

3: $0.2855                                3: $0.227


Categories
Crypto Market Analysis

Daily Crypto Review, Oct 21 – Bitcoin Above $12,000; Bull Market in Full Swing

The cryptocurrency sector was mostly in the red until Bitcoin took the day to push past $12,000, after which some cryptos started following it towards the upside. Bitcoin is currently trading for $12.234, representing an increase of 4.21% on the day. Meanwhile, Ethereum gained 0.40% on the day, while XRP lost 0.31%.

 Daily Crypto Sector Heat Map

If we look at the top 100 cryptocurrencies, we can see that Nano gained 6.94% in the past 24 hours, making it the top daily gainer. Aave (5.59%) and OKB (5.41%) also did great. On the other hand, NXM lost 13.92%, making it the most prominent daily loser. It is followed by Reserve Rights’ loss of 13.85% and Arweave’s loss of 12.59%.

Top 10 24-hour Performers (Click to enlarge)

Bottom 10 24-hour Performers (Click to enlarge)

Bitcoin’s market dominance level has increased slightly since when we last reported, with its value is currently 60.5%. This value represents a 1% difference to the upside when compared to when we last reported.

Daily Crypto Market Cap Chart

The crypto sector capitalization has stayed at the same spot since we last reported. Its current value is $366.26 billion, representing an increase of $0.79 billion compared to our previous report.

_______________________________________________________________________

What happened in the past 24 hours?

_______________________________________________________________________

_______________________________________________________________________

Technical analysis

_______________________________________________________________________

Bitcoin

The largest cryptocurrency by market capitalization is pushing past its psychological and actual major resistance of $12,000 right at this moment. The move started slow, with one candle testing the waters above $12,000 before backing out, before bulls went head-on and pushed the move quickly to far above this level. At the moment, Bitcoin has stopped its push at just above $12,250.

Traders should pay attention to hot Bitcoin finishes this move and trade either the pullback or the next wave up.

BTC/USD 1-day Chart

Bitcoin’s technical overview is strongly tilted towards the buy-side, with lower time-frames showing some signs of neutrality, while longer time-frames are completely bullish.

BTC/USD 1-day Technicals

Technical factors (4-hour Chart):
  • Price is far above its 50-period EMA and at its 21-period EMA
  • Price above its top Bollinger band
  • RSI is extremely overbought (80.30)
  • Volume is elevated
Key levels to the upside          Key levels to the downside

1: $12,330                                 1: $12,000

2: $12,500                                 2: $11,850

3: $12,870                                  3: $11,735

Ethereum

Ethereum’s price was pretty much stagnant until Bitcoin broke $12,000, which is when the second-largest cryptocurrency by market cap started pushing up as well. The price has slowly pushed past $371 and then explosively past $378, which is where it is at the moment.

Traders should pay attention to how ETH tries to establish itself above $378, and trade off of it.

ETH/USD 4-hour Chart

Ethereum’s 4-hour technicals are showing a tilt towards the sell-side, while its 1-day overview is still bullish. When taking a look at its longer time-frames, we can see heavy neutrality, but still overall bulishness.

ETH/USD 1-day Technicals

Technical Factors (4-hour Chart):
  • The price is above its 50-period and its 21-period EMA
  • Price is near the top Bollinger band
  • RSI is neutral (56.02)
  • Volume is elevated
Key levels to the upside          Key levels to the downside

1: $400                                     1: $378

2: $415                                     2: $371

3: $420                                      3: $360

Ripple

The fourth-largest cryptocurrency by market cap used the momentum Bitcoin’s move has created to push past its $0.2454 resistance once again after falling below it the day before. While this is a great thing, XRP couldn’t pass its previous resistance level of $0.25, which caused it to retest the support level. If it drops below $0.2454 again, bears may gather in a larger number and XRP might push down towards $0.235

XRP/USD 4-hour Chart

XRP’s technicals are quite mixed up, with its 4-hour and weekly overviews showing signs of bullish sentiment, while its daily and monthly overviews are tilted towards the sell-side.

XRP/USD 1-day Technicals

Technical factors (4-hour Chart):
  • The price is at its 50-period EMA and above its21-period EMA
  • Price is near its top Bollinger band
  • RSI is neutral (53.64)
  • Volume is below average
Key levels to the upside          Key levels to the downside

1: $0.26                                     1: $0.2454

2: $0.266                                   2: $0.235

3: $0.2855                                3: $0.227


Categories
Crypto Market Analysis

Daily Crypto Review, Oct 20 – Bitcoin Above $12,000 by the End of the Month? Bull Market has Already Started

The cryptocurrency sector has pushed towards the upside as Bitcoin reached $11,850. Bitcoin is currently trading for $11,741, representing an increase of 2.22% on the day. Meanwhile, Ethereum gained 0.50% on the day, while XRP gained 1.69%.

 Daily Crypto Sector Heat Map

If we look at the top 100 cryptocurrencies, we can see that Dash gained 11.62% in the past 24 hours, making it the top daily gainer. Stellar (7.37%) and Quant (6.5%) also did great. On the other hand, Aave lost 10.73%, making it the most prominent daily loser. It is followed by Crypto.com Coin’s loss of 10.06% and NEAR Protocol’s loss of 9.3%.

Top 10 24-hour Performers (Click to enlarge)

Bottom 10 24-hour Performers (Click to enlarge)

Bitcoin’s market dominance level has increased slightly since our last report, with its value is currently 59.5%. This value represents a 0.7% difference to the upside when compared to when we last reported.

Daily Crypto Market Cap Chart

The crypto sector capitalization has lost a bit of its value since Friday. Its current value is $365.47 billion, representing a decrease of $4.35 billion compared to our previous report.

_______________________________________________________________________

What happened in the past 24 hours?

_______________________________________________________________________

_______________________________________________________________________

Technical analysis

_______________________________________________________________________

Bitcoin

The largest cryptocurrency by market capitalization has pushed past its major resistance sitting at $11,500. The push was accompanied by a major volume increase, which brought Bitcoin’s price to as high as $11,850 before dropping back down to sub-$11,800.


This new spike has put Bitcoin at above 60% year-to-date gains. On top of that, Bitcoin is on track to challenge (and even pass) $12,000, which is a crucial resistance. With the price ignoring all indicators showing that it would bounce back down and pull away from its highs, it does quite the opposite. This inspired many analysts to call for Bitcoin at over $12,000 even by the end of the month.

BTC/USD 1-day Chart

Bitcoin’s technical overview is heavily tilted towards the buy-side, with every single time-frame showing almost no signs of neutrality.

BTC/USD 1-day Technicals

Technical factors (4-hour Chart):
  • Price is above its 50-period EMA and at its 21-period EMA
  • Price near its top Bollinger band
  • RSI is pushing towards the overbought area (63.99)
  • Volume is descending after a major spike
Key levels to the upside          Key levels to the downside

1: $11,735                                 1: $11,630

2: $11,850                                 2: $11,500

3: $12,000                                  3: $11,300

Ethereum

Ethereum’s price moved towards the downside throughout the past week, but then rebounded after hitting the $361 support level and began a slow push towards the upside. Ethereum bulls were patient and slowly took over first the $371 resistance level and now the $378 level, turning them both into support. In both cases, the push was just enough to bring the price above these levels, but the consolidation phase always ended with Ether’s price above its newly found support.

The fundamentals surrounding Ethereum are (at the moment) looking particularly strong as investors are expecting a successful launch of Ethereum 2.0.


ETH/USD 4-hour Chart

Ethereum’s technicals are showing a tilt towards the buy-side on all time-frames. However, while its lower time-frames are being more positive, its longer time-frames are being a bit more neutral (mostly oscillators).

ETH/USD 1-day Technicals

Technical Factors (4-hour Chart):
  • The price is above its 50-period and its 21-period EMA
  • The price between its middle and top Bollinger band
  • RSI is neutral (57.27)
  • Volume is descending from a spike
Key levels to the upside          Key levels to the downside

1: $400                                     1: $378

2: $415                                     2: $371

3: $420                                      3: $360

Ripple

The fourth-largest cryptocurrency by market cap has unexpectedly pushed towards the upside as XRP whales reemerged and went on a buying spree. The most recent upswing has put XRP above the $0.2454 level, which has proven itself both as strong support and resistance level. At the time of writing, XRP seems like it will stay above the level, even though most of its indicators are showing a strong possibility of price pulling back a bit more.

Traders should pay attention to how XRP handles the $0.2454 support level and trade it as XRP bounces up or breaks below it.


XRP/USD 4-hour Chart

XRP’s technicals are quite mixed up. While its 4-hour overview is neutral-bullish, its 1-day chart is completely bearish. On the other hand, its weekly overview is tilted towards the buy-side, while its monthly overview is quite neutral, but still leaning slightly towards the bear side.

XRP/USD 1-day Technicals

Technical factors (4-hour Chart):
  • The price is at its 50-period EMA and above its21-period EMA
  • Price is near its top Bollinger band
  • RSI is neutral (53.39)
  • Volume is below average
Key levels to the upside          Key levels to the downside

1: $0.26                                     1: $0.2454

2: $0.266                                   2: $0.235

3: $0.2855                                3: $0.227


Categories
Crypto Cryptocurrencies

Crypto-Addiction: When the Bubble is Not the Only Risk

Volatility in the markets is indissoluble from human passions and influences that mass psychology that also computes in stock prices in the markets. With it came the sense of risk, emotion, borderline situations, compulsive follow-up, and also brought that some investors fall into a stock market gambling addiction where the bets are named after listed companies.

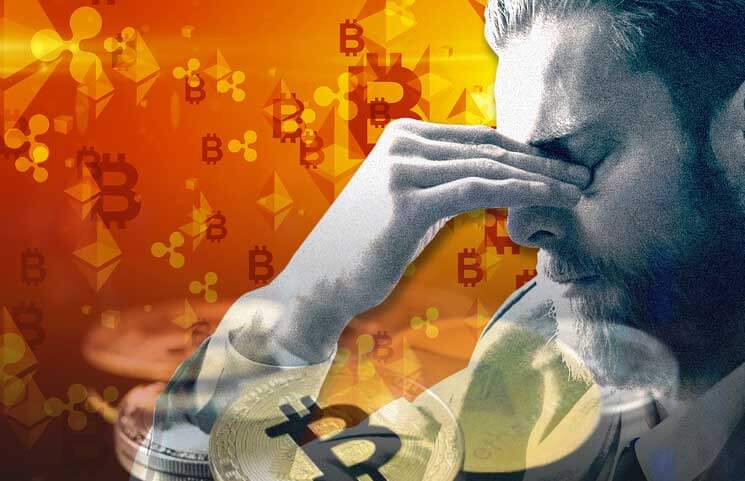
No asset is really oblivious to this type of dynamics, in which there are people more and less prone. But after the crypto-active fever that seems to be in remission (for the moment), new forms of this particular addiction are now emerging in specialized clinics. Yes, the particular characteristics of crypto-currency trading lend themselves in a special way to end up betting what is not due to a token when betting on a horse at the racetrack.

The red line that divides the inversion of the bets is often indistinguishable.

Popular capitalism gave the small shareholders the possibilities reserved until then only to the big capitals, not without the due dose of “dirigisme” of mass money that can make rich and can trigger crises. Markets arrived (theoretically) to bring liquidity and transparency to quotes from companies that could also be financed by mechanisms such as VOPs or by issuing new securities.

But there is much more background than it seems on this issue and its relationship to investment and markets. After all, crudely put, isn’t any investment ultimately nothing more than a simple bet? However much we put it behind us, however much we embellish it, however much we try to disguise it, even for the most pragmatic and systematic investors, guessing the future is impossible, and risking your money to a future possibility, The answer is no other than that investors bet.

If there is risk in the future, it is a gamble; and there is always risk, since an unwavering market maxim is that without risk there is no benefit. They can bet in the short, medium or long term, they can bet rationally or compulsively, they can use indicators or based on hunches… whatever, but the union of chance and money, when it is unhealthy, has a name reliably defined by the Royal Academy of the Language: “Pathological addiction to electronic gambling or gambling”.

Crypto-assets were not to be an exception, but rather the assets that reinforce the rule.

After the previous definition, be it professional or mere amateur, we must say that in reality there is no asset that escapes the rush of adrenaline segregated before the fluctuating quotes, being able to make us pass in a matter of days or even hours from wealth to ruin. And crypto-assets are not just one of the assets that can be played like in a casino, but they have several features that make them especially prone to developing certain pathologies.

There are several factors that influence a potential ludopath to develop a pathology. Often the condition arises from the confluence of these exogenous factors with weak points in their internal and particular psychology. But it is very true that there are a number of factors common to all gamblers and all gamblers that make it possible to bring out potentially more dangerous assets than others.

It is the sense of risk that often ends up hooking these patients. A risk that is often borderline, and that causes your glands to release adrenaline and other hormones. As you may know, hormones often act as a natural drug to keep us (or drive away) certain behaviors. And in gambling enthusiasts, that loyalty involves continuing to gamble savings (and debts) on anything that looks like a winning horse. In the end, with a disproportionate and uncontrolled risk, comes psychological dependence and almost certain economic ruin.

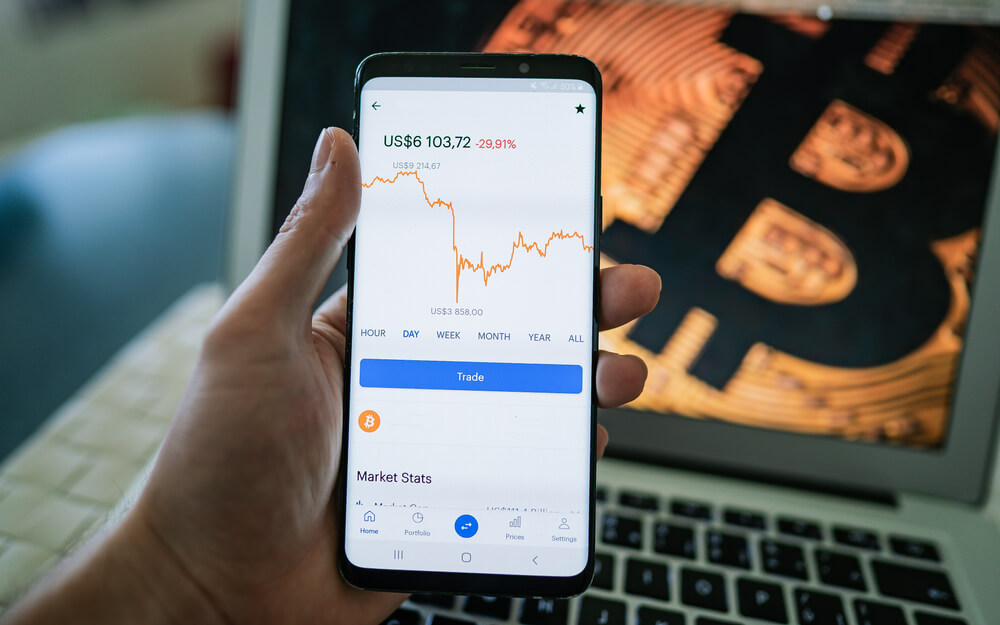
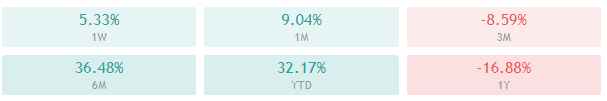
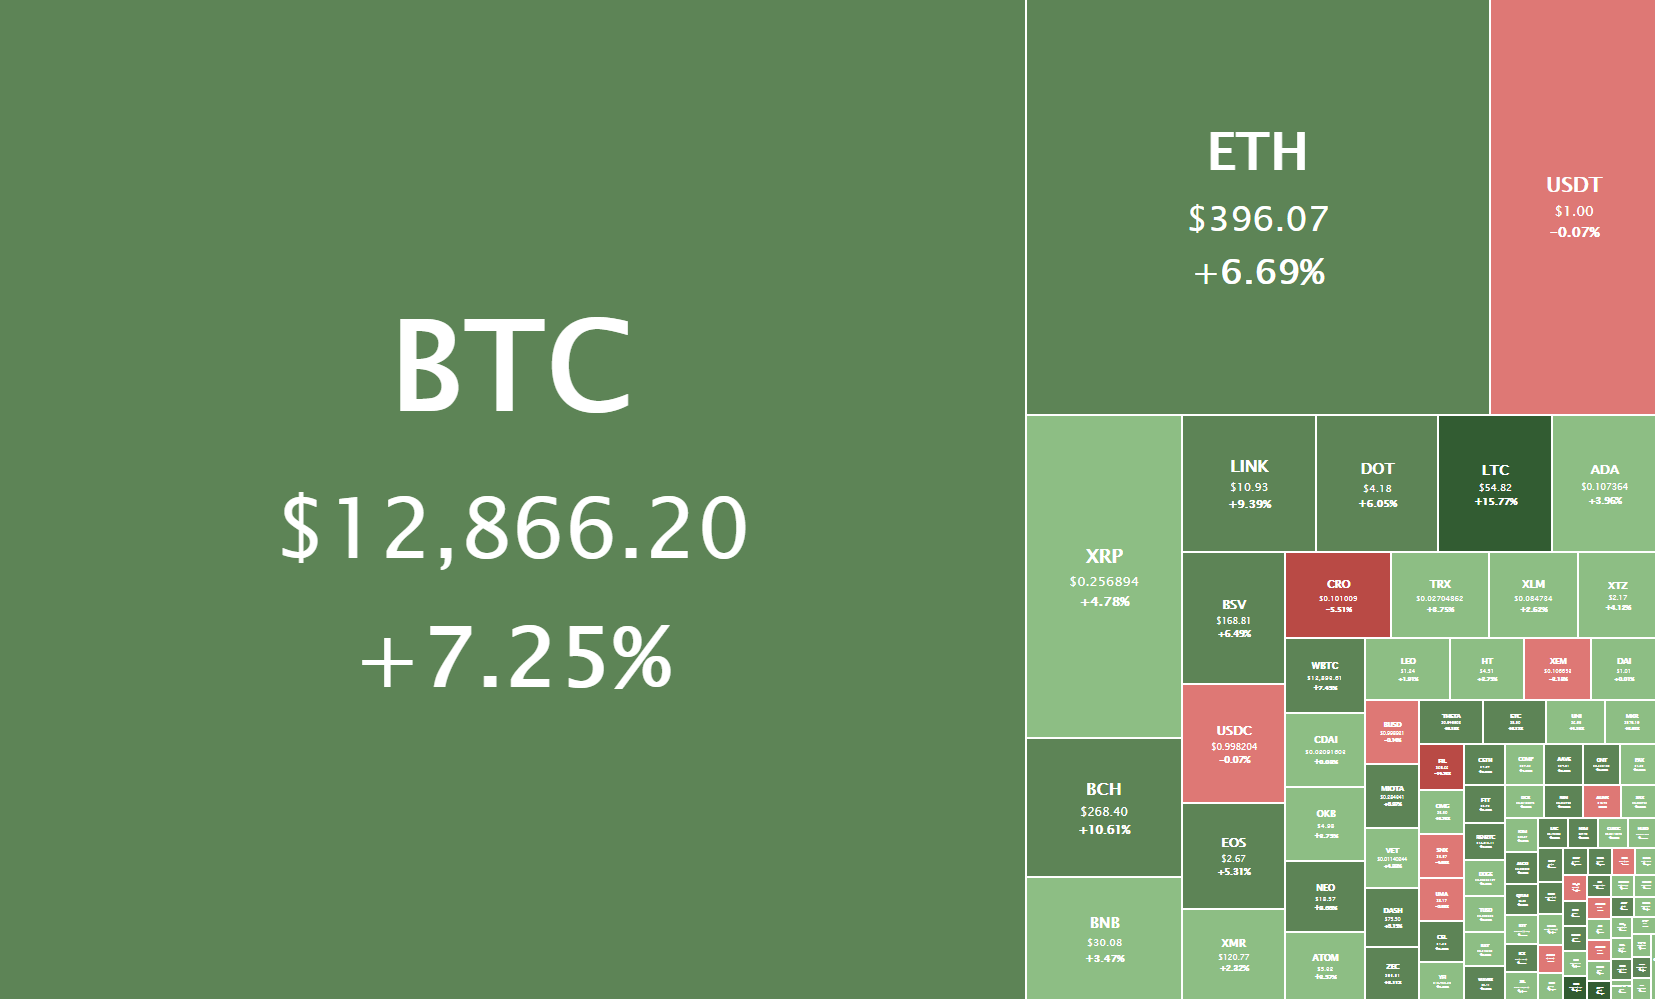
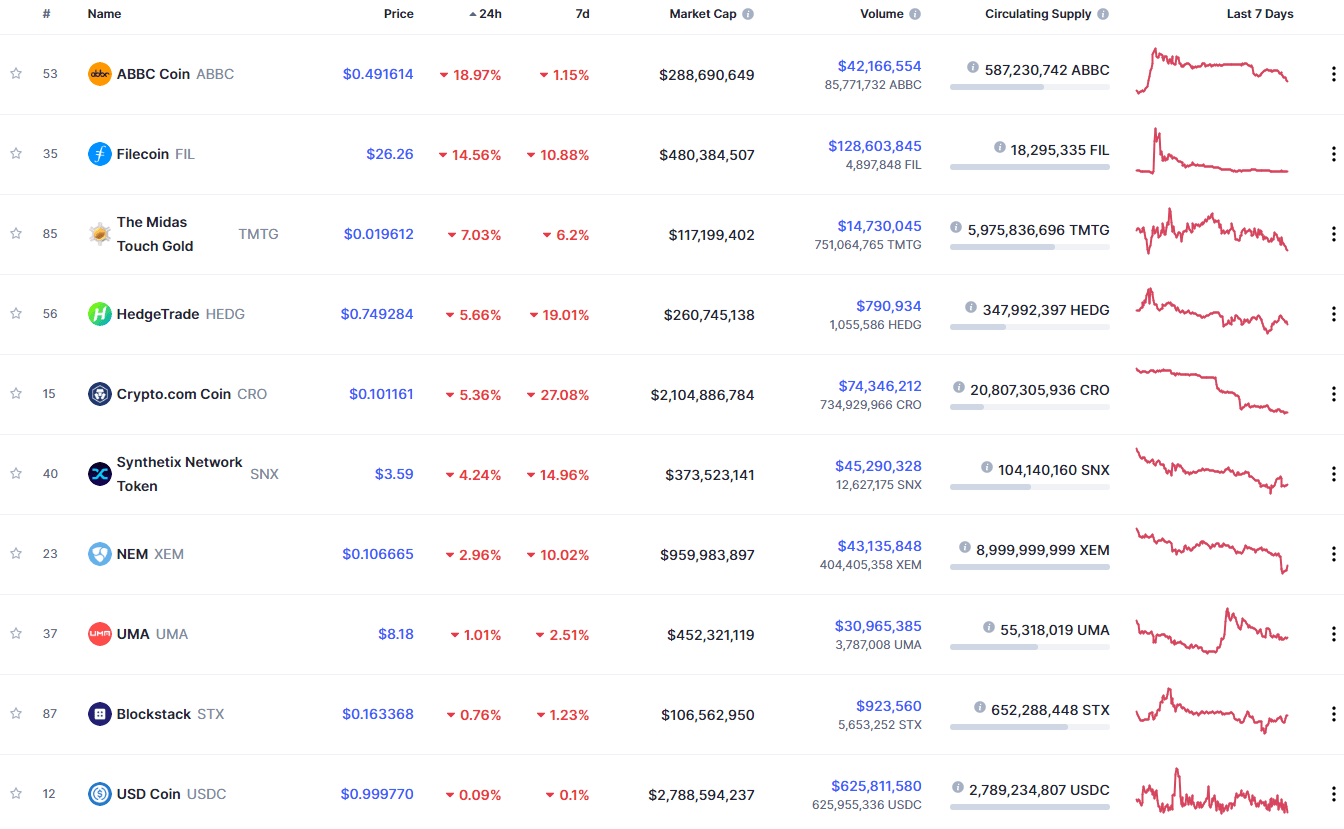
Crypto-assets have always been (and have been) advertised to us as high-risk assets. And not only because of their unreliability as an investment value and because of the bubble we have warned them about so many times, but also because of their high volatility in the markets. That volatility means only one thing in the gambler’s glands: more hormones in the bloodstream with every operation, with every look at quotes, minute after minute, hour after hour.

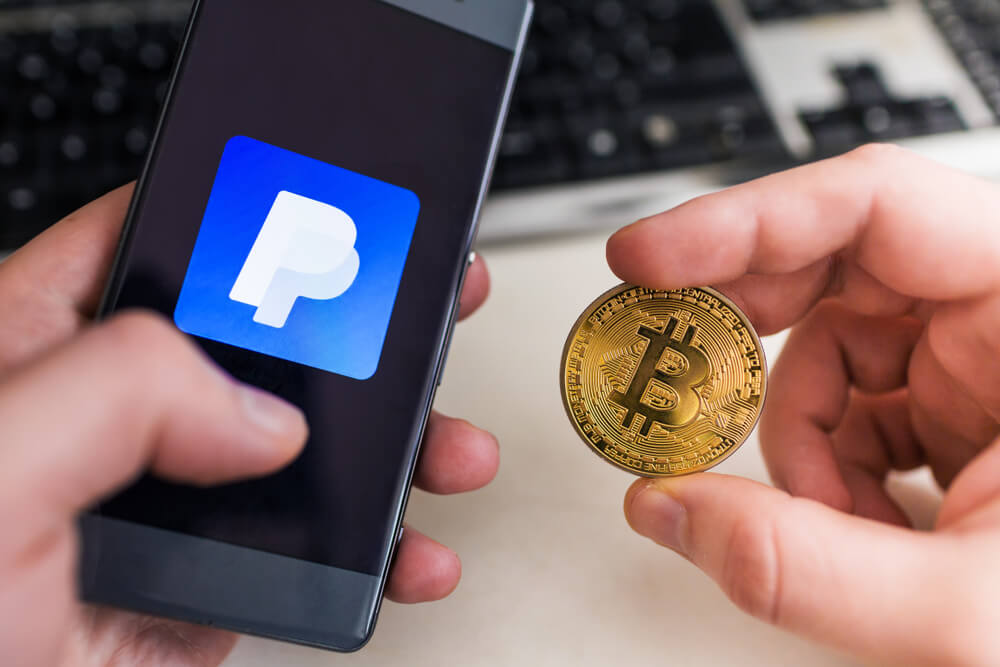
To the volatility, we must add other dangerous companions of travel (or investment). They are liquidity (also called Immediacy) and ubiquity (also known as compulsiveness). These two friends make the temptation not live upstairs, but live on the smartphone that we all carry around 24 hours a day. Once the pathology is developed, whether diagnosed or not, it is difficult to escape it.

And the two most important factors go through believing what you want to believe, not what you are.

Crypto-assets have a remarkable feature in terms of addiction. Often the gambler deceives himself with philosophies or pilgrim ideas, which basically only seek to reinforce him in his incessant search for hormones (and profits). The whole philosophy surrounding crypto-economics can be a perfect disguise to be used as an excuse to convince oneself that one is not risking one’s life savings, but is investing in the future that only a few know how to see. Thus the patient can easily exonerate himself and continue to be plunged into blindness, reinforced by the fact that others have already made crypto-coins immensely rich in the past.

And one last ingredient for this poisonous potion, to which many are nevertheless immune, is the natural technical opacity inherent in crypto-economics and the halo of exciting and (something) mysterious future that surrounds it, at least as far as the general public is concerned. The reality of “Main Street” is that most crypto-asset investors do not have enough training to understand them 100% (or 50%).

With the latter, the sentence is handed down, and those likely to fall victim to this type of gambling addiction find it much easier to hide irrational passions and impulses behind crypto-tickers than after other assets. They don’t understand in detail what’s behind these token names, but in their minds, they shine like decisions of the future in the darkness that to their understanding surrounds everyone who has not seen the light of the crypto-coins.

The (relatively few) pathologically affected will not want to see it, but the therapies are there.

The best proof that crypto-addiction is more a reality than a theory (of course nuanced than only in certain cases), is that hospitals specializing in the treatment of gambling addiction have launched specific programs for the case of addicts to trading with crypto-assets.

This is the case of the Castle Craig Hospital in Scotland, where they say that this addiction can either be framed within a general addiction to gambling of any kind or be a dangerous obsession with its own entity. In this center, they treat both facets of the addictive pathology. Various specialists have already described how crypto-active trading is a veritable neurological roller coaster, which carries with it dangers such as developing a dangerous addiction (or ruined, don’t forget).

The new treatment of Castle Craig Hospital only represents the response of the center to the significant increase in the specific demand for crypto-trading, which were observed by numerous addicted patients. However, the same sources say that it is relatively rare to encounter pathologies focused exclusively on trading with Bitcoin or other cryptocurrencies because the underlying problem is usually a more general gambling addiction.

In any case, they also state that the data points to the fact that crypto-trading’s exclusive pathologies have been showing a clear upward trend for months. And they also remark that, although they treat it as a type of gambling addiction, the reality is that it is a particularly addictive and aggressive modality.

The reasons why they understand this to be the case are in line with what we told them before: this type of gambling addiction is available to those affected 24 hours a day, it is continuous, permanent. And this impossibility of disconnection is precisely what most “hooks” (and likes) gamblers in general. In the end, for the patient, it is no longer even a matter of winning or losing, but of repeating again and again and thus getting the hormonal response of the emotion that invades them after each crypto-trading operation. What investor has not experienced this emotion to a greater or lesser extent on more than one occasion? Well, you know what we talked about in this article.

A potential psychological profile that in some cases becomes pathological.

The reality is that many crypto-addicts are also “hooked” on trading with other traditional currencies other than crypto-currencies, but it is no less true that crypto-trading gives them an extra dose of adrenaline as it is a very volatile market with large fluctuations. From this specialized hospital, they point out that they believe that there are enough crypto-traders who have already developed a certain degree of addiction, but that, not only have they not become aware of it, but that being permanently and obsessively aware of the crypto-market seems normal to them.

What’s more, these traders are often convinced that they are especially smart to have entered this crypto-market and that they almost always believe they are doing very well. To this particular point in the previous Motherboard article, we would add from these lines that, in addition, crypto-addicts are characterized by reacting viscerally and very aggressively to everything that challenges their grand vision of the future, and do not listen to reasons or to the experience of the most veterans of the markets (dispute with that classic “this time is different”).

The best prevention is yourselves.

We cannot close this analysis without qualifying that what is written here is only intended to warn of a very common pathology in the markets, but significantly more dangerous in the case of crypto-assets. This does not mean that, in their theories of the future, these crypto-addicts may be quite right at certain points. In fact, from these lines, we have shown ourselves on more than one occasion as crypto-enthusiasts declared. The problem is not that. The most serious and difficult thing about this addiction is to realize when crypto-economics is a theory or a way to disguise a gambling addiction.

From here we can no longer help them to distinguish between the one and the other. And in the initial stages of this addiction, only you and your ability to see reality and make self-criticism can help you before it’s too late and your savings have already volatilized.

Even on the assumption that the crypto-currency operation will give you a positive balance on your current account, if you are one of those who spends 14 hours a day glued to crypto-quotes on the screen of your smartphone without it being your professional activity, You should seriously consider whether you have already crossed the diffuse red line separating normal from an addictively compulsive operation. To go to the specialist only when one sees that one is ruined is to go for help when it is already too late.

Be cautious and always try to put barriers of containment in the face of the burdensome terrain that already enters addiction. In this type of swamp, it is much easier to avoid entering than then leaving. As in many psychological conditions, it is really complex to realize (and even define a diagnosis for specialists) when something is normal and when it is no longer normal.

The best therapy is the one that does not need to be applied, so it is best to always stay alert, control exposure to stimulus, monitor anxiety, be attentive to your body’s responses, and, above all… of his mind. And think about whether devoting so much time to earning (and in many cases losing) money is worth it in front of being with your children, talking to your partner, or hanging out with friends… Especially when, in your right measure, you have the life to devote yourself to all of it (and also for a little trading without excesses). Enjoy in the markets (yes, also in crypto-markets), but do not live for it.

Categories
Crypto Market Analysis

Daily Crypto Review, Oct 19 – Stablecoin Market Surpasses $20 Billion; Tether Dominating With Market Cap of Almost $16 Billion

The cryptocurrency sector has spent the weekend pushing towards higher highs but ultimately being stopped out at the most recent highs. Bitcoin is currently trading for $11,471, representing an increase of 0.71% on the day. Meanwhile, Ethereum gained 1.63% on the day, while XRP gained 0.35%.

 Daily Crypto Sector Heat Map

If we look at the top 100 cryptocurrencies, we can see that UMA gained 24.3% in the past 24 hours, making it the top daily gainer. Aave (19.42%) and Reserve Rights (14.8%) also did great. On the other hand, Filecoin lost 23.88%, making it the most prominent daily loser. It is followed by Crypto.com Coin’s loss of 8.92% and Waves’ loss of 4.28%.

Top 10 24-hour Performers (Click to enlarge)

Bottom 10 24-hour Performers (Click to enlarge)

Bitcoin’s market dominance level has increased slightly since our last report, with its value is currently 58.9%. This value represents a 0.2% difference to the upside when compared to when we last reported.

Daily Crypto Market Cap Chart

The crypto sector capitalization has lost a bit of its value since Friday. Its current value is $361.12 billion, representing a decrease of $1.44 billion compared to our previous report.

_______________________________________________________________________

What happened in the past 24 hours?

_______________________________________________________________________

_______________________________________________________________________

Technical analysis

_______________________________________________________________________

Bitcoin

The largest cryptocurrency by market capitalization has spent its weekend building up a bull presence and trying to push towards (and past) the $11,500 resistance level. However, the move failed, and Bitcoin is now trading just under the resistance line. With that being said, the volume that followed this move was incredibly low, which implies that a bigger move is ahead, and that traders should pay attention to what happens with the volume in the near future.

Bitcoin will most likely either go up or stay above $11,300, as many analysts say that Bitcoin is done with its sub-$11,000 area. However, we do have to pay attention to the Bitcoin CME Futures Gap.

BTC/USD 1-day Chart

Bitcoin’s technical overview is tilted towards the buy-side on every single time-frame. While its 4-hour and 1-day time-frames are showing neutral bullishness, its weekly and monthly sentiment is extremely positive.

BTC/USD 1-day Technicals

Technical factors (4-hour Chart):
  • Price is above its 50-period EMA and at its 21-period EMA
  • Price near its top Bollinger band
  • RSI is neutral (57.29)
  • Volume is below average and descending
Key levels to the upside          Key levels to the downside

1: $11,500                                 1: $11,300

2: $11,630                                 2: $11,180

3: $12,000                                  3: $11,000

Ethereum

Ethereum’s price movement throughout the weekend looked a lot like Bitcoin’s, but with a twist. The second-largest cryptocurrency by market cap moved towards the downside and (just like Bitcoin) created three lower highs on the way down. However, unlike Bitcoin, Ethereum has broken the downtrend and shot up in recent hours, though only to be stopped by the $378 resistance level. While there is still a chance for Ethereum to break this level, it will most likely be stuck below it (possibly within a range bound by $371 and $378) in the short-term.

ETH/USD 4-hour Chart

Ethereum’s technicals are showing a tilt towards the buy-side on all time-frames, with lower time-frames being more positive, while longer time-frames being more tilted towards the neutral stance (mostly oscillators).

ETH/USD 1-day Technicals

Technical Factors (4-hour Chart):
  • The price is above its 50-period and its 21-period EMA
  • The price at its middle Bollinger band
  • RSI is neutral (54.55)
  • Volume is descending
Key levels to the upside          Key levels to the downside

1: $378                                     1: $371

2: $400                                     2: $360

3: $415                                      3: $334

Ripple

XRP spent the weekend mostly trading sideways or rising a little after a whole week of price drops. The fourth-largest cryptocurrency by market capitalization fell under the $0.2454 and stayed below it over the weekend, and even though it is moving towards it, the current volume would not support a break of such a major resistance level.

Many analysts are calling for even more downward movement from XRP, justifying it by saying that this is a continuation of a trend dating back from 2018. The reduced volatility and range-bound trading seem to be confirming this thesis.

XRP/USD 4-hour Chart

XRP’s technicals are extremely bearish. Its 4-hour and daily sentiment being tilted towards the sell-side fully, while its weekly and monthly overviews are showing some signs of neutrality, though they are also heavily bearish.

XRP/USD 1-day Technicals

Technical factors (4-hour Chart):
  • The price is below both its 50-period EMA and its 21-period EMA
  • Price is at its middle Bollinger band
  • RSI is neutral (42.17)
  • Volume is below average
Key levels to the upside          Key levels to the downside

1: $0.2454                                 1: $0.235

2: $0.26                                     2: $0.227

3: $0.266                                  3: $0.221


Categories
Crypto Market Analysis

BTC/USD Chart Overview + Possible Outcomes

In this BTC /USD 1-day time-frame analysis, we will be looking at the most recent events, the current technical formations, as well as discussing possible outcomes.

Overview

Bitcoin has had a week of explosive gains, mostly due to its fundamentals. The US President Donald Trump announced another set of stimulus packages (while he was completely against it just before the announcement), as well as Jack Dorsey’s Square investing $50 million in Bitcoin sparked bulls’ interest and made the largest cryptocurrency by market cap push above $11,700. Bitcoin established support above its previous heavy resistance level, which is certainly another great sign for the bulls. However, one technical formation says that additional correction is ahead before the next push towards $12,000.

Technical factors

Bitcoin has left its triangle formation abruptly and to the upside, breaking not only the formation but also numerous resistances. The price started consolidating in a range bound by $11,300 to the downside and $11,500 to the upside, which was a great trading opportunity for traders that like sideways trading. Taking a look at smaller time-frames, Bitcoin has built a downwards-sloping channel that calls for a slight pullback (and a possible fill of the Bitcoin CME Futures gap) before pushing further up.

There are two most likely versions of this pullback, and both will be discussed above. However, an unexpected price spike or plummet is always a possibility, no matter how slim.

Likely Outcomes


Bitcoin currently has two main scenarios. It can play out, and both involve a pullback before a push towards $12,000.

  1. As shown on the chart, Bitcoin will most likely follow the channel until it finds strong support; it cannot go below, after which it will break the channel to the upside. After finding confirmation above it, it is free to push towards the upside ($11,730, $11,960, or even $12,000).
  2. The other scenario is a bit tricky, and therefore a bit less likely. The premise for this scenario is the head and shoulders chart pattern that started in late April of this year. The most recent high of this scenario is the top of the right shoulder, while the neckline is the black ascending line shown on the chart. In this scenario, the price would move alongside the dotted line until it hit the neckline, after which it would start to go up. In this case, the pullback and confirmation would most likely happen above $11,300, and only after consolidating above this level could Bitcoin push to the aforementioned targets.
  3. The scenario in which Bitcoin suddenly pushes up or down sharply and swiftly is incredibly unlikely and would have to be backed by some major news.
Categories
Crypto Market Analysis

Daily Crypto Review, Oct 16 – ICO That Raised $257 Million in 60 Minutes Finally Launched; Bitcoin Pushing Towards $11,500

The cryptocurrency sector has spent the day trying to push higher highs but failed as Bitcoin didn’t make it above $11,500. Bitcoin is currently trading for $11,486, representing an increase of 0.65% on the day. Meanwhile, Ethereum lost 0.64% on the day, while XRP lost 1.42%.

 Daily Crypto Sector Heat Map

If we look at the top 100 cryptocurrencies, we can see that Filecoin gained an astonishing 120.78% in the past 24 hours, making it the top daily gainer. ABBC Coin (39.25%) and Blockstack (9.35%) also did great. On the other hand, Aave lost 15.89%, making it the most prominent daily loser. It is followed by Arweave’s loss of 14.13% and Synthetix Network Token’s loss of 8.96%.

Top 10 24-hour Performers (Click to enlarge)

Bottom 10 24-hour Performers (Click to enlarge)

Bitcoin’s market dominance level has stayed at the same level since our last report, with its value currently being 58.7%. This value represents a 0% difference when compared to when we last reported.

Daily Crypto Market Cap Chart

The crypto sector capitalization has gained a bit of its value over the course of the past 24 hours. Its current value is $362.56 billion, representing an increase of $1.46 billion compared to our previous report.

_______________________________________________________________________

What happened in the past 24 hours?

_______________________________________________________________________

_______________________________________________________________________

Technical analysis

_______________________________________________________________________

Bitcoin

The oldest cryptocurrency spent the past 24 hours trying to push past the $11,500 resistance. While the fight for it still continues, there is a strong possibility that Bitcoin will actually stabilize its price above it. If that happens, bulls might come in even stronger and push the price towards $11,630, or even $11,730.

If, however, Bitcoin moves back below $11,500, the sentiment won’t change to a lot more bearish one, as Bitcoin is used to trading above $11,300 as of lately.

BTC/USD 1-day Chart

Bitcoin’s technical overview is extremely bullish on every single time-frame for almost a month now, with longer time-frames showing complete bullish sentiment, while the shorter ones are slightly less tilted towards the buy-side.

BTC/USD 1-day Technicals

Technical factors (4-hour Chart):
  • Price is above its 50-period EMA and at its 21-period EMA
  • Price near its top Bollinger band
  • RSI is neutral (60.70)
  • Volume is average
Key levels to the upside          Key levels to the downside

1: $11,500                                 1: $11,300

2: $11,630                                 2: $11,180

3: $12,000                                  3: $11,000

Ethereum

Unlike Bitcoin that tried to push towards its resistance level, Ethereum spent the day fighting to stay above the $378 level it recently fell under. The second-largest cryptocurrency by market cap tested the $371 support level, which held up quite nicely and attempted a push towards (now) resistance level of $378. While the fight for it still lasts, Ethereum will most likely end up above it if Bitcoin’s price doesn’t drop and pull ETH alongside.

ETH/USD 4-hour Chart

Ethereum’s technicals on all time-frames are a varying degree of bullish. While its 4-hour and monthly overviews are a bit more neutral, its daily and weekly overviews are strongly tilted towards the buy-side.

ETH/USD 1-day Technicals

Technical Factors (4-hour Chart):
  • The price is above its 50-period and right at its 21-period EMA
  • The price at its middle Bollinger band
  • RSI is neutral (54.03)
  • Volume is average
Key levels to the upside          Key levels to the downside

1: $378                                     1: $371

2: $400                                     2: $360

3: $415                                      3: $334

Ripple

XRP has spent the past 24 hours continuing its drop towards the $0.2454 support level. XRP is approaching a quarterly price drop of 20% if the price breaks to the downside. However, so far, the $0.2454 support level is holding up, and XRP bears are not able to break it. If the support level break, we can expect XRP to move towards $0.235.

Traders should either wait for a bounce towards the upside (less likely and riskier) or wait for a possible break below $0.2454 to trade alongside the strong move to the downside.


XRP/USD 4-hour Chart

XRP’s technicals have changed the sentiment to quite bearish in the past couple of days. While its monthly sentiment was bearish for a while, its 4-hour and 1-day overviews have turned completely towards the sell-side. On the other hand, XRP’s weekly overview is still slightly bullish.

XRP/USD 1-day Technicals

Technical factors (4-hour Chart):
  • The price is below both its 50-period EMA and its 21-period EMA
  • Price is slightly above its lower Bollinger band
  • RSI is neutral (40.83)
  • Volume is average (except for a couple of huge volume candle)
Key levels to the upside          Key levels to the downside

1: $0.266                                   1: $0.2454 

2: $0.27                                     2: $0.235

3: $0.273                                  3: $0.227


Categories
Crypto Market Analysis

Daily Crypto Review, Oct 15 – JP Morgan Says Bitcoin is Overvalued; XRP Crashes As it Breaks Major Support

The cryptocurrency sector has spent the day trying to find a point of consolidation. However, most cryptocurrencies did end up in the red. Bitcoin is currently trading for $11,412, representing a decrease of 0.38% on the day. Meanwhile, Ethereum lost 1.28% on the day, while XRP lost 3.36%.

 Daily Crypto Sector Heat Map

If we look at the top 100 cryptocurrencies, we can see that ABBC Coin gained 21.28% in the past 24 hours, making it the top daily gainer. Reserve Rights (19.41%) and Ren (13.61%) also did great. On the other hand, Storj lost 13.98%, making it the most prominent daily loser. It is followed by Uniswap’s loss of 12.63% and Energy Web Token’s loss of 9.94%.

Top 10 24-hour Performers (Click to enlarge)

Bottom 10 24-hour Performers (Click to enlarge)

Bitcoin’s market dominance level has decreased since our last report, with its value currently being 58.7%. This value represents a 2.54% difference to the downside when compared to when we last reported.

Daily Crypto Market Cap Chart

The crypto sector capitalization has lost a bit of its value over the course of the past 24 hours. Its current value is $360.10 billion, representing a decrease of $1.88 billion compared to our previous report.

_______________________________________________________________________

What happened in the past 24 hours?

_______________________________________________________________________

_______________________________________________________________________

Technical analysis

_______________________________________________________________________

Bitcoin

The largest cryptocurrency by market cap spent the past 24 hours stuck within a range bound by the $11,300 support level and $11,500 resistance level. The price entered a state of enormous volatility at one point, where Bitcoin tried to break both to the upside and downside. However, the move to the upside was quickly shut down, while the move towards the downside took a bit more time but failed as well. This left Bitcoin in a narrow range, which it will come out of as soon as the bulls and bears stabilize. Its decreasing RSI and volume are proof of future possible, sideways trading, as well as a big move up ahead.

BTC/USD 1-day Chart

Bitcoin’s technical overview is extremely bullish on every single time-frame, with longer time-frames showing full tilt towards the buy-side, while the shorter ones are slightly tilted towards the buy-side.

BTC/USD 1-day Technicals

Technical factors (4-hour Chart):
  • Price is above its 50-period EMA and at its 21-period EMA
  • Price is at the middle Bollinger band
  • RSI is neutral and descending (53.49)
  • Volume is average
Key levels to the upside          Key levels to the downside

1: $11,500                                 1: $11,300

2: $11,630                                 2: $11,180

3: $12,000                                  3: $11,000

Ethereum

Ethereum (just like Bitcoin) tried to find a consolidation price but failed to do so. The second-largest cryptocurrency by market cap faced an upward-facing trend line which it could not follow anymore that triggered a selloff and a drop below the line as well as the $378 support level. While Ethereum is still fighting for the support (now resistance) level, the price will most likely stay above this line.

ETH/USD 4-hour Chart

Ethereum’s technicals on all time-frames are bullish, with longer time-frames having a stronger bullish sentiment than the shorter ones. However, its monthly overview’s oscillators are showing indecisiveness, as they are neutral.

ETH/USD 1-day Technicals

Technical Factors (4-hour Chart):
  • The price is above its 50-period and at its 21-period EMA
  • The price at its middle Bollinger band
  • RSI is neutral (51.89)
  • Volume is average
Key levels to the upside          Key levels to the downside

1: $378                                     1: $371

2: $400                                     2: $360

3: $415                                      3: $334

Ripple

XRP had the worst day performance-wise out of the three cryptocurrencies we are covering. The third-largest cryptocurrency by market cap has dropped below its ascending support trend line, which extended the push towards the downside. The price reached as low as the $0.2454 support level, which is where the bulls picked up the pace and pushed the price up slightly.

Traders should pay attention to how XRP’s price moves around the ascending (yellow) resistance line, as well as the $0.2454 support level.

XRP/USD 4-hour Chart

XRP’s technicals are quite inconsistent, with its 4-hour and monthly technicals being tilted towards the sell-side. On the other hand, its weekly overview is bullish, while its daily overview is tilted more towards the bull side, with moving averages still having a hint of bearish sentiment.

XRP/USD 1-day Technicals

Technical factors (4-hour Chart):
  • The price is below both its 50-period EMA as well as its 21-period EMA
  • Price is at its lower Bollinger band
  • RSI is pushing towards the oversold area (38.64)
  • Volume is average (with the exception of one huge volume candle)
Key levels to the upside          Key levels to the downside

1: $0.266                                   1: $0.2454 

2: $0.27                                     2: $0.235

3: $0.273                                  3: $0.227


Categories
Crypto Market Analysis

Daily Crypto Review, Oct 14 – Analysts Calling for a Bull Market; Bitcoin Back Under $11,500

The cryptocurrency sector has experienced a pullback as Bitcoin went under its $11,500 support. Bitcoin is currently trading for $11,425, representing a decrease of 0.31% on the day. Meanwhile, Ethereum gained 0.09% on the day, while XRP lost 0.52%.

 Daily Crypto Sector Heat Map

If we look at the top 100 cryptocurrencies, we can see that PumaPay gained 13.55% in the past 24 hours, making it the top daily gainer. ABBC Coin (9.05%) and Uniswap (6.64%) also did great. On the other hand, Solana lost 7.81%, making it the most prominent daily loser. It is followed by Loopring’s loss of 6.9% and Kusama’s loss of 6.77%.

Top 10 24-hour Performers (Click to enlarge)

Bottom 10 24-hour Performers (Click to enlarge)

Bitcoin’s market dominance level has decreased slightly since our last report, with its value currently being 60.24%. This value represents a 0.16% difference to the downside when compared to when we last reported.

Daily Crypto Market Cap Chart

The crypto sector capitalization has lost a bit of its value over the course of the past 24 hours. Its current value is $361.98 billion, representing a decrease of $5.11 billion compared to our previous report.

_______________________________________________________________________

What happened in the past 24 hours?

_______________________________________________________________________

_______________________________________________________________________

Technical analysis

_______________________________________________________________________

Bitcoin

The largest cryptocurrency by market cap went into pullback mode as it couldn’t stay at its daily high of a little over $11,700. Bitcoin’s bull exhaustion triggered a pullback, which then broke the $11,500 support level to the downside, putting the cryptocurrency boxed in between $10,300 support and $10,500 resistance level. With the volume decreasing and RSI dropping down, we may expect sideways trading in the short-term before another attempt of (mostly likely) upwards motion.

Many analysts say that Bitcoin has almost no chance of going under $11,000 and that the most recent break above it has turned Bitcoin’s sentiment into a bullish one. However, if Bitcoin manages to go under $11,000, we may expect that the move will continue downwards quickly.

BTC/USD 4-hour Chart

Bitcoin’s technical overview is extremely bullish on all time-frames, with longer time-frames showing even stronger bull overview than the shorter ones.

BTC/USD 1-day Technicals

Technical factors (4-hour Chart):
  • Price is above both its 50-period EMA and 21-period EMA
  • Price is at the middle Bollinger band
  • RSI is descending (57.23)
  • Volume is above-average (descending
Key levels to the upside          Key levels to the downside

1: $11,500                                 1: $11,300

2: $11,630                                 2: $11,180

3: $12,000                                  3: $11,000

Ethereum

Ethereum also experienced a pullback from its highs as ETH bulls couldn’t go past $496. However, unlike Bitcoin, Ethereum didn’t break any support levels during the move towards the downside. As it bounced off of the $378 support level, it continued moving alongside a very steep upwards-trending line, which is a very bullish short-term sign.

While moving alongside this line is unsustainable in the long-term, Ethereum might experience some more stable gains in the next couple of days.

ETH/USD 4-hour Chart

Ethereum’s 1-day and weekly overviews extreme tilt towards the bull-side, while its 4-hour and monthly overviews show a bit of indecisiveness, though they are still bullish.

ETH/USD 1-day Technicals

Technical Factors (4-hour Chart):
  • The price is above both its 50-period and its 21-period EMA
  • The price slightly above its middle Bollinger band
  • RSI is neutral (60.70)
  • Volume is elevated (descending to average)
Key levels to the upside          Key levels to the downside

1: $378                                     1: $371

2: $400                                     2: $360

3: $415                                      3: $334

Ripple

XRP is known for being less correlated to Bitcoin’s movements than most other cryptocurrencies, which it has shown today as well. The third-largest cryptocurrency by market cap has traded sideways and hasn’t experienced any pullbacks. It has been trading alongside the upward-trending (yellow) line, which will force XRP to either go under it or face its resistance at the $0.26 level. In the meantime, however, we may expect low volatility.

XRP/USD 4-hour Chart

XRP’s technicals are quite inconsistent, as its daily and weekly overviews show quite a bullish tilt, while its monthly overview is almost completely bearish. Its 4-hour overview is leaning towards the buy-side but is quite neutral.

XRP/USD 1-day Technicals

Technical factors (4-hour Chart):
  • The price is above its 50-period EMA as well as its 21-period EMA
  • Price is at its middle Bollinger band
  • RSI is flat (52.19)
  • Volume is average but descending
Key levels to the upside          Key levels to the downside

1: $0.266                                   1: $0.2454 

2: $0.27                                     2: $0.235

3: $0.273                                  3: $0.227


Categories
Crypto Market Analysis

Daily Crypto Review, Oct 13 – G7 Will Continue to Oppose Libra; Bitcoin Consolidating After Another Bull Run

The cryptocurrency sector has experienced another surge as Bitcoin moved away from $11,300 and closer to $11,500. Bitcoin is currently trading for $11,434, representing an increase of 0.89% on the day. Meanwhile, Ethereum gained 3.35% on the day, while XRP gained 0.03%.

 Daily Crypto Sector Heat Map

Taking a look at the top 100 cryptocurrencies, we can see that Ocean Protocol gained 21.97% in the past 24 hours, making it the top daily gainer. CyberVein (14.58%) and Synthetix Network Token (11.83%) also did great. On the other hand, Ren lost 14.83%, making it the most prominent daily loser. It is followed by PumaPay’s loss of 8.33% and Uniswap’s loss of 3.33%.

Top 10 24-hour Performers (Click to enlarge)

Bottom 10 24-hour Performers (Click to enlarge)

Bitcoin’s market dominance level has decreased slightly since our last report, with its value currently being 60.40%. This value represents a 0.26% difference to the downside when compared to when we last reported.

Daily Crypto Market Cap Chart

The crypto sector capitalization has a bit more value over the course of the past 24 hours. Its current value is $366.13 billion, representing an increase of $7.71 billion compared to our previous report.

_______________________________________________________________________

What happened in the past 24 hours?

_______________________________________________________________________

_______________________________________________________________________

Technical analysis

_______________________________________________________________________

Bitcoin

The largest cryptocurrency by market cap has continued its push towards the upside, getting past $11,500 and even close to the $12,000 mark. The move died out when it approached $11,750. Bitcoin is now in the pullback phase, where its price has breached $11,500 to the downside and is testing how low it can go until the bulls step in again.

Traders should pay attention to how Bitcoin handles the $11,300-$11,500 level when looking for their next trade.


BTC/USD 4-hour Chart

Bitcoin’s technical overview on all time-frames is tilted towards the buy-side, with longer time-frames showing an extremely strong bull overview.

BTC/USD 1-day Technicals

Technical factors (4-hour Chart):
  • Price is above both its 50-period EMA and 21-period EMA
  • Price descending from the top Bollinger band
  • RSI is descending from almost-overbought levels (62.46)
  • Volume is above-average
Key levels to the upside          Key levels to the downside

1: $11,500                                 1: $11,300

2: $11,630                                 2: $11,180

3: $12,000                                  3: $11,000

Ethereum

Ethereum has had another bull-run in the past 24 hours, with its price reaching as high as $396. However, the second-largest cryptocurrency by market cap couldn’t reach past the $400 mark, triggering bull exhaustion, and ultimately a pullback. With volume and RSI dropping, we may expect Ethereum to look for a price to consolidate a bit lower than its current price, and possibly test the $371 support level.


ETH/USD 4-hour Chart

Ethereum’s 1-day and monthly overviews show some signs of doubt in the bullish sentiment, while its 4-hour and weekly overviews are completely bullish.

ETH/USD 1-day Technicals

Technical Factors (4-hour Chart):
  • The price is above both its 50-period and its 21-period EMA
  • The price at its top Bollinger band
  • RSI is flat and nearly overbought (66.74)
  • Volume is elevated
Key levels to the upside          Key levels to the downside

1: $378                                     1: $371

2: $400                                     2: $360

3: $415                                      3: $334

Ripple

Unlike Bitcoin and Ethereum, which both had a strong bull presence today, XRP has been trading sideways for most of the day. Its inability to reach past the $0.26 level has proven to be a problem, and we may expect XRP’s price to collide with the ascending trend line very soon. There is a small probability that XRP will reach past $0.26 and get close to $0.266, but it will most likely happen with Bitcoin’s help (though it is more likely that XRP will face the ascending line first).


XRP/USD 4-hour Chart

XRP’s 1-day technicals show a hint of doubt in its short-term bullish sentiment, while the 4-hour and weekly overviews are completely bullish. However, XRP’s monthly overview is still completely tilted towards the sell-side.

XRP/USD 1-day Technicals

Technical factors (4-hour Chart):
  • The price is above its 50-period EMA as well as its 21-period EMA
  • Price is at its middle Bollinger band
  • RSI is flat (55.33)
  • Volume is average but descending
Key levels to the upside          Key levels to the downside

1: $0.266                                   1: $0.2454 

2: $0.27                                     2: $0.235

3: $0.273                                  3: $0.227


Categories
Crypto Market Analysis

Daily Crypto Review, Oct 12 – Crypto Market Consolidating After a Surge: What’s Next?

The cryptocurrency sector has experienced a surge over the weekend as Bitcoin pushed above $11,000. Bitcoin is currently trading for $11,319, representing a decrease of 0.25% on the day. Meanwhile, Ethereum gained 0.09% on the day, while XRP gained 0.32%.

 Daily Crypto Sector Heat Map

Taking a look at the top 100 cryptocurrencies, we can see that Ren gained 27.02% in the past 24 hours, making it the top daily gainer. Monero (9.75%) and Cosmos (7.98%) also did great. On the other hand, Loopring lost 7.99%, making it the most prominent daily loser. It is followed by StorJ’s loss of 6.76% and PumaPay’s loss of 6.54%.

Top 10 24-hour Performers (Click to enlarge)

Bottom 10 24-hour Performers (Click to enlarge)

Bitcoin’s market dominance level has decreased slightly since our last report, with its value currently being 60.66%. This value represents a 0.67% difference to the downside when compared to when we last reported.

Daily Crypto Market Cap Chart

The crypto sector capitalization has gained quite a bit of value over the course of the weekend. Its current value is $358.48 billion, representing an increase of $14.33 billion compared to our previous report.

_______________________________________________________________________

What happened in the past 24 hours?

_______________________________________________________________________

_______________________________________________________________________

Technical analysis

_______________________________________________________________________

Bitcoin

The largest cryptocurrency by market cap has continued its push towards the upside on Friday/Saturday, reaching as high as $11,500. The move has died out since, and Bitcoin is now trading in a narrow range between the $10,300 support level and $10,500 resistance level (61.8% Fib retracement). The volume seems to be dying off, while the RSI is descending, which may indicate a short window where traders shouldn’t expect much volatility, but rather trade within this range. However, Bitcoin cannot stay locked up in such a narrow range for too long and will have to make another move in the short future.


BTC/USD 4-hour Chart

Bitcoin’s technical overview is tilted towards the buy-side overall, but its short-term (4-hour and 1-day) technicals are a bit mixed up, with oscillators questioning the bullishness. However, its long-term outlook is completely bullish

BTC/USD 1-day Technicals

Technical factors (4-hour Chart):
  • Price is above both its 50-period EMA and 21-period EMA
  • Price is near the middle Bollinger band
  • RSI is descending from almost-overbought levels (66.90)
  • Volume is descending
Key levels to the upside          Key levels to the downside

1: $11,500                                 1: $11,300

2: $11,630                                 2: $11,180

3: $12,000                                  3: $11,000

Ethereum

Ethereum’s movement over the weekend was similar to Bitcoin’s, with its price skyrocketing on Friday/Saturday, only to consolidate after the move ended. Ethereum bulls reached exhaustion after the price hit the 38.2% Fib retracement, and started consolidating right below it. Just as with Bitcoin, Ethereum is stuck within a range, bound by $371 to the downside and $378 to the upside.

Ethereum’s flat (and nearly overbought) RSI and descending volume indicate that Ethereum is preparing for a move.

ETH/USD 4-hour Chart

Ethereum’s short-term technicals are somewhat unclear, with its 4-hour overview turning to bullish and 1-day overview still being tilted towards the sell-side quite heavily. On the other hand, its long-term technicals are quite bullish.

ETH/USD 1-day Technicals

Technical Factors (4-hour Chart):
  • The price is above both its 50-period and 21-period EMA
  • The price is near its middle Bollinger band
  • RSI is flat and nearly overbought(66.85)
  • Volume is below average
Key levels to the upside          Key levels to the downside

1: $378                                     1: $371

2: $400                                     2: $360

3: $415                                      3: $334

Ripple

While XRP has also moved over the weekend, its move was not as significant as Bitcoin’s or Ethereum’s move. This is simply because it did not break any recent resistances, but rather got stuck at the same one it couldn’t get past on Oct 6. XRP is now consolidating at around $0.255, and we may possibly see a pullback to the orange ascending line as a retest of this upward-facing trend.

XRP has two possibilities now: it will either push towards $0.266 (less likely) or pull back towards the ascending line (more likely). Traders should keep in mind both of these scenarios when attempting to trade XRP.

XRP/USD 4-hour Chart

XRP’s 4-hour, 1-day, and weekly technicals are practically the same and are all tilted towards the buy-side (with oscillators being more or less neutral), while its monthly overview is heavily tilted towards the sell-side.

XRP/USD 1-day Technicals

Technical factors (4-hour Chart):
  • The price is above its 50-period EMA and at its 21-period EMA
  • Price is at its middle Bollinger band
  • RSI is descending (52.16)
  • Volume is average (descending)
Key levels to the upside          Key levels to the downside

1: $0.266                                   1: $0.2454 

2: $0.27                                     2: $0.235

3: $0.273                                  3: $0.227


Categories
Crypto Market Analysis

BTC/USD Weekly Overview + Possible Outcomes

This is the BTC/USD 1-day timeframe analysis, where we are looking at the most recent events, the current technical formations, as well as discussing possible outcomes.

Overview


Bitcoin has shown some volatility in recent days after bouncing off of the 100-period moving average (black line). The largest cryptocurrency by market cap bounce off of this line as well as the $10,500 level brought a lot of bulls back to the market, causing another price swing upwards. While it was more likely that Bitcoin would push down towards $10,360, the news surrounding it (many accredited and institutional investors putting their funds in the market at this particular moment) outweighed the bearishness caused by the macro events.

Technical factors

Bitcoin has been building a triangle formation for over a month now, and it was a consensus among analysts and traders that the triangle will most likely break towards the downside. However, the most recent push off of the 100-period MA (mostly due to fundamentals rather than technical factors) has proven traders wrong and decided Bitcoin’s short-term future.

The push towards the upside briefly stopped after breaking the uncertainty area, only to consolidate there and create enough pressure for the next move. After this happened, Bitcoin was free to move towards the $11,000 resistance level . At the moment, the pressure created by the bulls is fading, and we may expect a pullback.

Likely Outcomes


Bitcoin has encountered strong resistance at the $11,000 level, which will most likely cause it to back down towards $10,850. With (as we spoke in our numerous analyses) $10,850 level being the pivot pointBitcoin will choose to either back down towards $10,500 or $10,360 before (most likely) rising again, or to bounce from the $10,850 area and push towards $11,000-$11,300. At this moment, the most likely scenario is that Bitcoin will stay above $10,850 for the time being and that its next push will possibly move its price above $11,000, but almost certainly not above $11,300.

If we are talking about straightforwards pushes towards the upside or downside, it would take a great deal of pressure to either side to break its support or resistance levels, sitting at $10,850 and $11,300.

Categories
Crypto Market Analysis

Daily Crypto Review, Oct 9 – Bitcoin Close to $11,000: What’s Next?

The cryptocurrency sector as a whole has experienced a quick push to the upside. Bitcoin is currently trading for $10,839, representing an increase of 2.44% on the day. Meanwhile, Ethereum gained 2.91% on the day, while XRP gained 1.59%.

 Daily Crypto Sector Heat Map

If we look at the top 100 cryptocurrencies, we can see that UMA gained 31.88% in the past 24 hours, making it the most prominent daily gainer. The Midas Touch Gold (25.91%) and SushiSwap (18.59%) also did great. On the other hand, PumaPay lost 12.87%, making it the most prominent daily loser. It is followed by Zuba Token’s loss of 2.87% and Augur’s loss of 2.32%.

Top 10 24-hour Performers (Click to enlarge)

Bottom 10 24-hour Performers (Click to enlarge)

Bitcoin’s market dominance level has stayed at the same place since our last report, with its value currently being at 61.01%. This value represents a 0.05% difference to the upside when compared to when we last reported.

Daily Crypto Market Cap Chart

The crypto sector capitalization has gained quite a bit of value over the course of the past 24 hours. Its current value is $343.72 billion, representing an increase of $10.6 billion compared to our previous report.

_______________________________________________________________________

What happened in the past 24 hours?

_______________________________________________________________________

_______________________________________________________________________

Technical analysis

_______________________________________________________________________

Bitcoin

The largest cryptocurrency by market cap has broken its triangle formation towards the upside after a bounce from the $10,500 support level. The massive bull presence had brought the price just under $11,000 before BTC started to pull back and seek an appropriate level to consolidate at. At the time being, Bitcoin is fighting for $10,850, and staying above, it would be a major precursor to its future possible push towards $11,000-$11,300.

Traders should pay close attention to Bitcoin’s price movement around the $10,850 level, as well as the ascending line (pink), and trade based on how the price reacts to these levels.

BTC/USD 4-hour Chart

Bitcoin’s technical overview has turned bullish overall, with every single time-frame being bullish. While its weekly and monthly overviews were bullish for months now, its daily and 4-hour technicals have turned bullish only after the most recent spike.

BTC/USD 4-hour Technicals

Technical factors (4-hour Chart):
  • Price is above both its 50-period EMA and 21-period EMA
  • Price is near the top Bollinger band
  • RSI is descending from almost-overbought levels (61.39)
  • Volume is descending from above-average
Key levels to the upside          Key levels to the downside

1: $11,000                                 1: $10,850

2: $11,180                                 2: $10,630

3: $11,300                                  3: $10,500

Ethereum

Ethereum has moved towards the upside alongside Bitcoin, but its price movement didn’t do anything as impactful as Bitcoin’s price. While the bounce from the $344 level was significant, it could not reach, let alone pass, the $360 level. Ethereum’s short-term future is certainly within this range, which traders can make use of.

Once again, we will point out an extremely high chance of Ethereum staying between $334 and $360.

ETH/USD 4-hour Chart

Ethereum’s short-term technicals are somewhat unclear, with its 4-hour overview turning to bullish and 1-day overview still being tilted towards the sell-side quite heavily. On the other hand, its long-term technicals are quite bullish.

ETH/USD 4-hour Technicals

Technical Factors (4-hour Chart):
  • The price is above both its 50-period and 21-period EMA
  • The price is near its middle Bollinger band
  • RSI is neutral (54.08)
  • Volume is below average (one-candle spike)
Key levels to the upside          Key levels to the downside

1: $360                                     1: $334

2: $371                                     2: $300

3: $400                                      3: $289

Ripple

XRP has used Bitcoin’s move towards the upside to fuel its own move and established itself above the $0.2454 level. The third-largest cryptocurrency by market cap has bounced off the ascending line (and not the $0.2454 level this time) dating back from Sep 24 and pushed up, reaching as high as $0.253 before ending the move.

Traders should pay attention to any sharp increases in volume, as well as how XRP handles the immediate support and resistance levels. Most analysts are currently quite bullish on XRP, mostly when it comes to 1-hour and 4-hour charts.

XRP/USD 4-hour Chart

XRP 4-hour, daily, and weekly technicals are quite bullish, while its monthly overview is tilted towards the sell-side.

XRP/USD 4-hour Technicals

Technical factors (4-hour Chart):
  • The price is above its 50-period EMA and its 21-period EMA
  • Price is close to its middle Bollinger band
  • RSI is neutral (55.13)
  • Volume is above average
Key levels to the upside          Key levels to the downside

1: $0.266                                   1: $0.2454 

2: $0.27                                     2: $0.235

3: $0.273                                  3: $0.227


Categories
Crypto Guides

Is Tezos The Most Robust Cryptocurrency?

Introduction

Tezos is a decentralized, highly secure, transparent, and smart contract enabled blockchain governed by itself. It is a blockchain network associated with a digital token known as Tez or Tezzie (XTZ). Tezos doesn’t mine Tez. Instead, the token holder is rewarded under the consensus mechanism for participating in the proof-of-stake system.

A digital commonwealth group, sharing common interests and goals, is linked together to govern the Tezos platform. Tezos aims to become the most robust cryptocurrency blockchain by working together with its token holders to build more democratic protocol with the time. 

What is Tezos Attempting to Achieve? 

Tezos team wants to develop the most adaptable cryptocurrency project. It provides a token holder with equal governing power and is trying to avoid a hard fork situation. In which a community splits and starts competing with each other like in Bitcoin cash and Ethereum DAO. Tezos is implementing soft forks in which the community regularly updates the blockchain for constant growth. They are using (DAO) Decentralised Autonomous Organization system where every decision is taken after community discussion. This will make this more self amendable and upgradeable system.  

How Tezos Works? 

Tezos uses a proof of stake algorithm, and it can support 40 transactions/second on the network. It uses the Michelson coding language, which proceeds with formal verification to avoid any bugs in the network. To create error fee smart contracts, they use a mathematically provable code. In this network, the stakers are known as bakers.

To make delegate changes, you need to have 10,000 Tezos tokens and a bond. Most probably to make the system more democratic, Tezos has removed the miners to reduce their control power in the network. It is absorbing good elements from different blockchains to make it self-governing, self-evolving, and adaptable. If you notice anything appealing in any other blockchain, you can propose it to the community that approves the change for the Tezos network. 

Tezos Architecture

The protocol is divided into layers:

Network Protocol  – Here, the peer-to-peer communication is done to broadcast the decisions between the nodes.

Transaction Protocol – Here, the blockchain accounting model is implemented. 

Consensus Protocol – This consensus protocol verifies the agreement to confirm transactions. 

The Tezos Accounts

Implicit Account – It’s the most commonly used account. It has a public key and private key held by the account owner to secure the account balance. 

Originated Account – The formally verified smart contract account with the implicit account is known as an originated account.

Tezos Unique Capabilities

  • Self-amending and on-chain governance
  • Formal verification of smart contracts
  • Liquid proof of stake system 

Is Tezos a Good Investment?

Tezos is the youngest of all existing cryptocurrencies and focused upon the chain governance system. They claim to become a future-proof platform through on-chain governance that attracts a huge number of investors. Thus, Tezos seems to be a good investment. The good news is that most of the popular cryptocurrency investors are getting involved in Tezos. We should also consider that they don’t have a clear road map for the future, but the other dominating cryptocurrencies community is working in a specific direction. To conclude, despite Tezos being one of the most robust cryptos out there, its success or failure depends on active community decisions. 

Categories
Crypto Market Analysis

Daily Crypto Review, Oct 8 – DeFi Bubble Popped: Token Prices Shatter on Low Trading Volumes

The cryptocurrency sector as a whole has experienced a slight decrease as Bitcoin continued to path towards the downside. Bitcoin is currently trading for $10,525, representing a decrease of 0.47% on the day. Meanwhile, Ethereum lost 0.95% on the day, while XRP lost 1.09%.

 Daily Crypto Sector Heat Map

If we look at the top 100 cryptocurrencies, we can see that Ren gained 11.19% in the past 24 hours, making it the most prominent daily gainer. The Midas Touch Gold (9.72%) and PumaPay (7.65%) also did great. On the other hand, Hyperion lost 66.26%, making it the most prominent daily loser. It is followed by yearn.finance’s loss of 13.34% and Kusama’s loss of 11.08%.

Top 10 24-hour Performers (Click to enlarge)

Bottom 10 24-hour Performers (Click to enlarge)

Bitcoin’s market dominance level has stayed at the same place since our last report, with its value currently being at 60.96%. This value represents a 0.1% difference to the upside when compared to when we last reported.

Daily Crypto Market Cap Chart

The crypto sector capitalization has lost a bit of value over the course of the past 24 hours. Its current value is $333.12 billion, representing a decrease of $2.28billion compared to our previous report.

_______________________________________________________________________

What happened in the past 24 hours?

_______________________________________________________________________

While the top cryptocurrencies lost only a fraction of their respective market capitalization value, the DeFi market has deflated drastically. It is estimated that the daily DeFi token trade volumes have dropped by 30% combined, while recent market leaders Sushi, Uniswap, and yearn.finance are among the hardest hit with weekly losses of as much as 51%, 38%, and 31%, respectively. On top of that, the Binance DeFi composite index dropped over 20% yesterday, and 63% from its first trading day in August.

However, this is not the end of DeFi, but rather a small pop of the inflated price bubble. The DeFi market has seen various “whales” accumulating DeFi tokens and using its protocols, which is a great sign that this part of the crypto sector is here to stay.

_______________________________________________________________________

Technical analysis

_______________________________________________________________________

Bitcoin

The largest cryptocurrency by market cap has continued moving down and testing its support levels. This time, Bitcoin tested the $10,500 level, which held up nicely (for now). While the immediate sentiment is certainly bearish, there isn’t enough volume to test and break the  $10,360 level, which is crucial for the future price development of Bitcoin.

While short-term traders are mostly tilted towards the sell-side due to both macroeconomic events and technical analysis, investors are quite bullish on Bitcoin simply due to how the largest cryptocurrency develops in terms of usability, adoption, and other fundamental concepts.

BTC/USD 4-hour Chart

Bitcoin’s technical overview follows what we previously said, with short-term technicals being bearish, while the longer-term ones are bullish. Its 4-hour and 1-day overview tilting towards the downside, while its longer-term technicals have remained bullish.

BTC/USD 4-hour Technicals

Technical factors (4-hour Chart):
  • Price is below both its 50-period EMA and 21-period EMA
  • Price is near the bottom Bollinger band
  • RSI is neutral (42.08)
  • Volume is average
Key levels to the upside          Key levels to the downside

1: $10,630                                 1: $10,500

2: $10,850                                 2: $10,360

3: $11,000                                  3: $10,015

Ethereum

Ethereum was moving towards the downside throughout the day, testing its $334 support level once again. Trading volume faded as Ethereum couldn’t break this support, therefore staying above $334. On top of that, the near-oversold RSI oscillator shows that the move might be over for the time being.

As we mentioned many times now, traders should be careful and pay attention to any increase in volume, but should ultimately try to trade Ethereum’s movements between $334 and $360.

ETH/USD 4-hour Chart

Ethereum’s short-term and long-term technical overviews both look very similar to Bitcoin’s. While its short-term technicals (4-hour and 1-day) are heavily tilted towards the sell-side, its weekly and monthly outlooks are still quite bullish (though the bearish sentiment in short-term technicals is stronger than with Bitcoin, while the bullishness of its long-term overviews is weaker than with Bitcoin).

ETH/USD 4-hour Technicals

Technical Factors (4-hour Chart):
  • The price is below both its 50-period and 21-period EMA
  • The price is at its lower Bollinger band
  • RSI is neutral (37.59)
  • Volume is descending
Key levels to the upside          Key levels to the downside

1: $360                                     1: $334

2: $371                                     2: $300

3: $400                                      3: $289

Ripple

XRP did not differ much from the aforementioned two cryptocurrencies, and pushed towards the downside itself as well. The third-largest cryptocurrency by market cap has broken the $0.2454 level to the downside and entered the “safe zone” between $0.235 and $0.2454. However, the fight for $0.2454 is not over yet, and XRP still has a chance to regain this high, even though it is highly unlikely at this point.

XRP will most likely stay below $0.2454, and traders can use that to their advantage when trading as they could trade XRP’s sideways movements.

XRP/USD 4-hour Chart

XRP 4-hour overview is tilted towards the sell-side, while its daily and weekly overviews are completely bullish. However, its monthly overview is just as bearish as the 4-hour one, showing signs of pre-established bearish sentiment.

XRP/USD 4-hour Technicals

Technical factors (4-hour Chart):
  • The price is at its 50-period EMA and below its 21-period EMA
  • Price is close to its bottom Bollinger band
  • RSI is neutral (46.60)
  • Volume is average
Key levels to the upside          Key levels to the downside

1: $0.266                                   1: $0.2454 

2: $0.27                                     2: $0.235

3: $0.273                                  3: $0.227


Categories
Crypto Market Analysis

Daily Crypto Review, Oct 7 – Crypto Sector Falls As Trump Rejects Stimulus Proposal

The cryptocurrency sector has declined slightly as Bitcoin returned to the level it was on Monday. Bitcoin is currently trading for $10,591, representing a decrease of 0.88% on the day. Meanwhile, Ethereum lost 3.04% on the day, while XRP lost 3.26%.

 Daily Crypto Sector Heat Map

If we look at the top 100 cryptocurrencies, we can see that PumaPay gained 6.93% in the past 24 hours, making it the most prominent daily gainer. EOS (5.08%) and Ethereum Classic (2.6%) also did great. On the other hand, Elrond lost 17.09%, making it the most prominent daily loser. It is followed by Ocean Protocol’s loss of 15.55% and Aave’s loss of 15.24%.

Top 10 24-hour Performers (Click to enlarge)

Bottom 10 24-hour Performers (Click to enlarge)

Bitcoin’s market dominance level has increased slightly since our last report, with its value currently being at 60.95%. This value represents a 0.49% difference to the upside when compared to when we last reported.

Daily Crypto Market Cap Chart

The crypto sector capitalization has lost quite a bit of value over the course of the past 24 hours. Its current value is $335.30 billion, representing a decrease of $7.1 billion compared to our previous report.

_______________________________________________________________________

What happened in the past 24 hours?

_______________________________________________________________________

_______________________________________________________________________

Technical analysis

_______________________________________________________________________

Bitcoin

The largest cryptocurrency by market cap has spent a day declining in price slightly, with many analysts speculating that it was because of US President Donald Trump’s tweet on his rejection of the most recent stimulus proposal. Analysts that are less concerned about fundamentals saw a potential death cross as well as Bitcoin not being able to confidently pass the ascending trend (pink line), ultimately causing a small crash.

For the time being, Bitcoin will remain range-bound by the $10,360 level to the downside and $10,850 level to the upside as main support and resistance levels.

BTC/USD 4-hour Chart

Bitcoin’s short-term technicals have turned more bullish than yesterday, with both its 4-hour and 1-day overview tilting towards the downside. However, its longer-term technicals have remained bullish.

BTC/USD 4-hour Technicals

Technical factors (4-hour Chart):
  • Price is below both its 50-period EMA and 21-period EMA
  • Price is slightly below its middle Bollinger band
  • RSI is ascending (46.96)
  • Volume is average (after the one-candle spike)
Key levels to the upside          Key levels to the downside

1: $10,630                                 1: $10,500

2: $10,850                                 2: $10,360

3: $11,000                                  3: $10,015

Ethereum

Ethereum was trading on increased volume in the past 24 hours, with the volume starting to ramp up as the second-largest cryptocurrency by market cap was unable to break the top Bollinger Band line. This caused a slight crash, which pulled back Ether to its support level of $334, which held up quite nicely.

As we mentioned many times now, traders should pay attention to any increase in volume, but should ultimately trade Ethereum’s movements between $334 and $360.

ETH/USD 4-hour Chart

Ethereum’s short-term and long-term technical outlook looks very similar to Bitcoin’s. Its short term technicals (4-hour and 1-day) are heavily tilted towards the sell-side, while its weekly and monthly outlooks are still quite bullish.

ETH/USD 4-hour Technicals

Technical Factors (4-hour Chart):
  • The price is below both its 50-period and 21-period EMA
  • The price is at its lower Bollinger band
  • RSI is neutral (40.44)
  • Volume is above average
Key levels to the upside          Key levels to the downside

1: $360                                     1: $334

2: $371                                     2: $300

3: $400                                      3: $289

Ripple

XRP had a pullback day, where its price tried to find equilibrium after two days of pushing towards the upside. The third-largest cryptocurrency by market cap traded on increased volume, which indicated that the pullback would be more severe. The price has reached the $0.2454 support level and briefly fell under it as well. It is yet uncertain whether XRP has finished its pullback phase and remained above $0.2454, or if the fight for this level still continues.

XRP/USD 4-hour Chart

XRP 4-hour, daily, and weekly technicals are now tilted towards the buy-side, while its monthly outlook remains tilted towards the sell-side.

XRP/USD 4-hour Technicals

Technical factors (4-hour Chart):
  • The price is above its 50-period EMA and right at its 21-period EMA
  • Price is at its middle Bollinger band
  • RSI is neutral (51.12)
  • Volume is above average
Key levels to the upside          Key levels to the downside

1: $0.266                                   1: $0.2454 

2: $0.27                                     2: $0.235

3: $0.273                                  3: $0.227


Categories
Crypto Market Analysis

Daily Crypto Review, Oct 6 – XRP Gains Over 10% As It Announces The Launch Of A New Crypto Exchange

The cryptocurrency sector has had a slow and steady day of mostly slight price increases. Bitcoin is currently trading for $10,707, representing an increase of 1.03% on the day. Meanwhile, Ethereum gained 0.7% on the day, while XRP gained 3.18%.

 Daily Crypto Sector Heat Map

If we look at the top 100 cryptocurrencies, we can see that the privacy coin sector did really well today. Zcash gained 6.86% on the day, making it the most prominent daily gainer. Monero (5.7%) and Quant (3.5%) also did great. On the other hand, PumaPay lost an astonishing 85.58%, making it the most prominent daily loser. It is followed by Uniswap’s loss of 14.37% and Synthetix Network Token’s loss of 11.59%.

Top 10 24-hour Performers (Click to enlarge)

Bottom 10 24-hour Performers (Click to enlarge)

Bitcoin’s level of market dominance has increased slightly since our last report, with its value currently being at 60.46%. This value represents a 0.16% difference to the upside when compared to when we last reported.

Daily Crypto Market Cap Chart

The crypto sector capitalization has gained value over the course of the past 24 hours. Its current value is $342.40 billion, which represents an increase of $1.16 billion when compared to our previous report.

_______________________________________________________________________

What happened in the past 24 hours?

_______________________________________________________________________

_______________________________________________________________________

Technical analysis

_______________________________________________________________________

Bitcoin

The largest cryptocurrency by market cap has spent another day by slowly gaining in value. The bulls were patient as Bitcoin approached the ascending trend line, ultimately passing it. Bitcoin’s short-term future will be decided by how he manages the $10,850 level. If the level gets tackled and Bitcoin stays above it confidently, we can expect a push towards $11,000-$11,300, or even higher. However, if that level doesn’t hold up, Bitcoin will return to the $10,360 level. Traders should pay attention to any spikes in volume.


BTC/USD 4-hour Chart

Bitcoin’s short-term technicals are a bit less bullish today, as the majority of the oscillators are neutral/bearish. However, its longer-term technicals have remained completely bullish.

BTC/USD 4-hour Technicals

Technical factors (4-hour Chart):
  • Price is above its 50-period EMA and its 21-period EMA
  • Price is slightly below its top Bollinger band
  • RSI is ascending (60.09)
  • Volume is below average
Key levels to the upside          Key levels to the downside

1: $10,630                                 1: $10,500

2: $10,850                                 2: $10,360

3: $11,000                                  3: $10,015

Ethereum

Ethereum’s price is slowly rising ever since the drop on Oct 2. However, the volume is slowly descending, turning Ethereum’s moves more and more dull. We may expect more slow and sideways movement until the volume picks up the pace.

Traders should pay attention to any increase in volume, as well as to Ethereum’s movement between $334 and $360.

ETH/USD 4-hour Chart

Ethereum’s 4-hour outlook has changed to full-out bullish, while its 1-day overview remains tilted towards the sell-side. On the other hand, its long-term overview seems extremely bullish, as its weekly or monthly technicals are both tilted towards the buy-side.

ETH/USD 4-hour Technicals

Technical Factors (4-hour Chart):
  • The price is above both its 50-period and 21-period EMA
  • The price is slightly above its middle Bollinger band
  • RSI is neutral (52.71)
  • Volume is below average
Key levels to the upside          Key levels to the downside

1: $360                                     1: $334

2: $371                                     2: $300

3: $400                                      3: $289

Ripple

XRP has had another amazing day, where its price moved further towards the upside and reached as high as $0.26. If the price manages to stay at this level, its next resistance will be found at the $0.266 level. However, a pullback is expected, where the area between $0.2454 and $0.251 has strong support.

It seems that the bulls have gathered around XRP on news of the company launching a cryptocurrency exchange on top of the XRP ledger, as well as because of the fact that XRP is very close to reaching a golden cross (50-period moving average crossing the 200-period moving average to the upside).

XRP/USD 4-hour Chart

XRP technicals are now tilted towards the buy-side, with the exception of its monthly outlook, which remains bearish.

XRP/USD 4-hour Technicals

Technical factors (4-hour Chart):
  • The price is well-above both its 50-period EMA and its 21-period EMA
  • Price is at its top Bollinger band
  • RSI is overbought (70.16)
  • Volume is above average
Key levels to the upside          Key levels to the downside

1: $0.266                                   1: $0.2454 

2: $0.27                                     2: $0.235

3: $0.273                                  3: $0.227


Categories
Crypto Market Analysis

Daily Crypto Review, Oct 5 – XRP Skyrockets and Gains Over 9%; Uniswap’s Volume Trumps Coinbase

The cryptocurrency sector is experiencing a slow but steady increase in price as Bitcoin is moving towards the upside after the $10,360 low it hit on Oct 2. Bitcoin is currently trading for $10,613, representing an increase of 0.53% on the day. Meanwhile, Ethereum gained 0.48% on the day, while XRP gained 5.79%.

 Daily Crypto Sector Heat Map

If we look at the top 100 cryptocurrencies as well as their gains and losses, Zilliqa gained 10.87% on the day, making it the most prominent daily gainer. Celsius (8.47%) and XRP (6.45%) also did great. On the other hand, SushiSwap Token lost 9.94%, making it the most prominent daily loser. It is followed by UMA’s loss of 8.93% and Bitcoin Gold’s loss of 8.64%.

Top 10 24-hour Performers (Click to enlarge)

Bottom 10 24-hour Performers (Click to enlarge)

Bitcoin’s level of market dominance stayed at the same spot since our last report, with its value currently being at 60.30%. This value represents a 0.07% difference to the downside when compared to when we last reported.

Daily Crypto Market Cap Chart

The crypto sector capitalization has gained value over the course of the weekend. Its current value is $341.26 billion, which represents an increase of $5.80 billion when compared to our previous report.

_______________________________________________________________________

What happened in the past 24 hours?

_______________________________________________________________________

_______________________________________________________________________

Technical analysis

_______________________________________________________________________

Bitcoin

The largest cryptocurrency by market cap has dropped in price due to the fundamentals, such as the US President Donald Trump being ill from COVID-19 as well as one of the largest trading platforms, BitMEX, being charged by the CFTC and the DOJ. However, the drop was only strong enough to push BTC to the $10,360 level, not below it. This is an extremely bullish sign as this support holding is key to the future development of Bitcoin.

Ever since then, Bitcoin has been slowly and steadily gaining in value but is being checked by the ascending trend line (pink). Traders should watch how BTC handles the trend line and if it surpasses it or keeps bouncing off of it.

BTC/USD 4-hour Chart

Bitcoin’s short-term technicals have changed to bullish over the weekend. Its longer-term technicals, however, have remained completely bullish, except for the daily outlook, which is just slightly more neutral.

BTC/USD 4-hour Technicals

Technical factors (4-hour Chart):
  • Price is above its 50-period EMA and its 21-period EMA
  • Price is at its top Bollinger band
  • RSI is ascending (56.69)
  • Volume is below average
Key levels to the upside          Key levels to the downside

1: $10,630                                 1: $10,500

2: $10,850                                 2: $10,360

3: $11,000                                  3: $10,015

Ethereum

Ethereum’s price has acted similar to Bitcoin’s movements, with Ether plummeting on Oct 2 and dropping to the $334 support level. However, bulls have taken over the market, and Ethereum has been slowly rising in the past couple of days. The prediction that options traders made regarding Ether trading below $360 and above $340 during October is still valid, and even more likely.

Traders should pay attention to any increase in volume, as that will spark the next move. The current volume is unable to bring any volatility to Ethereum.

ETH/USD 4-hour Chart

Ethereum’s 4-hour outlook has changed to slightly bullish, while its 1-day overview remains tilted towards the sell-side. However, its long-term overview seems extremely bullish, as its weekly or monthly technicals are both heavily tilted towards the buy-side.

ETH/USD 4-hour Technicals

Technical Factors (4-hour Chart):
  • The price is right below its 50-period and right above its 21-period EMA
  • The price is slightly above its middle Bollinger band
  • RSI is neutral (50.85)
  • Volume is below average
Key levels to the upside          Key levels to the downside

1: $360                                     1: $334

2: $371                                     2: $300

3: $400                                      3: $289

Ripple

XRP has had an amazing day and even managed to get in the top3 daily gainers section. The third-largest cryptocurrency by market capitalization started off the weekend with its price dropping and hitting $0.228. However, the price quickly recovered and hovered below the $0.235 level until it finally broke. The push towards the upside was strong and with high volume, which helped XRP reach as high as $0.254.

XRP is now trying to consolidate above the $0.2454 level, which traders should pay attention to. An additional spark of volatility might be good for trading, regardless of XRP’s direction.

XRP/USD 4-hour Chart

XRP technicals are now quite uniformed and bullish, with both short-term and long-term technicals being completely tilted towards the buy-side. However, its monthly outlook still remains bearish.

XRP/USD 4-hour Technicals

Technical factors (4-hour Chart):
  • The price is above both its 50-period EMA and its 21-period EMA
  • Price is at its top Bollinger band
  • RSI is heading towards the oversold territory (67.36)
  • Volume is above average
Key levels to the upside          Key levels to the downside

1: $0.2454                                 1: $0.235 

2: $0.266                                   2: $0.227

3: $0.27                                    3: $0.221


Categories
Crypto Market Analysis

Daily Crypto Review, Oct 2 – Trump Tests Positive for COVID-19; Crypto and Stocks Negatively Affected

The cryptocurrency sector has failed to confidently push towards new highs, which triggered a pullback. On top of that, the current macroeconomic situation has pushed both cryptocurrencies and stocks towards the downside. Bitcoin is currently trading for $10,476, representing a decrease of 2.82% on the day. Meanwhile, Ethereum lost 5.09% on the day, while XRP lost 3.7%.

 Daily Crypto Sector Heat Map

If we look at the top100 cryptocurrencies as well as their gains and losses, Bitcoin Gold gained 4.88% on the day, making it the most prominent daily gainer. Balancer (3.92%) and Celsius (3.43%) also did great. On the other hand, Energy Web Token lost 16.88%, making it the most prominent daily loser. It is followed by Arweave’s loss of 16.61% and yearn. finance’s loss of 14.45%.

Top 10 24-hour Performers (Click to enlarge)

Bottom 10 24-hour Performers (Click to enlarge)

Bitcoin’s level of market dominance stayed at the same spot since our last report, with its value currently being at 60.37%. This value represents a 0.11% difference to the downside when compared to when we last reported.

Daily Crypto Market Cap Chart

The crypto sector capitalization has lost value over the course of the past 24 hours. Its current value is $336.45 billion, which represents a decrease of $7.99billion when compared to our previous report.

_______________________________________________________________________

What happened in the past 24 hours?

_______________________________________________________________________

_______________________________________________________________________

Technical analysis

_______________________________________________________________________

Bitcoin

The largest cryptocurrency by market cap failed to break the 38.2% Fib retracement level, causing a pullback, which (as we mentioned in our previous article) brought its price to the $10,360 range. The pullback happened over the course of a few hours, and first tested the ascending (pink) resistance level, which got confirmed, triggering another push towards the downside.

Even though Bitcoin’s price went down slightly, the good news is that the $10,360 range has not been breached. If Bitcoin, on the other hand, breaks this level to the downside, we may expect a strong push towards the downside.

BTC/USD 4-hour Chart

Bitcoin’s short-term technicals remained tilted towards the sell-side ever since Bitcoin confirmed its position below the 38.2% Fib retracement. Its daily overview has become a bit more bearish as well, while its weekly and monthly overviews are extremely bullish.

BTC/USD 4-hour Technicals

Technical factors (4-hour Chart):
  • Price is below its 50-period EMA and its 21-period EMA
  • Price is below its lower Bollinger band
  • RSI is pushing towards oversold(37.02)
  • Volume is average (with a couple of spike candles)
Key levels to the upside          Key levels to the downside

1: $10,630                                 1: $10,500

2: $10,850                                 2: $10,360

3: $11,000                                  3: $10,015

Ethereum

Ethereum’s price movement has lost its structure ever since it broke the higher high/higher low pattern it has created. The second-largest cryptocurrency by market cap pushed towards the $371 resistance level, but failed to break it, causing a strong pullback which first tested $360, and then went all the way down to $340 as $360 failed to hold.

ETH/USD 4-hour Chart

While Ethereum’s 4-hour and 1-day technicals are now tilted towards the sell-side, its long-term overview seems extremely bullish. Its weekly or monthly technicals are both heavily tilted towards the buy-side.

ETH/USD 4-hour Technicals

Technical Factors (4-hour Chart):
  • The price right below its 50-period and its 21-period EMA
  • The price is below its lower Bollinger band
  • RSI is heading towards the oversold territory (36.74)
  • Volume is average with a couple of spike candles
Key levels to the upside          Key levels to the downside

1: $360                                     1: $340

2: $371                                     2: $300

3: $400                                      3: $289

Ripple

XRP’s trading in the upper part of the range-bound by $0.235 and $0.2454 got interrupted by the market tumbling, pushing its price down towards $0.235 as well. While the $0.235 level was passed in the most recent push towards the downside, it is still unsure whether the price will stabilize above or below it. Traders should be very careful and should either try “riding the wave” if XRP starts to drop, or they should wait until the picture becomes a bit more clear.

XRP/USD 4-hour Chart

XRP technicals are now quite uniformed, with both short-term and long-term technicals being bearish. However, its weekly outlook shows a slight tint of bullishness.

XRP/USD 4-hour Technicals

Technical factors (4-hour Chart):
  • The price is below both its 50-period EMA and its 21-period EMA
  • Price is slightly below its lower Bollinger band
  • RSI is heading towards the oversold territory (37.47)
  • Volume is average (with a couple of spike candles)
Key levels to the upside          Key levels to the downside

1: $0.2454                                 1: $0.235 

2: $0.266                                   2: $0.227

3: $0.27                                    3: $0.221


Categories
Crypto Market Analysis

Daily Crypto Review, Oct 1 – Bitcoin Fighting for $10,850; Ethereum Bulls Rallying Against All Odds

The cryptocurrency sector ended up the day in the green, with most cryptocurrencies rallying towards the upside. Bitcoin is currently trading for $10,796, representing an increase of 1.28% on the day. Meanwhile, Ethereum gained 2.46% on the day, while XRP gained 1.15%.

 Daily Crypto Sector Heat Map

If we look at the top100 cryptocurrencies and their gains and losses, DigiByte gained 19.31% in the past 24 hours, making it the most prominent daily gainer. Ren (17.14%) and Maker (15.03%) also did great. On the other hand, The Midas Touch Gold lost 12.25%, making it the most prominent daily loser. It is followed by Energy Web Token’s loss of 7.37% and Hyperion’s loss of 5.71%.

Top 10 24-hour Performers (Click to enlarge)

Bottom 10 24-hour Performers (Click to enlarge)

Bitcoin’s level of market dominance decreased slightly since our last report, with its value currently being at 60.05%. This value represents a 0.43% difference to the downside when compared to when we last reported.

Daily Crypto Market Cap Chart

The crypto sector capitalization has gained in value over the course of the past 24 hours. Its current value is $349.36 billion, which represents an increase of $4.95 billion when compared to our previous report.

_______________________________________________________________________

What happened in the past 24 hours?

_______________________________________________________________________

_______________________________________________________________________

Technical analysis

_______________________________________________________________________

Bitcoin

Bitcoin’s 1-day chart shows that slight bullish sentiment took over after Bitcoin broke the triangle formation to the upside, pushing its price towards the 38.2% Fib retracement, which has proven as a resistance area. It is key for Bitcoin to confidently establish its price above this level if it wants to tackle $11,000 any time soon. However, if this does not happen, we may expect pullbacks to the $10,360 area.

BTC/USD 1-day Chart

If we zoom in to the 4-hour chart, we can see that the bulls are desperately trying to break the $10,850 level (38.2% Fib retracement), but to no avail. If the level does fall, however, we expect it to be on increased volume. Also, if that happens, the push will probably be extended, and traders can catch a lucrative trade on the way down while Bitcoin pulls back.

BTC/USD 4-hour Chart

Bitcoin’s technicals are showing strength all-around, with both shorter and longer time-frames showing bullish sentiment. This may be an indicator of Bitcoin’s current strength and a possible push past $10,850.

BTC/USD 4-hour Technicals

Technical factors (4-hour Chart):
  • Price is slightly above both its 50-period EMA and its 21-period EMA
  • Price is right above its middle Bollinger band
  • RSI is neutral (56.31)
  • Volume is average
Key levels to the upside          Key levels to the downside

1: $10,850                                 1: $10,630

2: $11,000                                 2: $10,500

3: $11,090                                  3: $10,015

Ethereum

Ethereum has shown some strength in the past 24 hours. Its price pattern of making higher highs and higher lows has been interrupted by a lower high and a lower low the past day. On the other hand, its current price movement seems to ignore this bearish sign and is pushing higher towards the $371 level. It seems that, however, $371 will not be reached as the volume is descending and showing a lack of interest in any volatility from both bulls and bears.

When it comes to any form of price direction prediction, traders are torn between putting Ethereum’s current movement in an ascending trend and calling for a rally towards the upside, or calling the most recent lower high/lower low combo a break of the ascending trend, and calling for a push towards the downside.

ETH/USD 4-hour Chart

Both Ethereum’s short-term and long-term technical overviews are tilted towards the buy-side. While its longer-term technicals were always bullish, its 4-hour and 1-day overviews changed from bearish to bullish since we last reported, indicating that the bullish traders might be in the right when it comes to Ethereum’s next move.

ETH/USD 4-hour Technicals

Technical Factors (4-hour Chart):
  • The price is above both its 50-period and its 21-period EMA
  • The price is above its middle Bollinger band
  • RSI is pushing towards the overbought area (59.99)
  • Volume is below average
Key levels to the upside          Key levels to the downside

1: $360                                     1: $340

2: $371                                     2: $300

3: $400                                      3: $289

Ripple

XRP has been trading sideways near its $0.2454 resistance level and tried to break it several times. However, each time failed, and the cryptocurrency had to pull back towards the middle of the range and prepare for its next move. XRP’s low volume and low volatility may be confirming that it is just preparing for the next big move, but the direction is currently unknown. If it rallies towards the upside, traders can either join the extended leg up or trade the pullback. If the price moves down, traders can either trade a bounce off of the $0.235 or wait for a possible break of this support level.

XRP/USD 4-hour Chart

XRP technicals are seemingly always the most interesting and confusing. When it comes to short time-frames, the 4-hour outlook is mixed (but tilted slightly towards the buy-side), while the daily outlook is slightly bearish. Its weekly outlook is back to bullish, while its monthly technicals show bearish sentiment.

XRP/USD 4-hour Technicals

Technical factors (4-hour Chart):
  • The price is slightly above both its 50-period EMA and its 21-period EMA
  • Price is at its middle Bollinger band
  • RSI is neutral (51.39)
  • Volume is stable, and average
Key levels to the upside          Key levels to the downside

1: $0.2454                                 1: $0.235 

2: $0.266                                   2: $0.227

3: $0.27                                    3: $0.221


Categories
Crypto Guides

A Brief Guide to PancakeSwap – A Food Themed DeFi Protocol

Introduction

PancakeSwap is a food-themed new DeFi protocol. It is a cryptocurrency platform for direct exchange under the Binance Smart Chain (BSC). It has introduced many food-based farming associates in the crypto industry. Pancake allows community governance and investors to earn tokens by serving as a liquidity provider under the staking mechanism.

The whole protocol is executed on the Ethereum blockchain because it supports blockchain smart contracts, and it has huge community support who are continuously putting efforts to build decentralized applications. Pancake DeFi exchange allows swapping of BEP20 tokens. If you are familiar with SushiSwap, then you can easily grasp the PancakeSwap concept because both of them have the same incredible design. 

The PancakeSwap Exchange

The exchange platform works on an Automated Market Maker Model(AMM). In this model, the investor can trade with his digital assets and can invest in the liquidity pool. In these pools, users deposit funds and, in return, get Liquidity Provider tokens. With these earned tokens, they can reclaim their share from the trading commission. In PancakeSwap, the LP tokens are known as FLIP tokens. 

Staking Chain

In PancakeSwap, you are allowed to trade with a secondary token known as CAKE. On the farm, if you stake your LP tokens and lock them for the further process, then you will get CAKE in reward. You can deposit these different LP tokens listed below:

  1. CAKE-BNB FLIP
  2. BUSD-BNB FLIP
  3. ADA-BNB FLIP
  4. BAND_BNB FLIP
  5. DOT-BNB FLIP
  6. EOS-BNB FLIP
  7. LINK-BNB FLIP
  8. BAKE-BNB Bakery LP
  9. BURGER-BNB FLIP

There is one more token in this protocol known as SYRUP. If you have deposited funds to get LP tokens and have used these tokens to receive CAKE. Further, you can stake this CAKE token to earn a SYRUP token, which would provide you with governance functionality. 

Adding Liquidity

To access all the features of PancakeSwap, you need to unlock your crypto wallet. With this wallet, you can interact Binance smart chain based on Ethereum web applications. 

The BEP20 tokens movement will require your approval. You simply have to fix the amount you want to keep on stake, and you need to confirm the transaction. Then you can check the CAKE you have earned, and you can withdraw the amount anytime you want with the harvest option. To earn SYRUP, you have to keep your CAKE on the stake with the ‘Approve Cake’ option. Once you have staked your CAKE, you will get back an equal amount of SYRUP and can earn CAKE passively. 

Conclusion 

The Google of crypto – Binance jumped in Defi by introducing a new food protocol – PancakeSwap. PancakeSwap is launched by BSC, which is supported by a centralized exchange. It includes AMM, DEX, farms, and native token-CAKE. There are nine liquidity pools where you can deposit your funds. 25% of CAKE commission share is distributed to the SYRUP token holders. The anonymous developer team behind the PancakeSwap has warned that the smart contract is still unaudited and has high inherent risk. The fund invested in smart contracts always has a risk of bugs so, never deposit the amount if you can’t afford its loss. 

Categories
Crypto Videos

The Craze Behind DeFi – Explained!


The Craze Behind DeFi – Explained

There are many reasons that the DeFi sector has been experiencing a surge of interest lately.
First off, we need to mention that the regulators have been behind the curve in terms of DeFi, which has been able to flourish in this vacuum. As an example, in traditional unsecured lending, a legal requirement that lenders and borrowers know one another’s identities exists. On top of that, the lender always assesses the borrower’s ability to repay their debt. In DeFi, on the other hand, there are no such requirements. Instead, every part of the process is about mutual trust and preserving privacy.

Regulators always have to weigh the delicate balance between deterring innovation and failing to protect society from risks. In July, the US SEC made a major shift towards embracing decentralized finance by approving an Ethereum-based fund called Arca.
This is welcome and extremely important since one of the major challenges with financial innovation is the hostile environment that is created by archaic regulations. This had caused many cryptos and DeFi projects to fail, including major ones such as Basis, which returned $133 million to investors back in 2018 when it concluded that it couldn’t work within the SEC rules.


The second reason for the DeFi craze is that mainstream players are not-so-slowly and surely getting involved. Many financial institutions are beginning to accept DeFi, as well as seeking ways to participate. Seventy-five of the world’s biggest banks are now trialing blockchain technology to speed up their payment system as part of the Interbank Information Network, led by JP Morgan, Royal Bank of Canada, and ANZ. Even though most of these banks are testing centralized versions of blockchain, this is one step closer to DeFi than the current system.
Major asset management funds are starting to get interested in DeFi seriously as well, with the most prominent one being Grayscale, the world’s largest crypto investment fund.

The third reason for the craze is the effect of COVID-19. The pandemic has evidently driven global interest rates even lower, with some jurisdictions, such as the eurozone, now offering negative interest rates.
DeFi potentially offers much higher returns on investment to savers than high-street institutions. As an example, Compound has been offering an annualized interest rate of 6.75% for people that save with stablecoin Tether. Not only do you get the interest, but you also receive Comp tokens, which adds to the attraction of this offer. With as much as two-thirds of people without bank accounts having a smartphone, DeFi also has the potential to offer its services to the so-called unbanked.

One final reason for the surge in people putting money into DeFi projects is FOMO – fear of missing out. Many tokens are worth nothing or very close to nothing in terms of their utility, so we see a lot of irrational investment and pure speculation. But, people see certain tokens rise in value exponentially and want to turn their life around as well.
Like it or not, we are certainly heading towards a new financial system that will be more liberalized and decentralized than before, and DeFi will be at the forefront of these changes.

Categories
Crypto Videos

What Is DeFi – Beginners Edition!


What Is DeFi –Beginners Edition

One area in cryptocurrencies that have recently attracted huge attention is certainly DeFi or decentralized finance. DeFi refers to financial services using smart contracts, automated enforceable agreements that work without intermediaries like banks or lawyers. Instead, they use online blockchain technology.
Between September 2017 and now, the total value locked up in DeFi contracts managed to go from $2.1 million to over $7 billion. The hype it has gotten in the past couple of months has risen over $3 billion.

This has, in turn, driven a massive rise in the valuation of all the tradable tokens that are using DeFi smart contracts. The total market cap of DeFi projects now exceeds $15 billion, almost doubling the value it had in July. Numerous tokens have exploded in value this year. For example, Synthetix Network Token has increased its valuation by more than 20-fold, while Aave did an almost 200-fold increase. So if you had bought $1,000 worth of Aave tokens in August 2019, your position would now be worth nearly $200,000.

So why is DeFi so disruptive, and what does it bring to the table?

DeFi projects are mostly built on the Ethereum blockchain network. They are the next step in the financial technology revolution that began 11 years ago with Bitcoin. One area in which these decentralized applications have taken off is cryptocurrency trading on DEX’s (short for decentralized exchanges) such as Uniswap. These exchanges are entirely peer-to-peer, without any person, company, or other institution behind the platform.
Other DeFi services allow you to:
Borrow and lend cryptocurrencies in order to earn interest using platforms such as Aave or Compound Bet on the outcome of certain events using Augur Create and exchange real-world asset derivatives such as currencies or precious metals on platforms such as Synthetix.
Buy stablecoins, a type of cryptocurrencies that are pegged to the value of a particular currency or commodity.

DeFi is often called “Lego money” because you can stack decentralized applications together to maximize your returns. As an example, you could buy a stablecoin such as DAI and then lend it on the Compound platform to earn interest.
Though many of today’s decentralized applications are niche, future applications could have a massive impact on everyone’s day-to-day life. As an example, you will probably be able to purchase a house or a piece of land through a DeFi platform under a mortgage smart-contract whereby you repay the price over a certain number of years.

The deeds would be tokenized on a blockchain ledger as collateral, and they would shift to the lender automatically in the event of you defaulting on your repayments. Because no lawyers or banks would be required in the process, it could make the whole process of buying and selling houses cheaper, smoother, and easier.

To learn more on how DeFi works, check out our next video where we will talk about the current DeFi craze and how it came to be.


Categories
Crypto Market Analysis

Daily Crypto Review, Sept 30 – Goldman Sachs Entering the Crypto Sector; Bitcoin Prepares for a Move

The cryptocurrency sector has stayed at virtually the same spot since our last report. Bitcoin is currently trading for $10,688, representing a decrease of 0.07% on the day. Meanwhile, Ethereum gained 0.18% on the day, while XRP lost 0.95%.

 Daily Crypto Sector Heat Map

If we look at the top100 cryptocurrencies and their gains and losses, The Midas Touch Gold gained 21.5% on the day, making it the most prominent daily gainer. Zilliqa (14.64%) and Energy Web Token (11.71%) also did great. On the other hand, DeFi projects took a hit as UMA lost 10.9%, making it the most prominent daily loser. It is followed by yearn.finance’s loss of 7.8% and OMG Network’s loss of 6.4%.

Top 10 24-hour Performers (Click to enlarge)

Bottom 10 24-hour Performers (Click to enlarge)

Bitcoin’s level of market dominance stayed at the same spot since our last report, with its value currently being at 60.48%. This value represents a 0.02% difference to the upside when compared to when we last reported.

Daily Crypto Market Cap Chart

The crypto sector capitalization has gained in value over the course of the past 24 hours. Its current value is $344.44 billion, which represents an increase of $0.55 billion when compared to our previous report.

_______________________________________________________________________

What happened in the past 24 hours?

_______________________________________________________________________

_______________________________________________________________________

Technical analysis

_______________________________________________________________________

Bitcoin

While it seems that Bitcoin is having quite a slow day, that is not exactly the case. Even though its price has not changed much since our last report, the largest cryptocurrency by market cap is fighting to stay above the triangle formation it has recently passed. If it manages to confirm its position above the triangle (and then 38.2% Fib retracement level), Bitcoin will set itself up to rush towards (and past) $11,000.

BTC/USD 1-day Chart

If we zoom in to the 4-hour chart, we can see that Bitcoin is right on the verge of going back under is level, but has held up nicely so far. Trading is quite simple at the moment, as Bitcoin is not making any sudden moves either towards the upside or downside.

BTC/USD 4-hour Chart

Bitcoin’s short-term technicals are tilted towards the sell-side and will be tilted in that direction until Bitcoin confirms its position above the 38.2% Fib retracement. However, its daily overview is slightly bullish, while its weekly and monthly overviews are extremely bullish.

BTC/USD 4-hour Technicals

Technical factors (4-hour Chart):
  • Price is slightly above its 50-period EMA and below its 21-period EMA
  • Price is right below its middle Bollinger band
  • RSI is neutral (48.90)
  • Volume is average
Key levels to the upside          Key levels to the downside

1: $10,850                                 1: $10,630

2: $11,000                                 2: $10,500

3: $11,090                                  3: $10,015

Ethereum

Ethereum has been pretty stable in the past 24 hours. Its price has been making higher highs and higher lows ever since Sept 24, until now. The trend has (seemingly) stopped, with Ethereum being stopped out by the $360 resistance level. While this makes Ethereum’s outlook slightly more bearish, in reality, this doesn’t change much as Ethereum Option traders have already made a prediction of ETH trading between $340 and $360 by the end of Oct.

ETH/USD 4-hour Chart

While Ethereum’s 4-hour and 1-day technicals are now tilted towards the sell-side, its longer-term overview is extremely bullish. If we take a look at its weekly or monthly technicals, the sentiment is heavily tilted towards the buy-side.

ETH/USD 4-hour Technicals

Technical Factors (4-hour Chart):
  • The price is at its 50-period and its 21-period EMA
  • The price is at its middle Bollinger band
  • RSI is neutral (50.89)
  • Volume is below average
Key levels to the upside          Key levels to the downside

1: $360                                     1: $340

2: $371                                     2: $300

3: $400                                      3: $289

Ripple

XRP has, after four days of trying, failed to break the $0.2454 resistance level. Its price has fallen off a bit since the last attempt, currently trading at around $0.24. We can also see that XRP has moved below its 50-period moving average, which may cause a further descent towards $0.235.

XRP/USD 4-hour Chart

XRP technicals are quite confusing. While its 4-hour outlook is mixed, its daily outlook is heavily tilted towards the sell-side. On the other hand, its weekly outlook is bullish, while its monthly outlook is, once again, bearish.

XRP/USD 4-hour Technicals

Technical factors (4-hour Chart):
  • The price is below both its 50-period EMA and its 21-period EMA
  • Price is slightly below its middle Bollinger band
  • RSI is neutral (48.16)
  • Volume is stable and average
Key levels to the upside          Key levels to the downside

1: $0.2454                                 1: $0.235 

2: $0.266                                   2: $0.227

3: $0.27                                    3: $0.221


Categories
Crypto Videos

Blockchain Can Shield Banks From Trade Scandals! The Banks Mass Adoption Of Blockchain Is Coming!


Blockchain Can Shield Banks From Trade Finance Scandals

Blockchain word as symbol cryptocurrency in chrome chain.

The pressure created by the ongoing economic crisis, mounting geopolitical tensions, and obsolete trade finance systems is pushing the trade finance industry all across the globe down a rabbit hole. To add fuel to the fire, recent trade finance scandals that involved major players such as Hin Leong, Agritrade, ZenRock, and Hontop Energy netted a combined loss of almost $6 billion. To limit exposure to such threats, major banks such as ABN Amro, Société Générale, and BNP Paribas have all withdrawn completely from the sector, while others stayed in the sector but raised the bar on their funding processes.

Samir Neji, founder, and CEO of Dltledgers, said: “For traders and other businesses that involve moving goods around the world, capital is now much harder to come by. This is bringing the sector that is already in difficulty further down.” By implementing blockchain, Neji pointed out. Traders can negate the paperwork, email exchanges, and phone calls that are now required to secure trade finance.
Distributed ledger technology (DLT for short) has the potential to bring transparency to the process of trade execution by sharing information in real-time, he added.

When all sides immutably record everything from trade participants, goods, documents, contracts, and payments on a single safe platform that provides tracking and authentication, the chances of a trade being fraudulent would plummet, or perhaps disappear altogether. Neji also said: “If banks see their trades carrying less risk, which they do when using DLT, the trader will be in a much better spot to get financing, and in many cases, will even end up paying lower rates.”
Apart from regaining the banks’ trust to fund global trade, blockchain would also allow traders to easily, smoothly, and safely execute their trades during the ongoing pandemic.

Conclusion

Regarding the adoption of blockchain technology by trade finance and supply chain players, Neji stressed that it was important to stop just talking about blockchain to customers and that they should just see the benefits the technology would offer themselves.
According to the exec, just as with using a smartphone, it is not important for people to know all the technicalities of the underlying technology if they want to actually benefit from it. He said that his company, as well as other companies in the sector, are working to incorporate blockchain in trade finance, but that they need to work together more so they could fight the common foes, such as paper documents, outdated processes, as well as fraud.

Categories
Crypto Guides

Is EOS A Better Investment Than Ethereum Right Now?

Introduction

EOS and Ethereum both are popular blockchain smart contract platforms. To know whether EOS is a better investment or Ethereum, we will need to compare the two technologies by exploring basic concepts and comparing their mechanisms to draw out the necessary conclusions. After Ethereum was introduced in the crypto industry, two years later, EOS was launched and claimed to fix the flaws in Ethereum. EOS is a strong, scalable contender and might outperform Ethereum. The battle of EOS vs. Ethereum is the most interesting and happening space in the crypto industry. 

What is Ethereum?

Ethereum is a blockchain platform launched in 2015 by Vitalik Buterin. It allows users to send and receive funds independently without the assistance of any third party. It was the first blockchain project to install the smart technology contract. In this technology, some predefined conditions are applied, and users are needed to justify the conditions to proceed with transactions without the need for an intermediate body. This decentralized blockchain has its own cryptocurrency called Ether (ETH), which is tradable in most of the crypto exchanges. 

What is EOS?

EOS is a new blockchain platform that can also manage smart contracts. The Block.one company launched this project in 2017. It has created history by raising the highest Initial Coin Offering(ICO), worth more than $2.5 billion. It has its own EOS coin, which can be transferred from wallet to wallet. EOS aims to become the most scalable, cheapest, and fastest blockchain platform. 

Scalability

Presently Ethereum can support 15 transactions per second, whereas EOS can serve up to at least 10,000 transactions/second. EOS using IoT provides for inter-blockchain communication, which creates blockchains to allow more transactions. Ethereum is working on two protocols called “Plasma” and “Sharding” to increase transaction numbers per second. 

Transaction Cost

On Ethereum, users need to pay gas for each transaction, but EOS works completely in a different way. EOS blockchain users deposit their token to cover the bandwidth required for the transaction. 

Consensus Mechanism

Ethereum is based upon the proof-of-work model, and EOS follows the proof-of-stake model. The transactions are verified without the support of any intermediate system. Ethereum generates random puzzles at every node before confirming the transactions. These puzzles are so difficult to solve that you need to take the help of experts called “Miners.” While EOS offers to stake your coins to verify transactions, the stakers have a chance to earn the rewards. 

EOS Vs. Ethereum: Who holds the future?

Ethereum, just after Bitcoin, is the most popular cryptocurrency across the world. EOS, right from its initial days, is performing exceptionally well. EOS is yet to achieve growth that Ethereum has already achieved, but EOS is significantly better than Ethereum. EOS is a more user-friendly cryptocurrency than ETH. It’s still too early to think about how far EOS will go because the blockchain ecosystem is highly unpredictable. 

Conclusion 

EOS is younger than Ethereum and has improved scalability and transaction fees as compared to Ethereum, but still, it’s under so much controversy because of its more centralized layout. If Ethereum successfully implements the proof-of-stake mechanism, then EOS might not be able to outperform it. On the other hand, if Ethereum doesn’t reduce it’s transaction costs, then EOS will easily overtake Ethereum soon is what crypto experts believe. Cheers! 

Categories
Crypto Market Analysis

Daily Crypto Review, Sept 29 – Bitcoin’s Fail to Break $11,000 Causes a Red Day for Crypto: What’s Next?

The cryptocurrency sector has lost some value as Bitcoin failed to break $11,000. Bitcoin is currently trading for $10,660, representing a decrease of 1.68% on the day. Meanwhile, Ethereum lost 1% on the day, while XRP gained 0.76%.

 Daily Crypto Sector Heat Map

If we look at the top100 cryptocurrencies and their gains and losses, OMG Network gained 27% on the day, making it the most prominent daily gainer. ABBC Coin (18.7%) and Storj (16.95%) also did great. On the other hand, DeFi projects took a hit as Uniswap lost 16.2%, making it the most prominent daily loser. It is followed by DFI. Money’s loss of 13.47% and Ocean Protocol’s loss of 12.4%.

Top 10 24-hour Performers (Click to enlarge)

Bottom 10 24-hour Performers (Click to enlarge)

Bitcoin’s level of market dominance decreased slightly since our last report, with its value currently being at 60.46%. This value represents a 0.29% difference to the downside when compared to when we last reported.

Daily Crypto Market Cap Chart

The crypto sector capitalization has lost in value over the course of the past 24 hours. Its current value is $343.89 billion, which represents a decrease of $5.5billion when compared to our previous report.

_______________________________________________________________________

What happened in the past 24 hours?

_______________________________________________________________________

_______________________________________________________________________

Technical analysis

_______________________________________________________________________

Bitcoin

Bitcoin failed to end the day above the large triangle formation (and the 38.2 Fib retracement level), which caused its price to push back inside the body of the triangle. The move towards the upside exhausted the buyers as they couldn’t get past the 50-day moving average as well as the Fib retracement level.

BTC/USD 1-day Chart

If we zoom in to the 4-hour chart, we can clearly see that this was a fakeout that exhausted the buy-side even further. While it is unknown where Bitcoin’s next move will be, traders should look at the triangle and check for where BTC exits it.

BTC/USD 4-hour Chart

Bitcoin’s short-term technicals have changed its position from a “buy” to a “sell.” When comparing the technicals, we can see that the longer time frame we pick, the more bullish the Bitcoin overview is.

BTC/USD 4-hour Technicals

Technical factors (4-hour Chart):
  • Price is slightly below its 50-period EMA and below its 21-period EMA
  • Price is below its middle Bollinger band
  • RSI is neutral (47.23)
  • Volume is average
Key levels to the upside          Key levels to the downside

1: $10,850                                 1: $10,630

2: $11,000                                 2: $10,500

3: $11,090                                  3: $10,015

Ethereum

Ethereum has been in a state of constant price growth since Sept 24, with the price posting higher and highs as well as higher lows. This time, while the movement towards the downside was a bit sharper than usual, Ethereum has still posted a higher low, indicating it’s not as bullish as many people think. However, this move towards the downside stopped Ethereum from moving above the dreaded $360 resistance level, once again fulfilling the words of the majority of Options traders, which called for ETH trading between $340 and $360 until the end of October.

ETH/USD 4-hour Chart

While Ethereum’s 4-hour and 1-day technicals turned slightly more bearish and are tilted towards the sell-side, its longer-term overview is extremely bullish. When talking about weekly or monthly technicals, the sentiment is heavily tilted towards the buy-side.

ETH/USD 4-hour Technicals

Technical Factors (4-hour Chart):
  • The price is at its 50-period and its 21-period EMA
  • The price is at its middle Bollinger band
  • RSI is neutral (51.26)
  • Volume is average
Key levels to the upside          Key levels to the downside

1: $360                                     1: $340

2: $371                                     2: $300

3: $400                                      3: $289

Ripple

Not much has happened for XRP in the past 24 hours regarding price movement. The $0.2454 level stopped out any push from the bull-side, making XRP stagnant just below this resistance level. However, this made it almost clear that the 5th leg of the Elliot impulse wave did end with XRP’s move towards $0.219 (the circled candles). We can expect XRP to trader between the $0.235 support level and $0.2454 resistance level for some time.

XRP/USD 4-hour Chart

Ever since XRP left the Elliot wave pattern behind it, its short-term overview has turned bullish. However, its overview changes to bearish and then extremely bearish the longer we go in time (daily, weekly, monthly overview).

XRP/USD 4-hour Technicals

Technical factors (4-hour Chart):
  • The price is above both its 50-period EMA and its 21-period EMA
  • Price is slightly above its middle Bollinger band
  • RSI is neutral (55.23)
  • Volume is stable and average
Key levels to the upside          Key levels to the downside

1: $0.2454                                 1: $0.235 

2: $0.266                                   2: $0.227

3: $0.27                                    3: $0.221


Categories
Crypto Market Analysis

Daily Crypto Review, Sept 28 – XRP Exiting Bearish Structure and Aiming for $0.245; Bitcoin Eyeing $11,000

The cryptocurrency sector was mostly trading sideways over the weekend, with a sudden burst towards the upside in recent hours. Bitcoin is currently trading for $10,877, representing an increase of 1.14% on the day. Meanwhile, Ethereum lost 0.59% on the day, while XRP gained 0.18%.

 Daily Crypto Sector Heat Map

If we look at the top100 cryptocurrencies, Arweave gained 36.17% on the day, making it the most prominent daily gainer. Swipe (21.16%) and CyberVein (12.64%) also did great. On the other hand, ABBC Coin lost 18.37%, making it the most prominent daily loser. It is followed by DFI.Money’s loss of 10.91% and Reserve yearn.finance’s loss of 10.43%.

Top 10 24-hour Performers (Click to enlarge)

Bottom 10 24-hour Performers (Click to enlarge)

Bitcoin’s level of market dominance decreased slightly since our last report, with its value currently being at 60.75%. This value represents a 0.72% difference to the downside when compared to when we last reported.

Daily Crypto Market Cap Chart

The crypto sector capitalization has increased in value over the weekend. Its current value is $349.48 billion, which represents a decrease of $13.19 billion when compared to our previous report.

_______________________________________________________________________

What happened in the past 24 hours?

_______________________________________________________________________

_______________________________________________________________________

Technical analysis

_______________________________________________________________________

Bitcoin

Bitcoin has spent the weekend preparing for a move towards the upside, which happened in recent hours. While the move did break the large triangle to the upside, it stopped at the 38.2% level, which it is now fighting for. Only a daily close above this level would mean that the bulls have taken over the market, while anything else is far less bullish.

BTC/USD 1-day Chart

If we zoom in to the 4-hour chart, we can see that the largest cryptocurrency by market cap got stopped out (for now) at the 38.2% Fib retracement level. The next couple of hours will be crucial in determining Bitcoin’s short-term future and its sentiment.

BTC/USD 4-hour Chart

Bitcoin’s short-term technicals tilted even more towards the bull side over the weekend. On the other hand, its long-term technicals are still bullish on all time-frames.

BTC/USD 4-hour Technicals

Technical factors (4-hour Chart):
  • Price is above both its 50-period EMA and 21-period EMA
  • Price above its top Bollinger band
  • RSI is static but close to being overbought (62.31)
  • Volume is steady with a few spikes
Key levels to the upside          Key levels to the downside

1: $10,850                                 1: $10,630

2: $11,000                                 2: $10,500

3: $11,090                                  3: $10,015

Ethereum

Unlike Bitcoin, Ethereum didn’t have a strong move towards the upside, but rather kept its trading within a range, bound by $360 to the upside and $340 to the downside. As we said in our previous post, options traders bet on Ethereum having over 55% chance of staying below $360 and above $340 in the next month, with only around 20% of them betting on ETH breaking the $360 mark in October.

ETH/USD 4-hour Chart

While Ethereum’s 4-hour technicals are tilted towards the buy-side, its 1-day technicals are bearish. When talking about weekly or monthly technicals, the sentiment is tilted towards the buy-side heavily.

ETH/USD 4-hour Technicals

Technical Factors (4-hour Chart):
  • The price is above its 50-period and its 21-period EMA
  • The price ascension is stopped by its top Bollinger band
  • RSI is neutral (57.76)
  • Volume is below average
Key levels to the upside          Key levels to the downside

1: $360                                     1: $340

2: $371                                     2: $300

3: $400                                      3: $289

Ripple

XRP’s price movement has surprised traders as they expected it to push more towards the downside and continue its Elliot impulse wave 5th leg movement. However, it seems that XRP wanted to move towards the upside and pushed towards its $0.2454 resistance (unsuccessfully).

Traders are calling for two scenarios, with one being that XRP hasn’t finished its Elliot impulse wave pattern yet and that it will revisit the $0.21 lows before doing anything else. However, many traders are now saying that the impulse wave has ended with XRP reaching $0.219 instead of $0.21 and that it is now moving freely and trying to push above its resistance levels. While both sides have their reasoning, the large ascending support level (red line) is tipping the scales in favor of XRP, already ending its Elliot wave structure.

XRP/USD 1-day Chart

If we zoom in to the 4-hour chart, it’s even more apparent that the Elliot impulse wave has finished, and that XRP is now moving towards its support/resistance levels without such a strong pattern behind it.

XRP/USD 4-hour Chart

XRP’s 4-hour sentiment has turned bullish after (most likely) finishing its Elliot impulse wave pattern. Not only that, but its slightly longer time-frames are also tilted towards the buy-side, which is a healthy change when compared to last week. However, its monthly overview is still looking bearish (though not as much as before the weekend).

XRP/USD 4-hour Technicals

Technical factors (4-hour Chart):
  • The price is above both its 50-period EMA and its 21-period EMA
  • Price is slightly below its top Bollinger band
  • RSI is neutral (59.22)
  • Volume is stable and average
Key levels to the upside          Key levels to the downside

1: $0.235                                   1: $0.227 

2: $0.2454                                 2: $0.221

3: $0.266                                  3: $0.214


Categories
Crypto Guides

Introduction To ‘Cryptohopper’ – A Reliable Crypto Trading Expert Advisor

Introduction

Cryptocurrencies are intensively volatile. The volatility of the currency is a matter of concern, but in the case of trading with cryptocurrency, it’s quite advantageous. In the crypto trade, you can invest when the market value is declining, and you can retrieve your amount when prices are on hike.

However, it requires experience to become an expert in reading and analyzing this market’s up-down trends, so that you can invest at the perfect time to expect maximum returns. To predict this market flow for investors, trading bots are introduced with automated algorithms in the industry. Today in this article, we will be discussing one such trading bot- Cryptohopper.

Understanding Crypto Trading Bot

Crypto bots are cloud-based computer programs to host cryptocurrency trading. It provides idle tools to beginner and advanced traders. At the right time, it can automatically buy and sell cryptocurrencies. Users can simply connect the bot with their cryptocurrency exchange, and then it can smoothly trade on their behalf. For successful trading, it is necessary to rely upon complicated probability estimation for predicting the market trends, and a bot can calculate this much faster than a human brain. 

What is Cryptohopper?

The cryptocurrency industry is offering various services and tools to traders to elevate their success rate. Cryptohopper is one such tool that can simplify the crypto-trading ecosystem. It’s a trading bot that has been customized as per the requirements of users and can also provide market technical detail.

Earlier, a user would have to spend a lot of time in front of the computer screen to trace market flow all day, but now the fully automated bot can monitor the trade 24/7 on behalf of the users. To ensure high output, it can perform backtest for each iteration and can optimize decisions based on the current situation. 

Why do you need a bot like Cryptohopper?

In the cryptocurrency trading world, every second matters a lot. So, to make life easy and to earn more, traders can make use of a crypto trading bot like Cryptohopper to make every second count. Let’s have a look at how Cryptohopper can help in various domains of crypto-trading.

Objective trading 

The trade will be executed entirely based upon the data analysis. You don’t need to panic about the buying or selling process because the trade activities shall be evidenced without any involvement of stress or emotion.

Social trading 

Cryptohopper directly subscribes to market signalers who analyze the trade and suggest how to raise the value of your coin. As a result, you can get appropriate information for trade optimization.

Simultaneous trading 

It operates and manages all your coins simultaneously. It can keep track of all price details and sell your coin exactly at the target profit scale that you have set.

Intuitive tools 

This bot has the potential to keep the users at the top market position. It notifies with alert in advance about the trade opportunity to sell the declining coins and to repurchase the coins at a lower price.

Cloud-based platform 

It remains 24/7 online in the cloud. It means you don’t need to keep your device ‘on’ always to track your coins. You can log in to your bot account anytime, and you will get a notification about the latest market updates. 

Conclusion

The ability of Cryptohopper to provide users with high returns in cryptocurrency trading is something to look at. The traders won’t feel the need to rely on a computer screen as this bot can automatically trace the trends and take the necessary steps that have been fed. It can be easily used without any coding background and can also be connected to any global crypto exchange without incurring any trading fees.

Categories
Crypto Market Analysis

Daily Crypto Review, Sept 25 – ETH Options Traders Like Trading Below $360; Crypto Market In the Green

The cryptocurrency sector has surprised the market and pushed towards the upside despite the short-term bearish sentiment surrounding it recently. Bitcoin is currently trading for $10,630, representing an increase of 3.56% on the day. Meanwhile, Ethereum gained 5.49% on the day, while XRP gained 3.71%.

 Daily Crypto Sector Heat Map

If we look at the top100 cryptocurrencies, Avalanche gained 24.96% on the day, making it the most prominent daily gainer. ABBC Coin (22.9%) and Arweave (18.7%) also did great. On the other hand, Hyperion lost 3.05%, making it the most prominent daily loser. It is followed by CyberVein’s loss of 2.76% and Reserve Paxos Standard’s loss of 0.4%.

Top 10 24-hour Performers (Click to enlarge)

Bottom 10 24-hour Performers (Click to enlarge)

Bitcoin’s level of market dominance stayed at the same spot since our last report, with its value currently being at 61.47%. This value represents a 0.02% difference to the upside when compared to when we last reported.

Daily Crypto Market Cap Chart

The crypto sector capitalization has increased in value over the past 24 hours. Its current value is $336.29 billion, which represents a decrease of $11.24 billion when compared to our previous report.

_______________________________________________________________________

What happened in the past 24 hours?

_______________________________________________________________________

_______________________________________________________________________

Technical analysis

_______________________________________________________________________

Bitcoin

Bitcoin has spent the past 24 hours pushing towards the upside, which resulted in a price increase of around 6% during its peak. The largest cryptocurrency by market cap has reached $10,800 before the bulls have exhausted their resources. This move towards the upside has put BTC within the large triangle, meaning that we can expect another strong move (to either side of the triangle) in the short future.

BTC/USD 1-day Chart

If we take a look at the 4-hour time-frame, the largest cryptocurrency by market cap has pushed past 23.6% Fib retracement and established itself well above it. Once the move ended, BTC found immediate support at the 50-period moving average.

BTC/USD 4-hour Chart

Bitcoin’s short-term technicals have changed its overview from very bearish to slightly bullish. On the other hand, its long-term technicals remained extremely bullish on all time-frames longer than 4-hours.

BTC/USD 4-hour Technicals

Technical factors (4-hour Chart):
  • Price is above both its 50-period EMA and 21-period EMA
  • Price near its top Bollinger band
  • RSI is neutral and tilted towards the upside (56.98)
  • Volume is volatile
Key levels to the upside          Key levels to the downside

1: $10,850                                 1: $10,630

2: $11,000                                 2: $10,500

3: $11,090                                  3: $10,015

Ethereum

Ethereum has pushed towards the upside, following Bitcoin’s move and gaining a bit less than 10% in the past 24 hours (during its peak). The second-largest cryptocurrency by market cap pushed past the $340 resistance line and established itself above it, therefore turning it into support. However, further moves towards and past $360 may be difficult at the moment, as we saw option traders for October expiration contracts “betting” that Ether is most likely going to trade between $340 and $360.

ETH/USD 4-hour Chart

Ethereum’s short-term technicals have not changed much since yesterday, tilting just slightly less to the sell-side than before. Its overview of longer time frames is extremely bullish, especially on the 1-day and 1-month technical overview.

ETH/USD 4-hour Technicals

Technical Factors (4-hour Chart):
  • The price is below its 50-period and right at its 21-period EMA
  • The price is between its top and middle Bollinger band
  • RSI is neutral (47.68)
  • Volume increased (but descending towards average)
Key levels to the upside          Key levels to the downside

1: $360                                     1: $340

2: $371                                     2: $300

3: $400                                      3: $289

Ripple

While XRP didn’t differ from the rest of the top cryptocurrencies and pushed towards the upside as well, the gains it made may not remain gains for long. XRP managed to gain around 5% in the past 24 hours (during its peak) but found great resistance at the 5th leg of the Elliot impulse wave. XRP quickly bounced off of it, indicating that we may see consolidation and a continuation towards the downside, where XRP will fulfill its move at the $0.219 target.

XRP/USD 4-hour Chart

XRP’s bearish sentiment extends across all time frames, with its 4-hour overview showing a bit lighter tilt towards the sell-side, and its longer time-frame overviews showing a strong tilt towards the sell-side.

XRP/USD 4-hour Technicals

Technical factors (4-hour Chart):
  • The price is below its 50-period EMA and just above its 21-period EMA
  • Price is slightly above its middle Bollinger band
  • RSI is natural (49.02)
  • Volume is slightly above average
Key levels to the upside          Key levels to the downside

1: $0.235                                   1: $0.227 

2: $0.2454                                 2: $0.221

3: $0.266                                  3: $0.214


Categories
Crypto Market Analysis

Daily Crypto Review, Sept 24 – Bitcoin Following Gold: $9,300 On The Horizon

The cryptocurrency sector has experienced a slight decrease in value as (as many traders speculate) Bitcoin mirrored Gold’s triangle pattern breakout and headed towards the downside. Bitcoin is currently trading for $10,261, representing a decrease of 1.72% on the day. Meanwhile, Ethereum lost 4.54% on the day, while XRP lost 3.79%.

 Daily Crypto Sector Heat Map

If we look at the top100 cryptocurrencies, Uniswap gained 13.73% on the day, making it the most prominent daily gainer. HedgeTrade (9.22%) and Hyperion (5.61%) also did great. On the other hand, DigiByte lost 17.91%, making it the most prominent daily loser. It is followed by Ren’s loss of 17.78% and Reserve Rights’ loss of 11.70%.

Top 10 24-hour Performers (Click to enlarge)

Bottom 10 24-hour Performers (Click to enlarge)

Bitcoin’s dominance level experienced a slight increase since our last report, with its value currently being at 61.45%. This value represents a 0.35% difference to the upside when compared to when we last reported.

Daily Crypto Market Cap Chart

The crypto sector capitalization has decreased in value over the past 24 hours. Its current value is $325.05 billion, which represents a decrease of $8.86 billion when compared to our previous report.

_______________________________________________________________________

What happened in the past 24 hours?

_______________________________________________________________________

_______________________________________________________________________

Technical analysis

_______________________________________________________________________

Bitcoin

Bitcoin has spent the day mirroring Gold’s movement from a day ago, where it broke the same triangle pattern to the downside. With the same happening to Bitcoin, we saw its price falling to sub-$10,300 levels. If we take into account the CME Futures, which will expire on Friday, deeming as much as 86% of $284 million worth of contracts worthless, we can guess with accuracy that the bears will continue to reign over the market for now. The suggested price of $9,300 to $9,500 is even more realistic now.

BTC/USD 1-day Chart

If we take a look at the 4-hour time frame, the largest cryptocurrency by market cap has dropped below the 23.6% Fib retracement as well as the triangle bottom line, suggesting strong bearish sentiment in the short-term. While the volume is descending and preparing for the next move, Bitcoin’s next one will most likely be to the downside.

BTC/USD 4-hour Chart

Bitcoin’s short-term technicals haven’t changed from yesterday, and are still very bearish. However, while the technicals are very bearish on the 4-hour chart, the daily and weekly technical overview is slightly less bearish, while the monthly overview is very bullish.

BTC/USD 4-hour Technicals

Technical factors (4-hour Chart):
  • Price is below both its 50-period EMA and 21-period EMA
  • Price slightly closer to the bottom Bollinger band
  • RSI is neutral (34.72)
  • Volume is slowly descending from a massive spike
Key levels to the upside          Key levels to the downside

1: $10,500                                 1: $10,015

2: $10,630                                 2: $9,880

3: $10,850                                  3: $9,740

Ethereum

The DeFi market has managed to recover from its plummet, with yearn.finance leading the move to the upside. While Ethereum has lost value due to its correlation with Bitcoin, its short-term overview is slightly more bullish.

However, if we take a look at Ethereum’s chart, we can see that the second-largest cryptocurrency by market cap managed to stabilize after hitting the bottom Bollinger band, which provided adequate support. While ETH did fall below $340 and broke a major support level, which calls for a push towards $300, the situation is slightly more bullish than the day before.

ETH/USD 4-hour Chart

Ethereum’s short-term technicals are extremely bearish, while the situation changes drastically in the weekly and monthly overview, where the overview is quite bullish.

ETH/USD 4-hour Technicals

Technical Factors (4-hour Chart):
  • The price is below both its 21-period and its 50-period EMA
  • The near its bottom Bollinger band
  • RSI is hovering around the oversold line (30.56)
  • Volume is average (except for the one-candle volume spike during the downturn)
Key levels to the upside          Key levels to the downside

1: $340                                     1: $300

2: $360                                     2: $289

3: $371                                      3: $278

Ripple

XRP has spent the day continuing its Elliot impulse wave 5th leg. While its price did go down, many traders have turned slightly bullish, calling out for the end of the 5th leg of the impulse wave at the spot where the price meets the ascending trend line from March (the red ascending line). This would put the price target for XRP at somewhere between $0.215 and $0.218 before pushing towards the upside.

XRP/USD 1-day Chart

While many traders have turned bullish, XRP’s technicals are still firm with their bearish sentiment. The bearish sentiment doesn’t end at the shorter time frames; it rather extends to the daily and weekly overview as well.

XRP/USD 4-hour Technicals

Technical factors (4-hour Chart):
  • The price is below both its 21-period EMA and its 50-period EMA
  • Price is very close to its bottom Bollinger band
  • RSI is in the oversold territory (27.28)
  • Volume is volatile, with occasional spikes
Key levels to the upside          Key levels to the downside

1: $0.227                                   1: $0.221 

2: $0.235                                   2: $0.214

3: $0.2454                                3: $0.2


Categories
Crypto Market Analysis

Daily Crypto Review, Sept 23 – Gold Pushing BTC Towards $9,500; XRP Bears Taking Over

The cryptocurrency sector has mostly tried to consolidate after this weekend’s losses. Bitcoin is currently trading for $10,496, representing an increase of 0.68% on the day. Meanwhile, Ethereum gained 0.26% on the day, while XRP lost 1.28%.

 Daily Crypto Sector Heat Map

If we look at the top100 cryptocurrencies, OMG Network gained 21.05% on the day, making it the most prominent daily gainer. Synthetix Network (20.54%) and Hyperion (16.87%) also did great. On the other hand, Avalanche lost 54.43%, making it the most prominent daily loser. It is followed by Orchid’s loss of 13.56% and Celo’s loss of 10.10%.

Top 10 24-hour Performers (Click to enlarge)

Bottom 10 24-hour Performers (Click to enlarge)

Bitcoin’s dominance level experienced a slight decrease since our last report, with its value currently being at 61.10%. This value represents a 0.19% difference to the downside when compared to when we last reported.

Daily Crypto Market Cap Chart

The crypto sector capitalization has slightly increased in value over the past 24 hours. Its current value is $333.91 billion, which represents an increase of $3.7 billion when compared to our previous report.

_______________________________________________________________________

What happened in the past 24 hours?

_______________________________________________________________________

_______________________________________________________________________

Technical analysis

_______________________________________________________________________

Bitcoin

Bitcoin has spent the day trying to “end the battle” for the 23.6% Fib retracement level. With it ultimately ending up above it, Bitcoin has managed to stay out of the bearish cycle it was about to jump in. With that being said, the 1-day chart is still calling for a pullback towards the $9,300-$9,500. The large red triangle on our chart shows Bitcoin’s possible correlation with gold (as the gold chart looks exactly the same, with the exception that its triangle already popped to the downside), which may cause another push towards the downside.

BTC/USD 1-day Chart

If we take a look at the 4-hour time frame, the largest cryptocurrency by market cap managed to stay above the triangle bottom line and gain a foothold at the 23.6% Fib retracement line. However, Bitcoin’s sentiment is still slightly bearish in the short-term, which may ultimately result in another nosedive.

BTC/USD 4-hour Chart

Bitcoin’s short-term technicals are still very bearish. However, the more we look at longer time frames, the better the situation is. While the technicals are very bearish on the 4-hour chart, the daily and weekly overview are not so bad (though still tilted towards the downside), while the monthly overview is still very bullish.

BTC/USD 4-hour Technicals

Technical factors (4-hour Chart):
  • Price is slightly  below its 50-period EMA and its 21-period EMA
  • Price slightly below its middle Bollinger band
  • RSI is neutral and recovering from the downswing (39.62)
  • Volume is slowly descending from a massive spike
Key levels to the upside          Key levels to the downside

1: $10,630                                 1: $10,500

2: $10,850                                 2: $10,015

3: $11,000                                  3: $9,880

Ethereum

DeFi market is experiencing a bloodbath, with yearn.finance dropping 50% from its highs established in the past weeks and the rest of the market following. With that being said, many institutional investors have said they are macro-driven and not crypto-driven and that ETH’s fundamentals have never been better.

However, if we take a look at Ethereum’s chart, we can see that the situation is not exactly bullish. The second-largest cryptocurrency by market cap has barely established support at the $340 level. With the volume coming back to normal, it seems that ETH will stay at this level and try to consolidate in the short-term.

ETH/USD 4-hour Chart

Ethereum’s short-term technicals are extremely bearish, while its mid-term technicals are getting quite bullish. This confirms the story that the “smart money” is telling, which is that institutional money is coming into the market regardless of the short-term bearishness.

ETH/USD 4-hour Technicals

Technical Factors (4-hour Chart):
  • The price is below both its 21-period and its 50-period EMA
  • The between its middle and bottom Bollinger band
  • RSI is neutral but tilted towards the downside (34.67)
  • Volume has returned to average
Key levels to the upside          Key levels to the downside

1: $360                                     1: $340

2: $371                                     2: $300

3: $400                                      3: $289

Ripple

XRP has spent the day trying to consolidate after a push towards the downside. The fourth-largest cryptocurrency by market cap has (for now) stopped its squeeze down after hitting the bottom of the bottom Bollinger band, which stopped it from descending further. While the sentiment is still bearish, the move towards the downside that will finish the Elliot impulse wave’s fifth leg may be delayed slightly.

XRP/USD 1-day Chart

Taking a look at the technicals, XRP is showing extreme bearish sentiment on both short-term and long-term charts. Its 4-hour, daily, weekly and monthly indicators are heavily tilted towards the downside, which is certainly not a good sign for the XRP bulls.

XRP/USD 4-hour Technicals

Technical factors (4-hour Chart):
  • The price is below both its 21-period EMA and its 50-period EMA
  • Price is slightly above its bottom Bollinger band
  • RSI is neutral and flat (38.38)
  • Volume is coming back to average
Key levels to the upside          Key levels to the downside

1: $0.235                                   1: $0.227 

2: $0.2454                                 2: $0.221

3: $0.266                                  3: $0.214