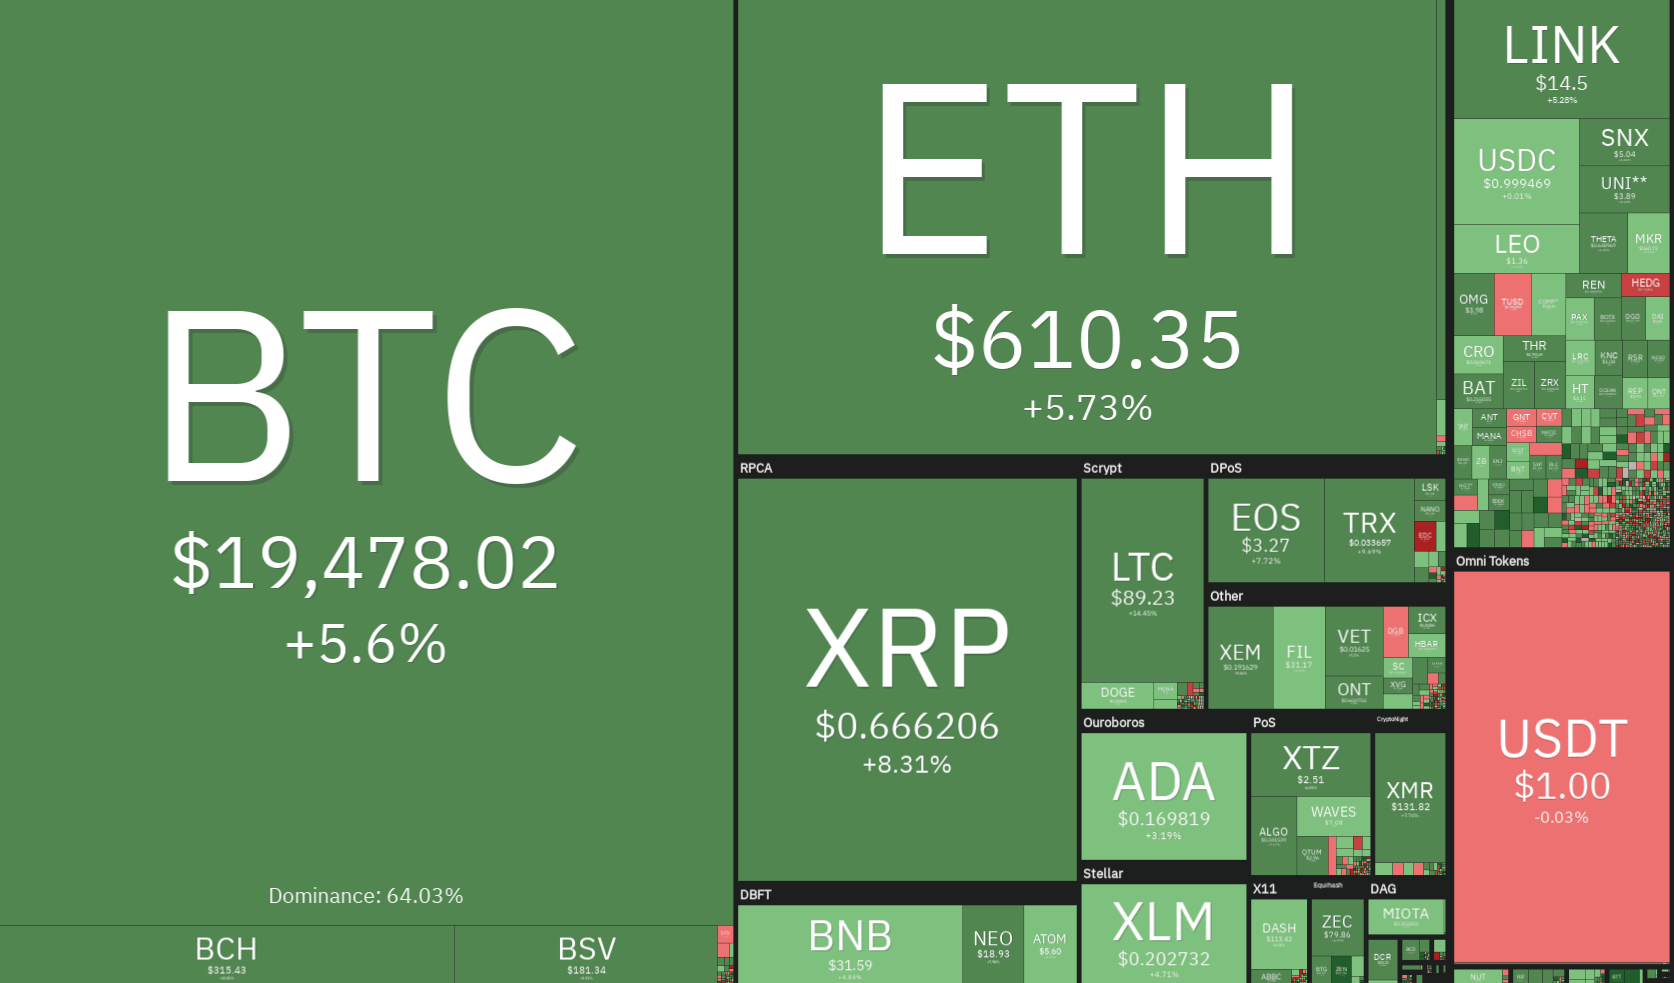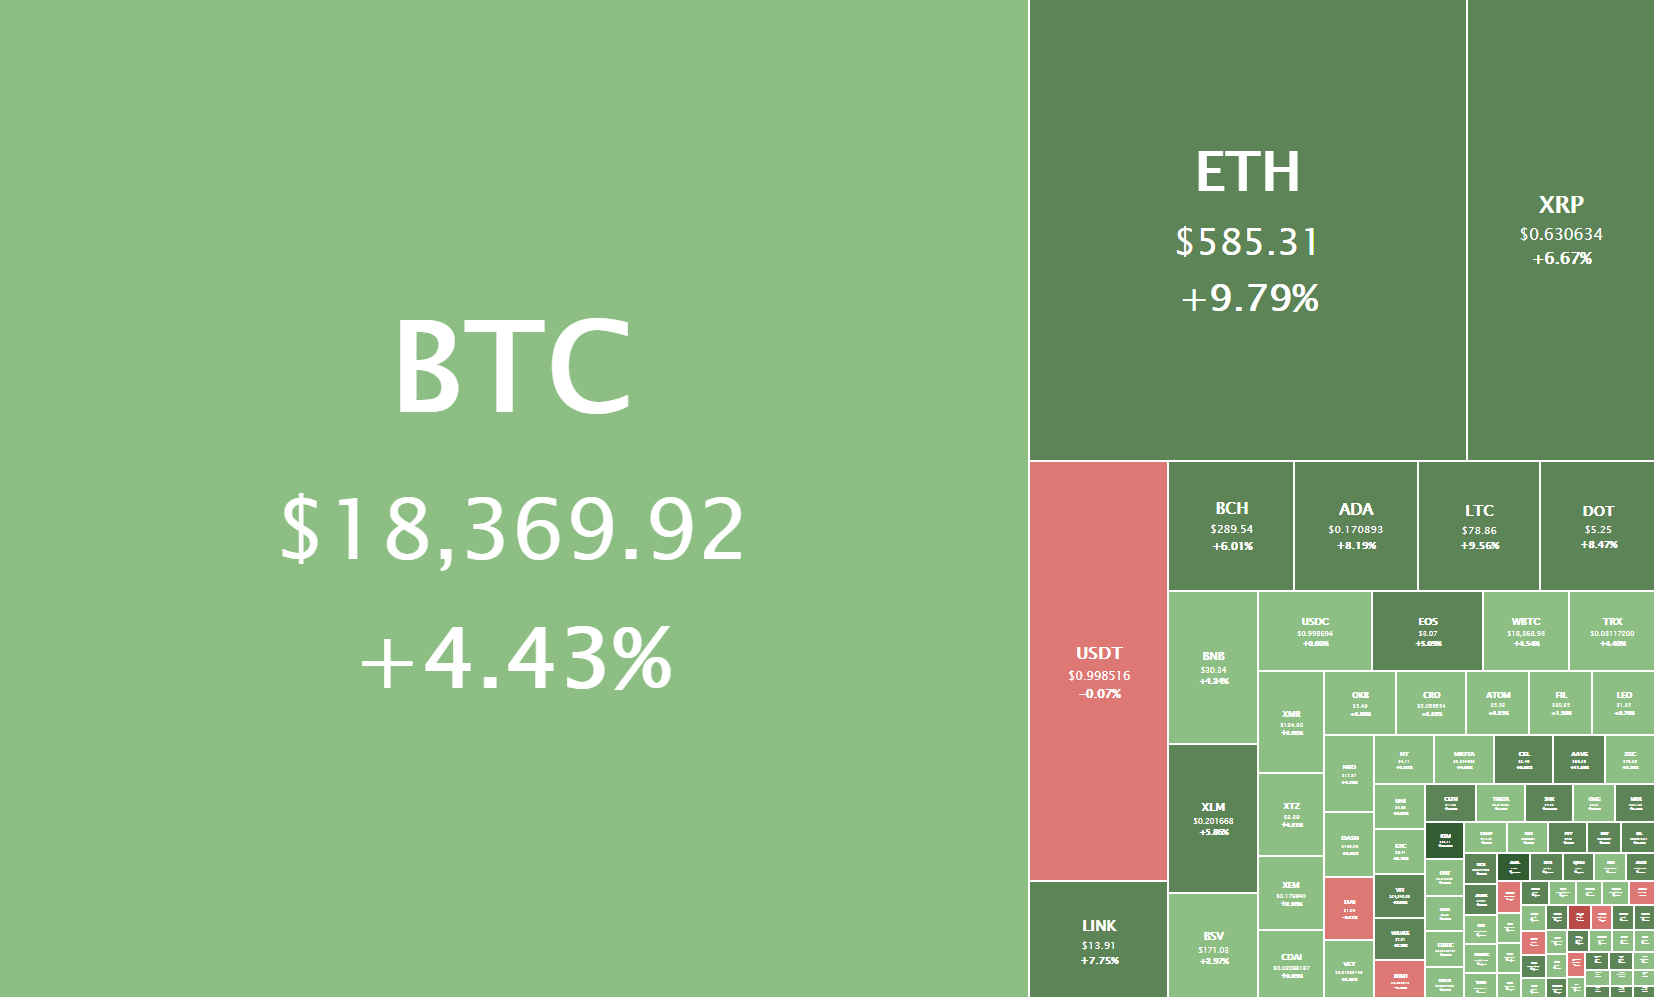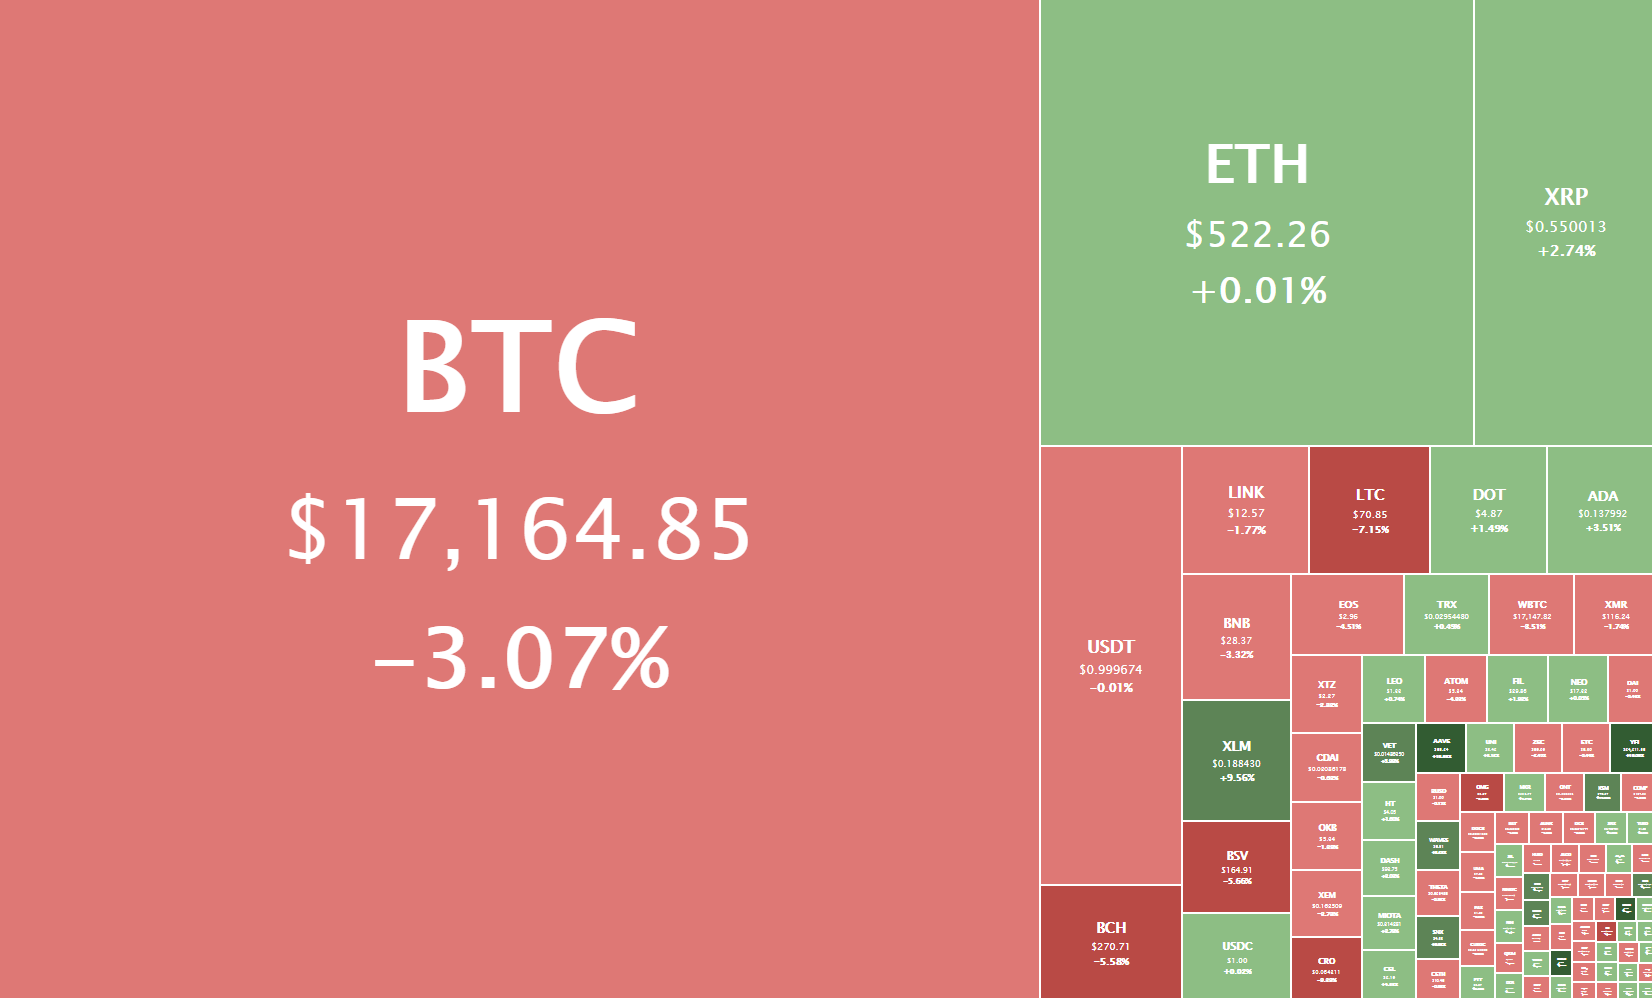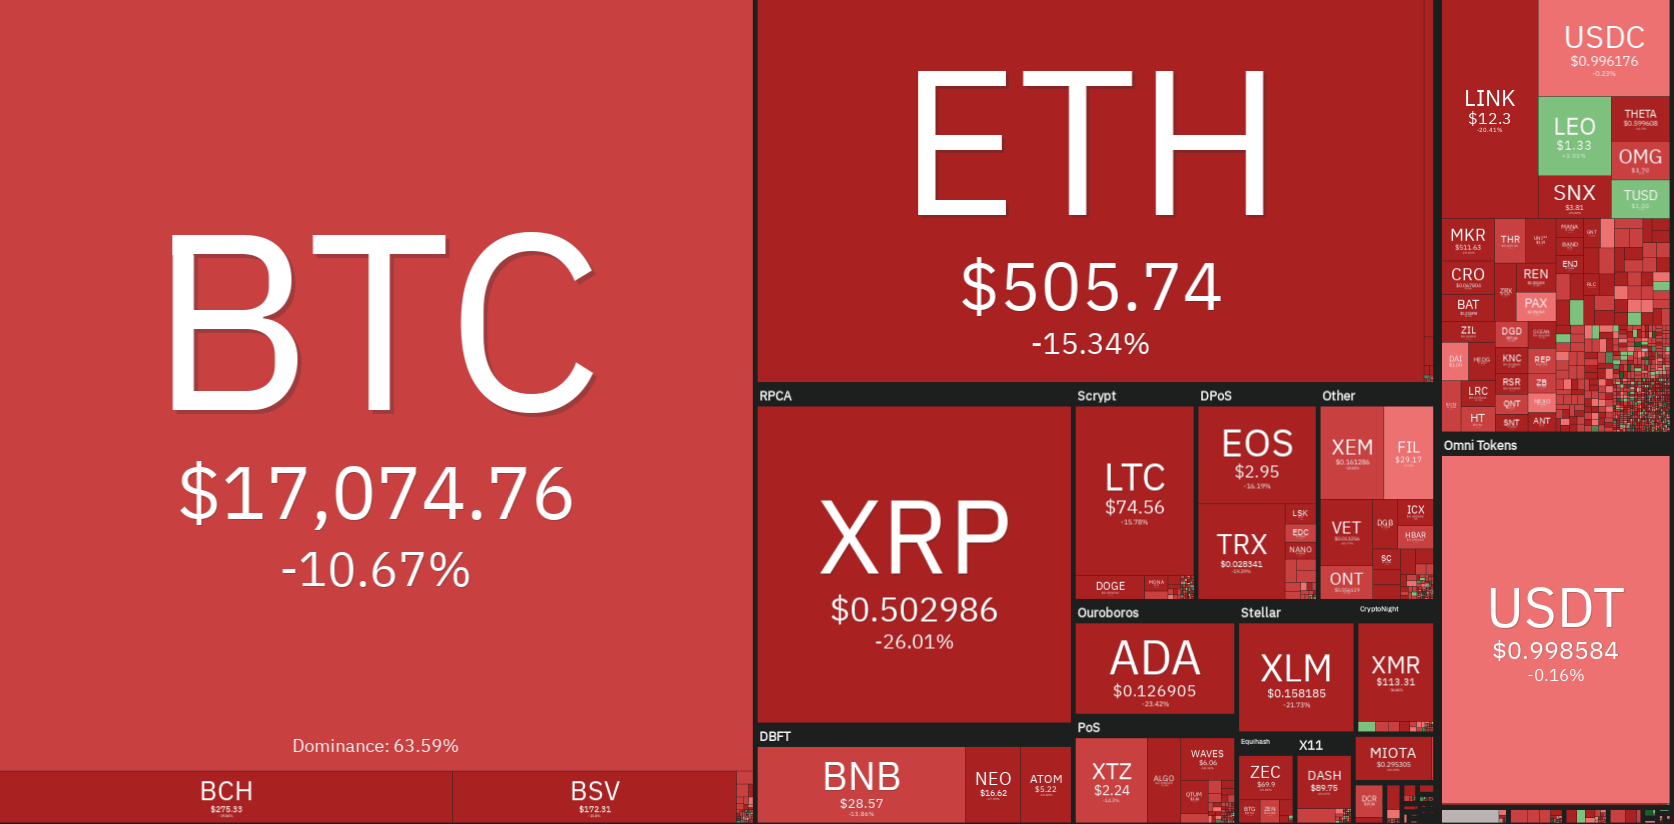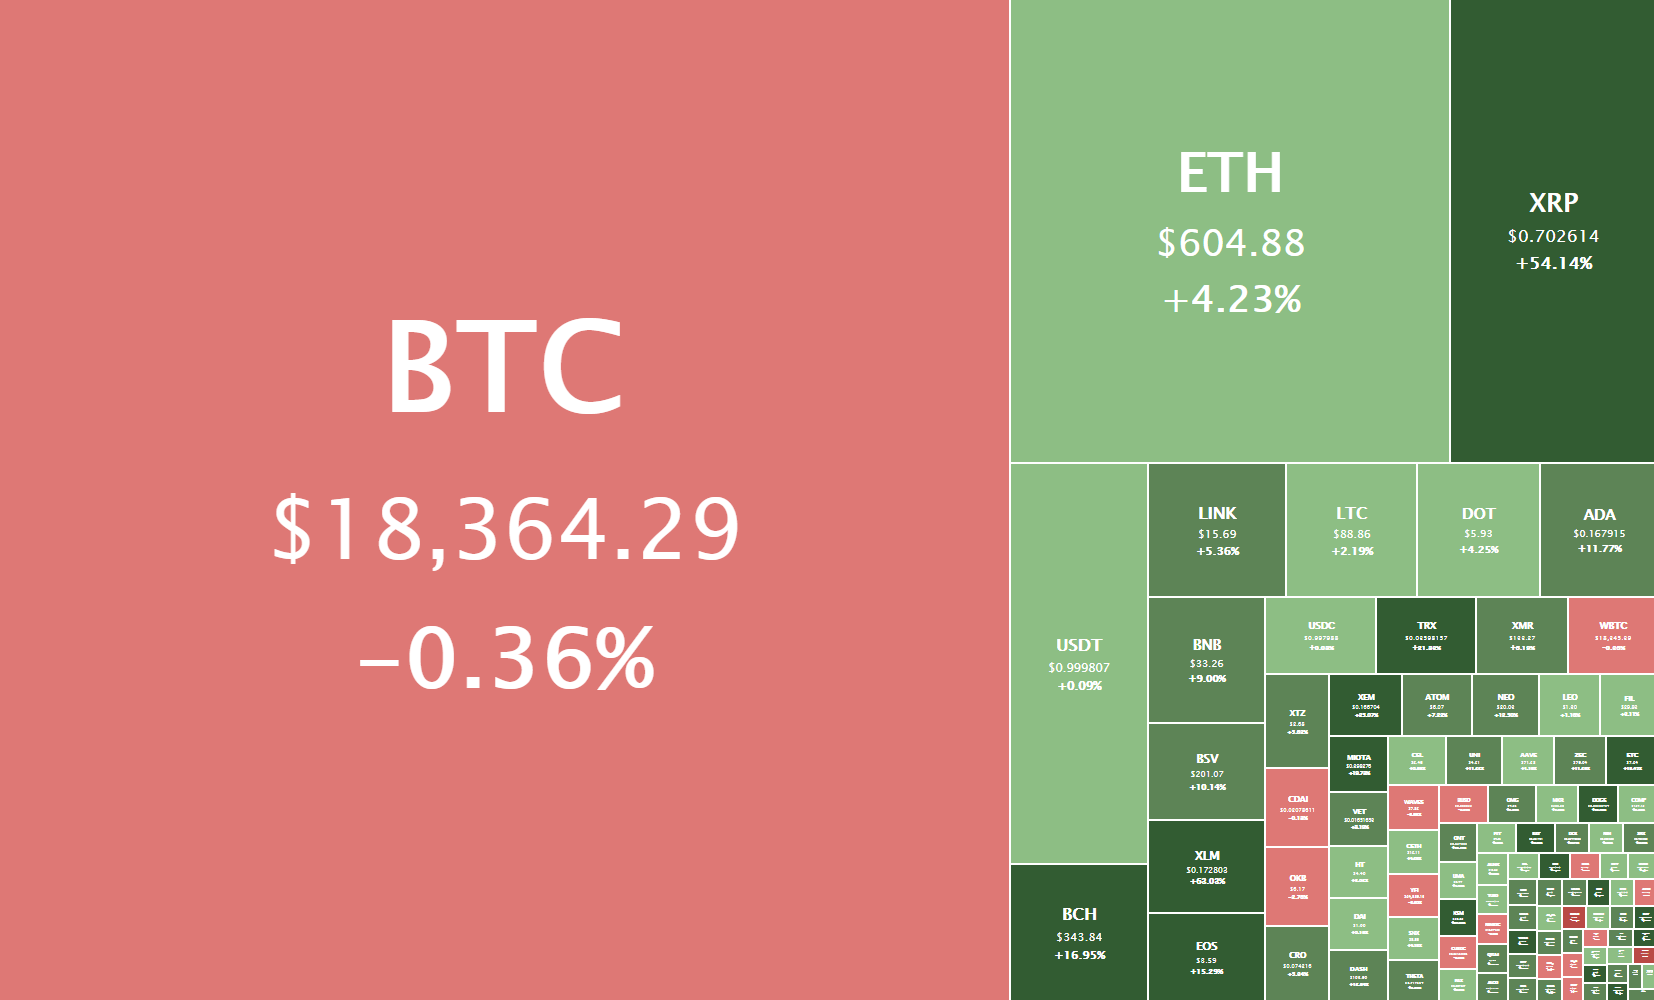
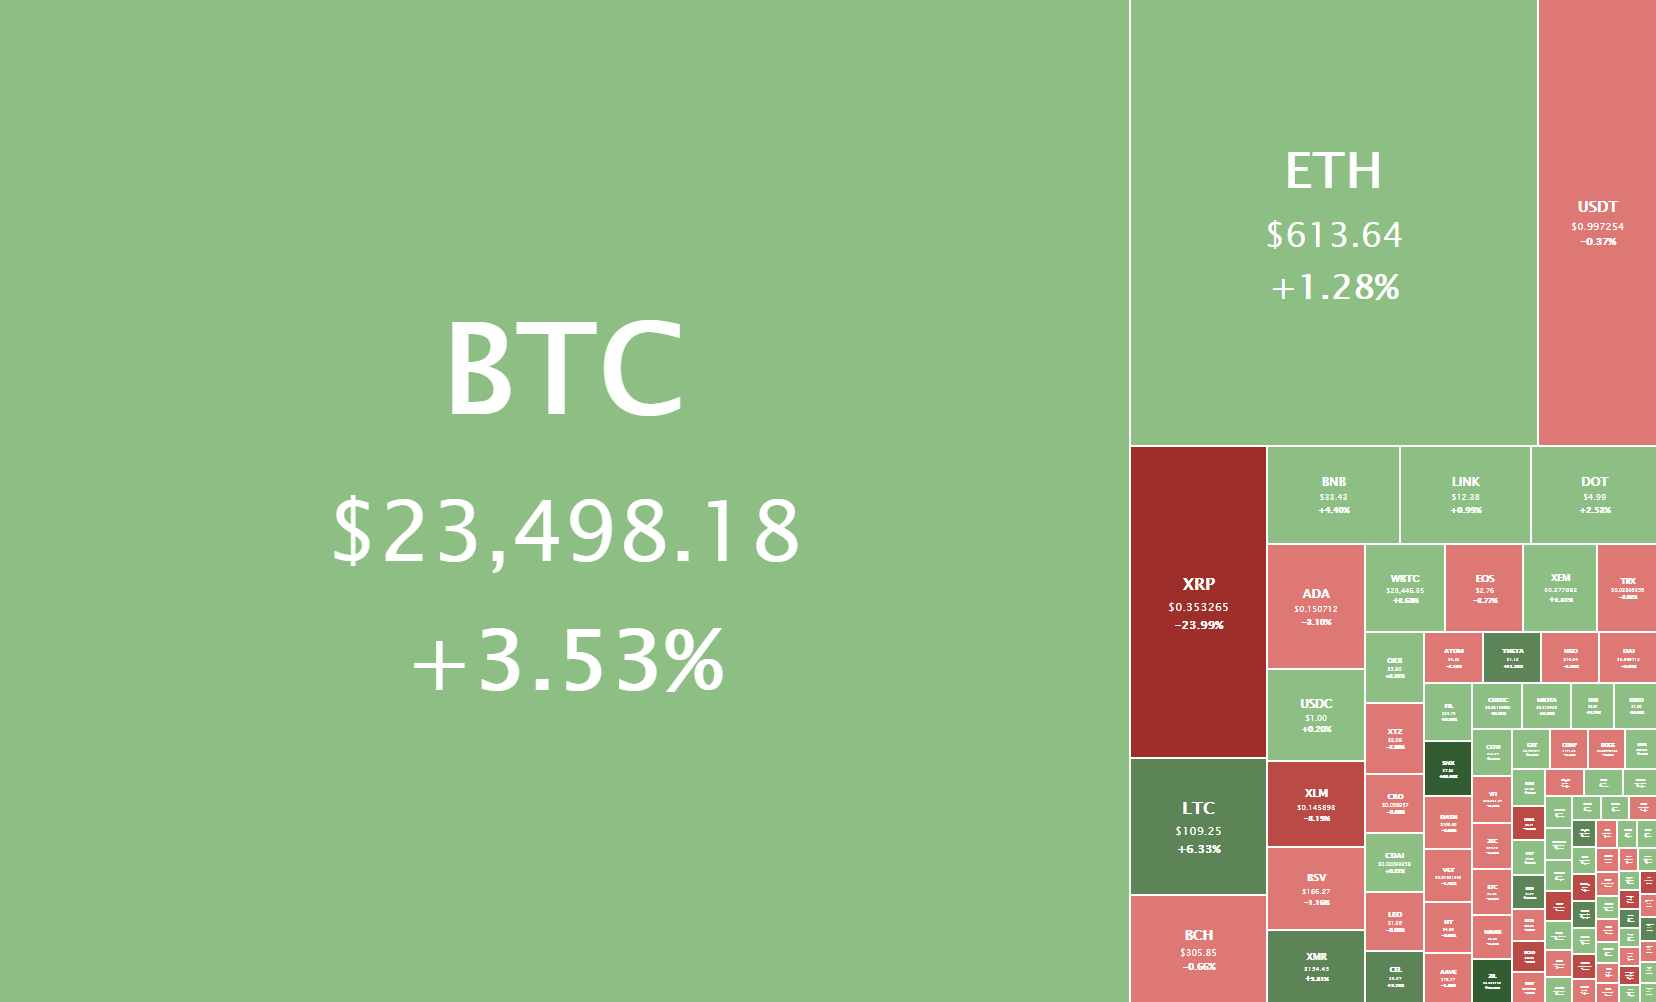
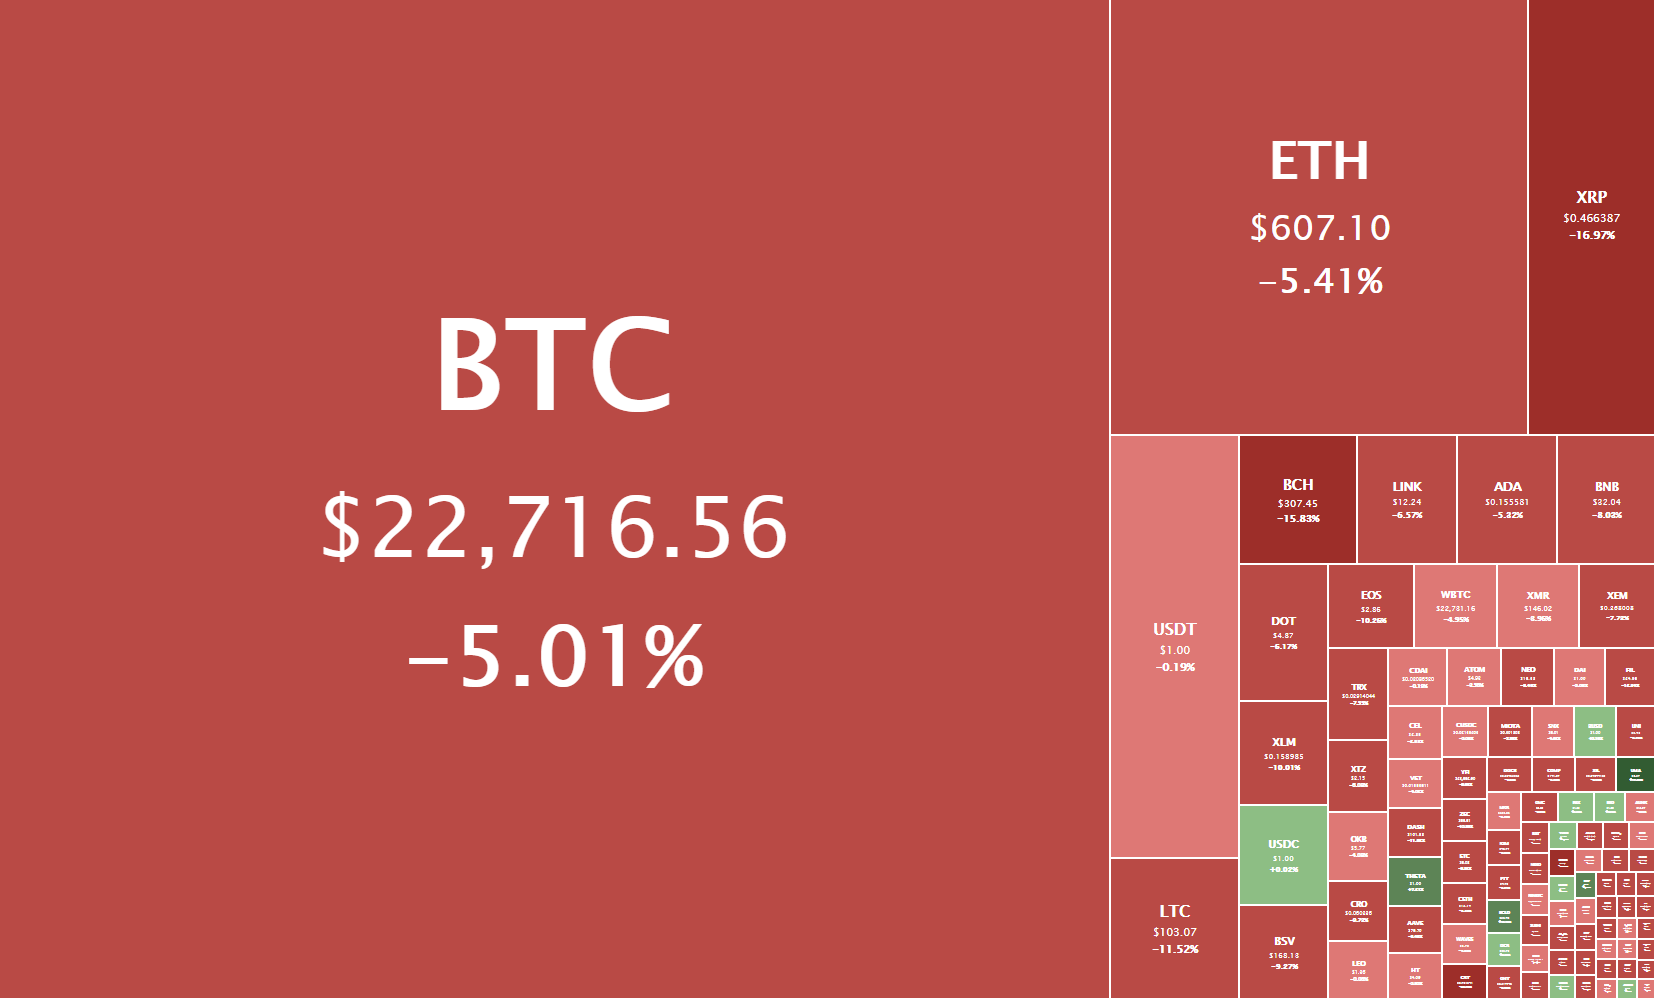
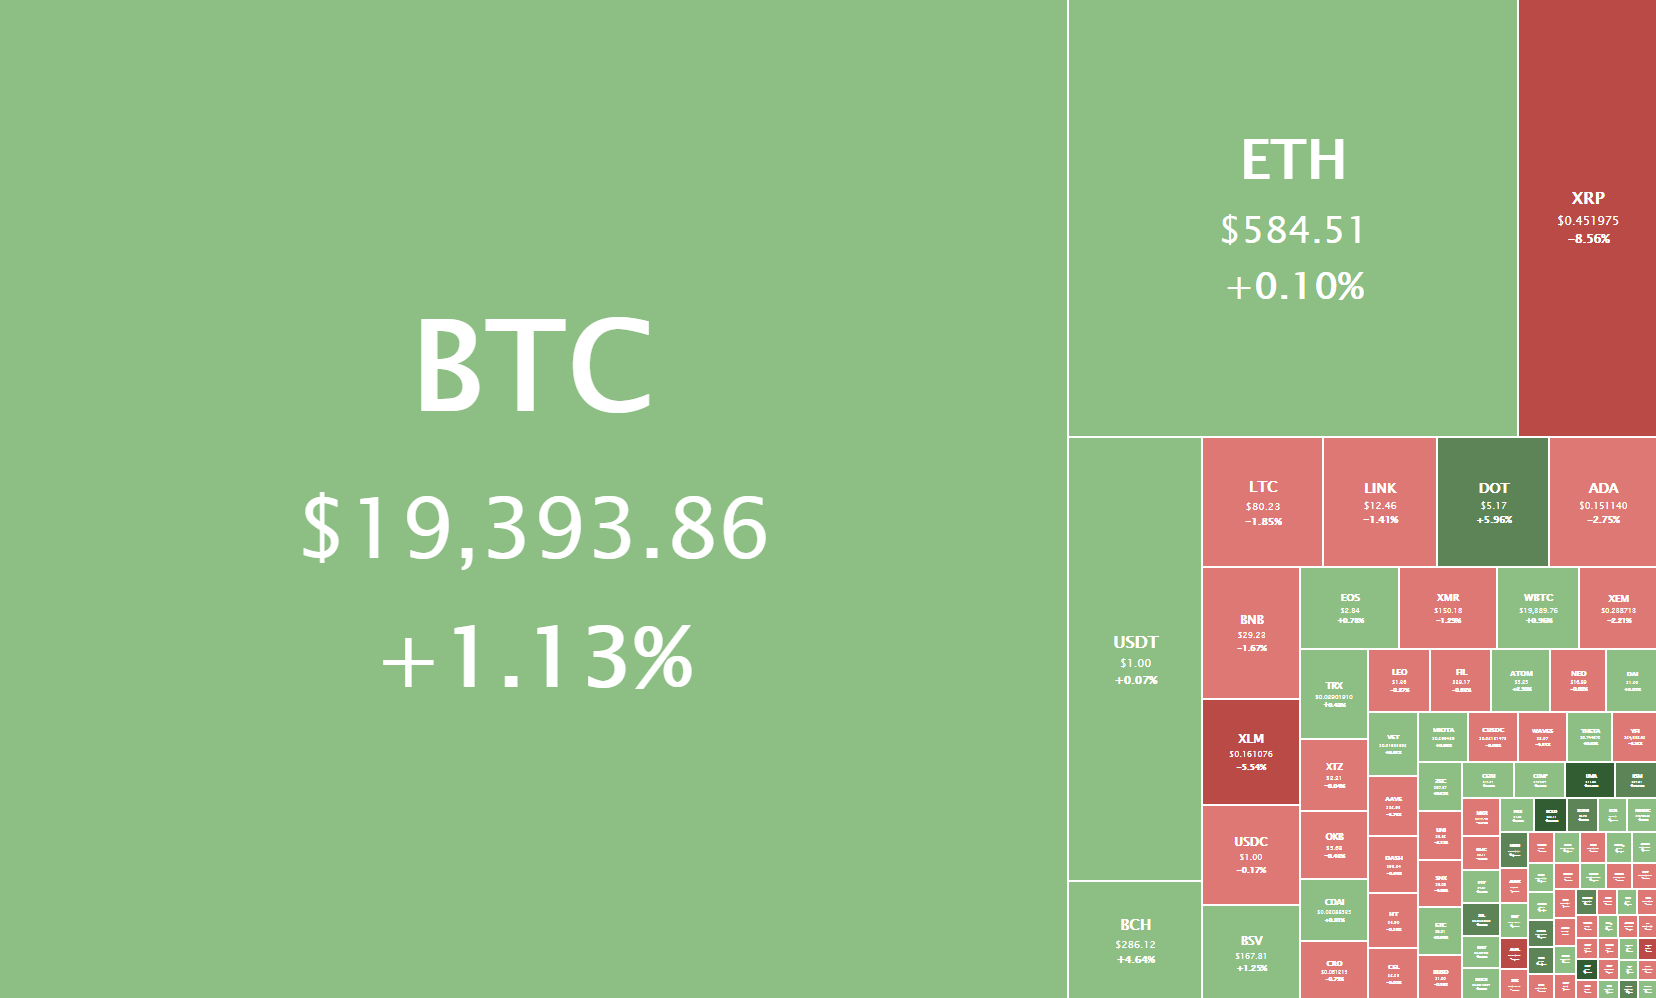
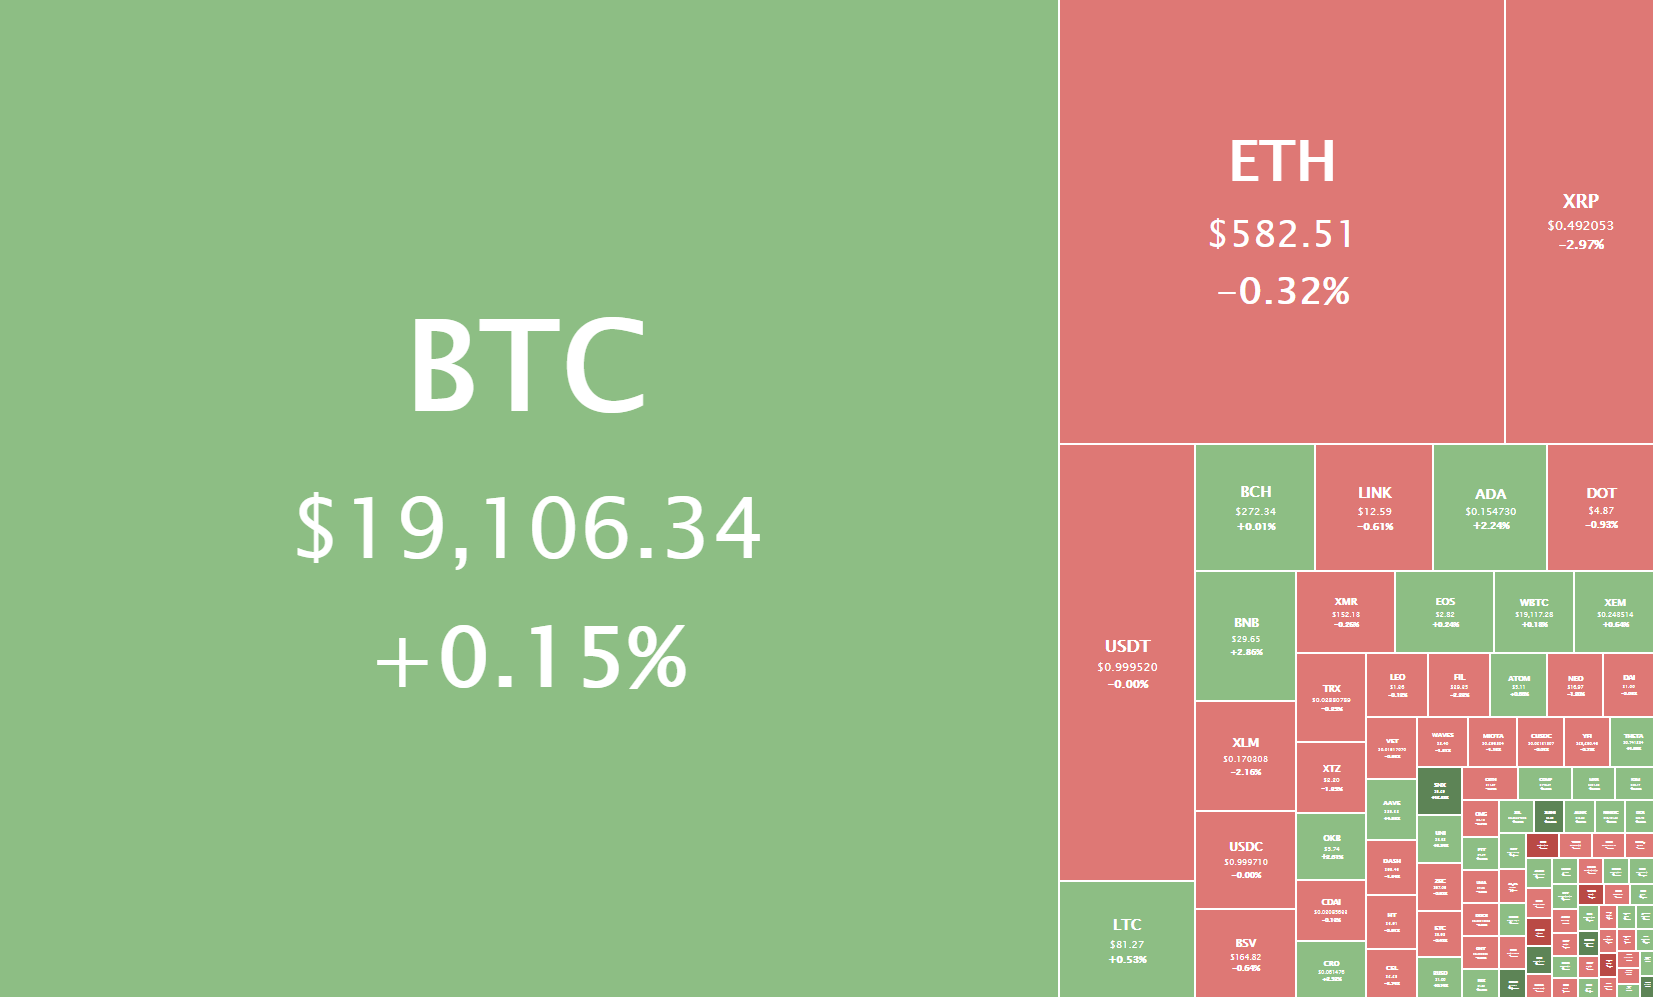
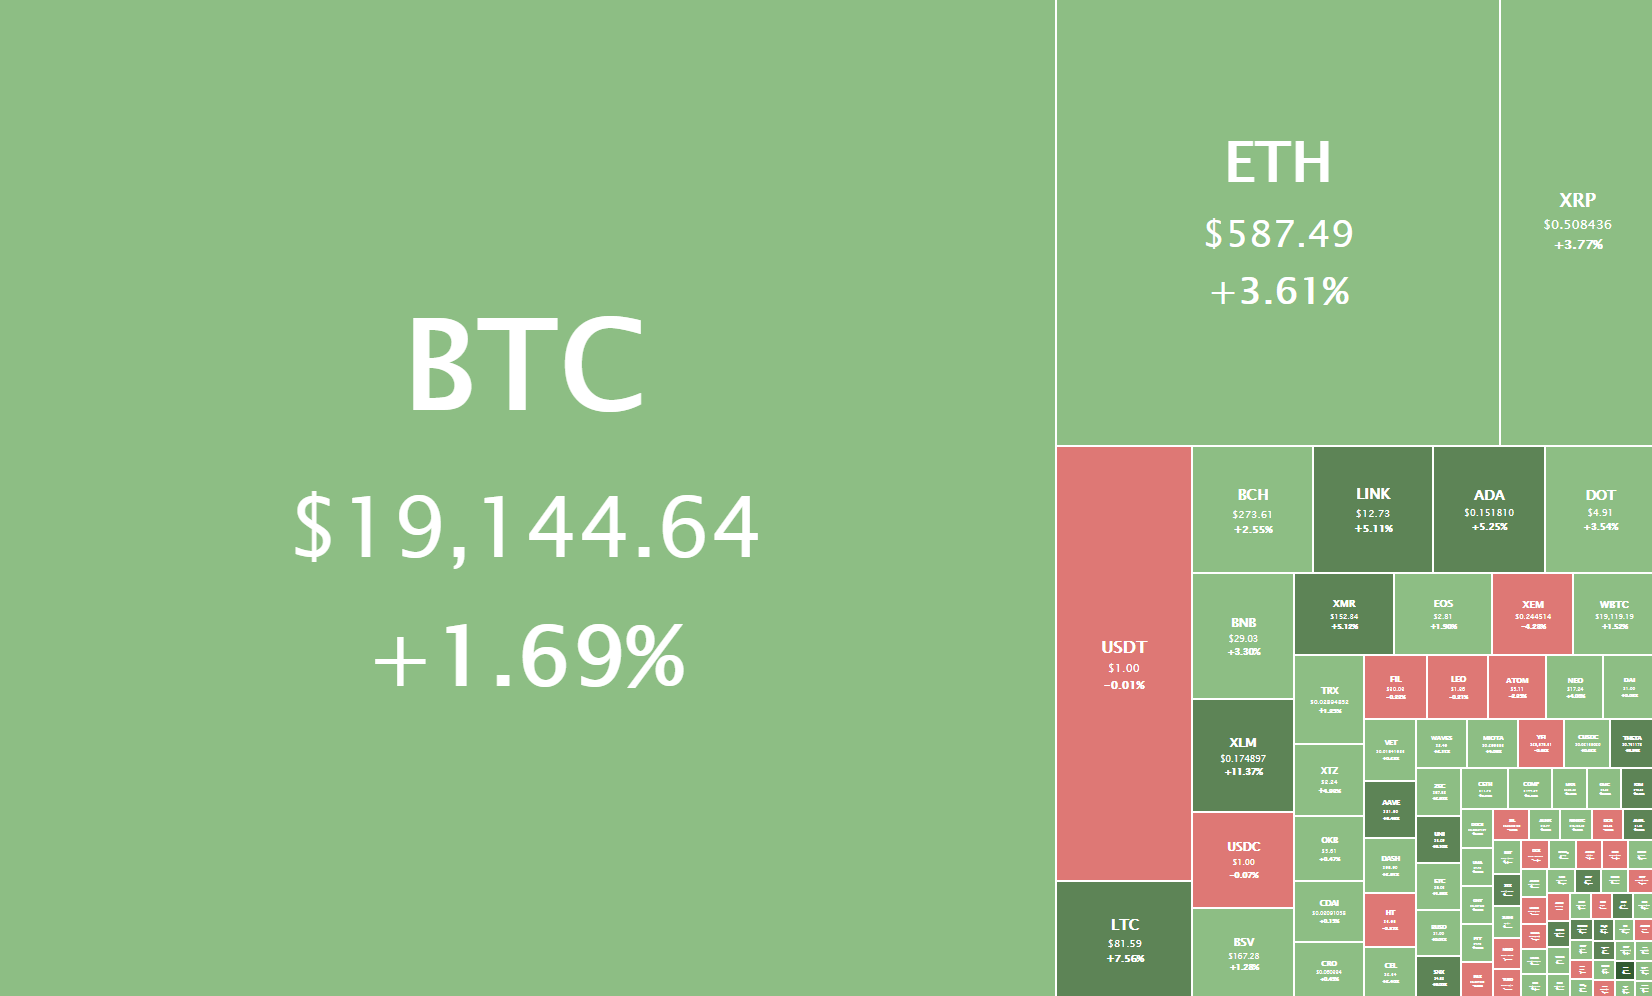
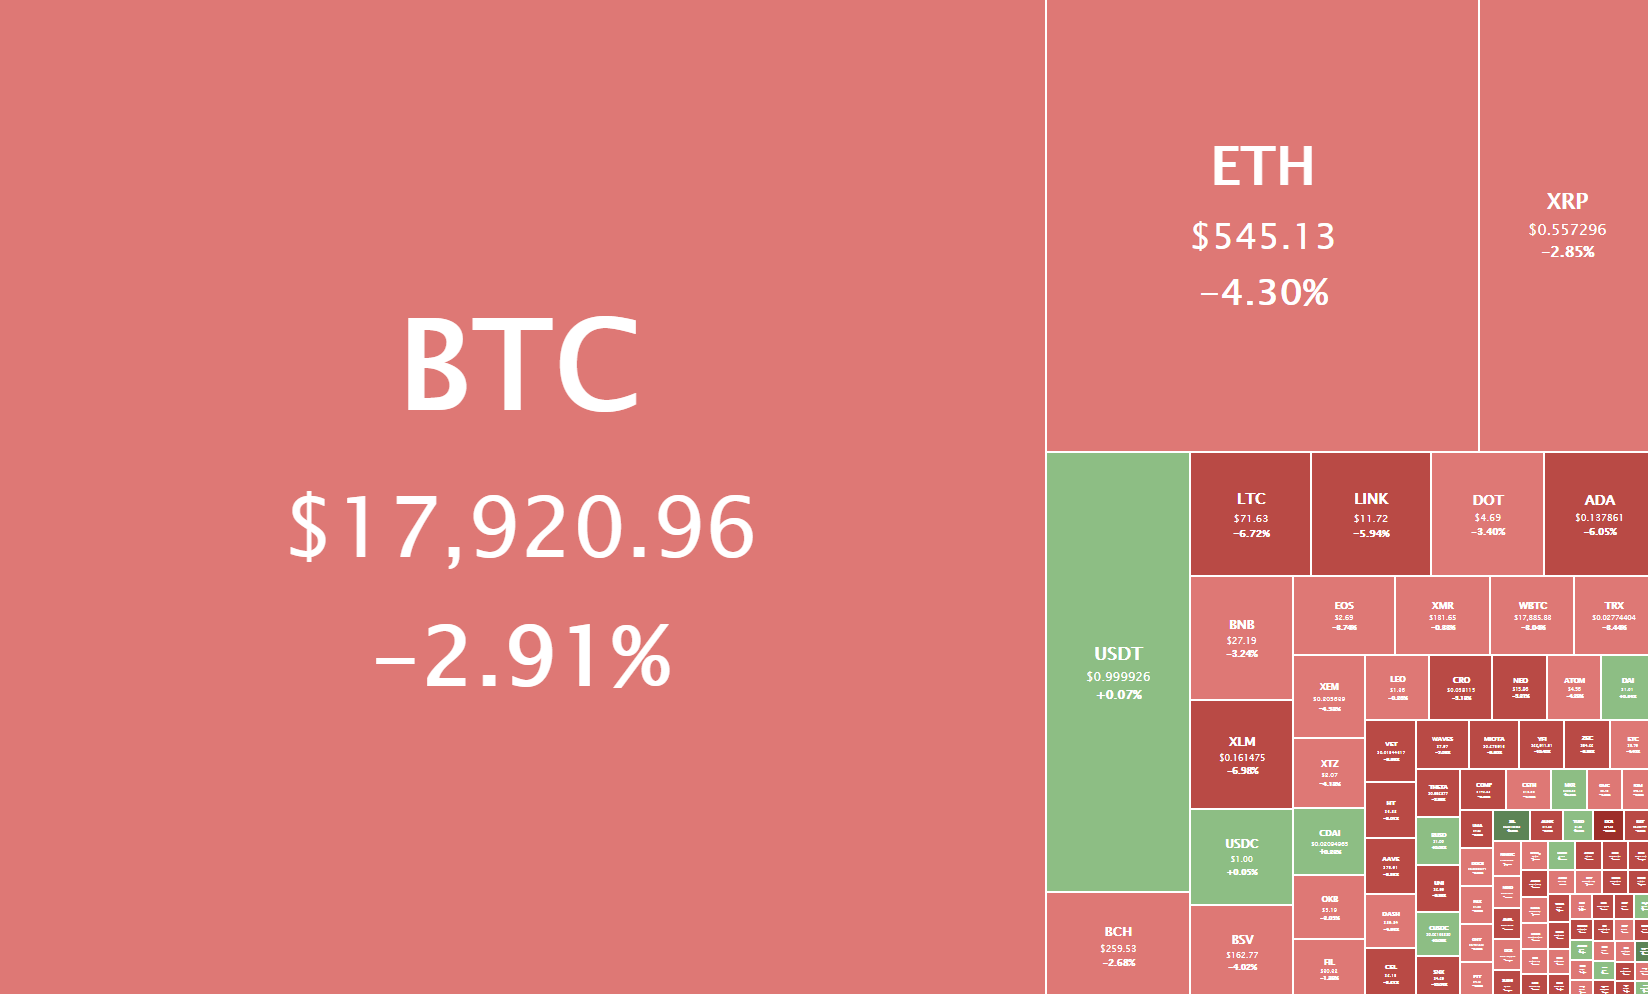
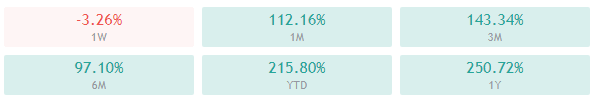
The cryptocurrency sector reacted to XRP getting crushed by the market and ended up mostly in the red. Bitcoin is currently trading for $23,112, representing a decrease of 1.97% when compared to yesterday’s value. Meanwhile, Ethereum’s price has decreased by 6.27% on the day, while XRP managed to lose a whopping 30.85%.
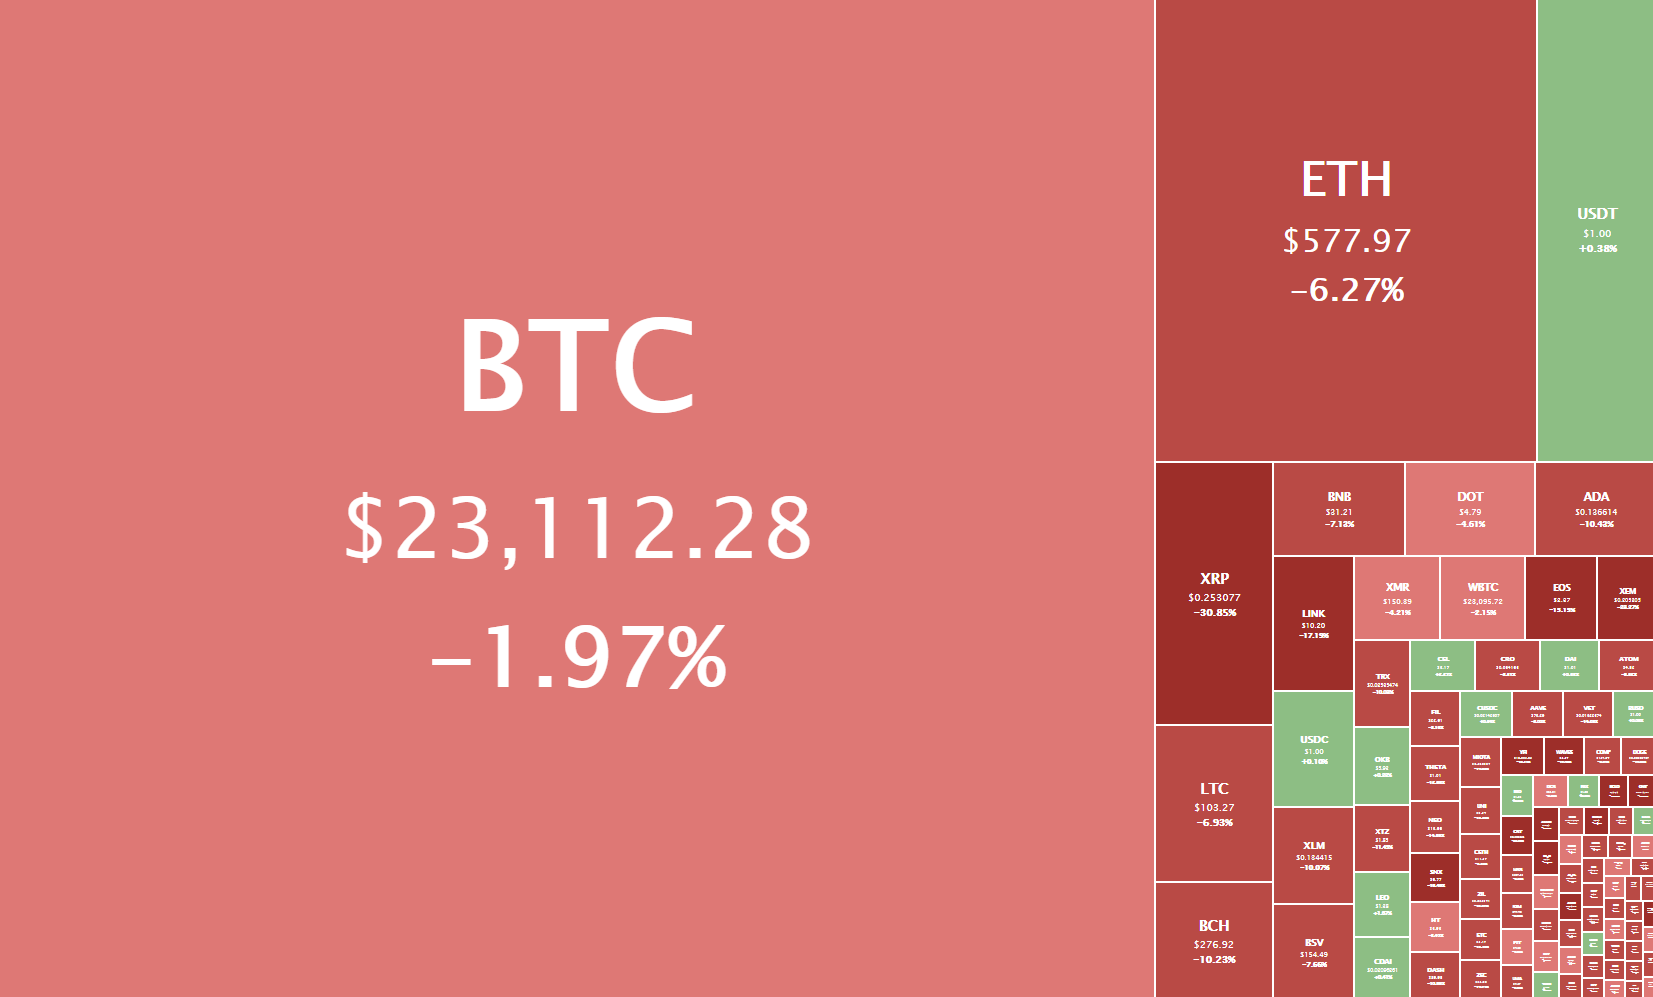
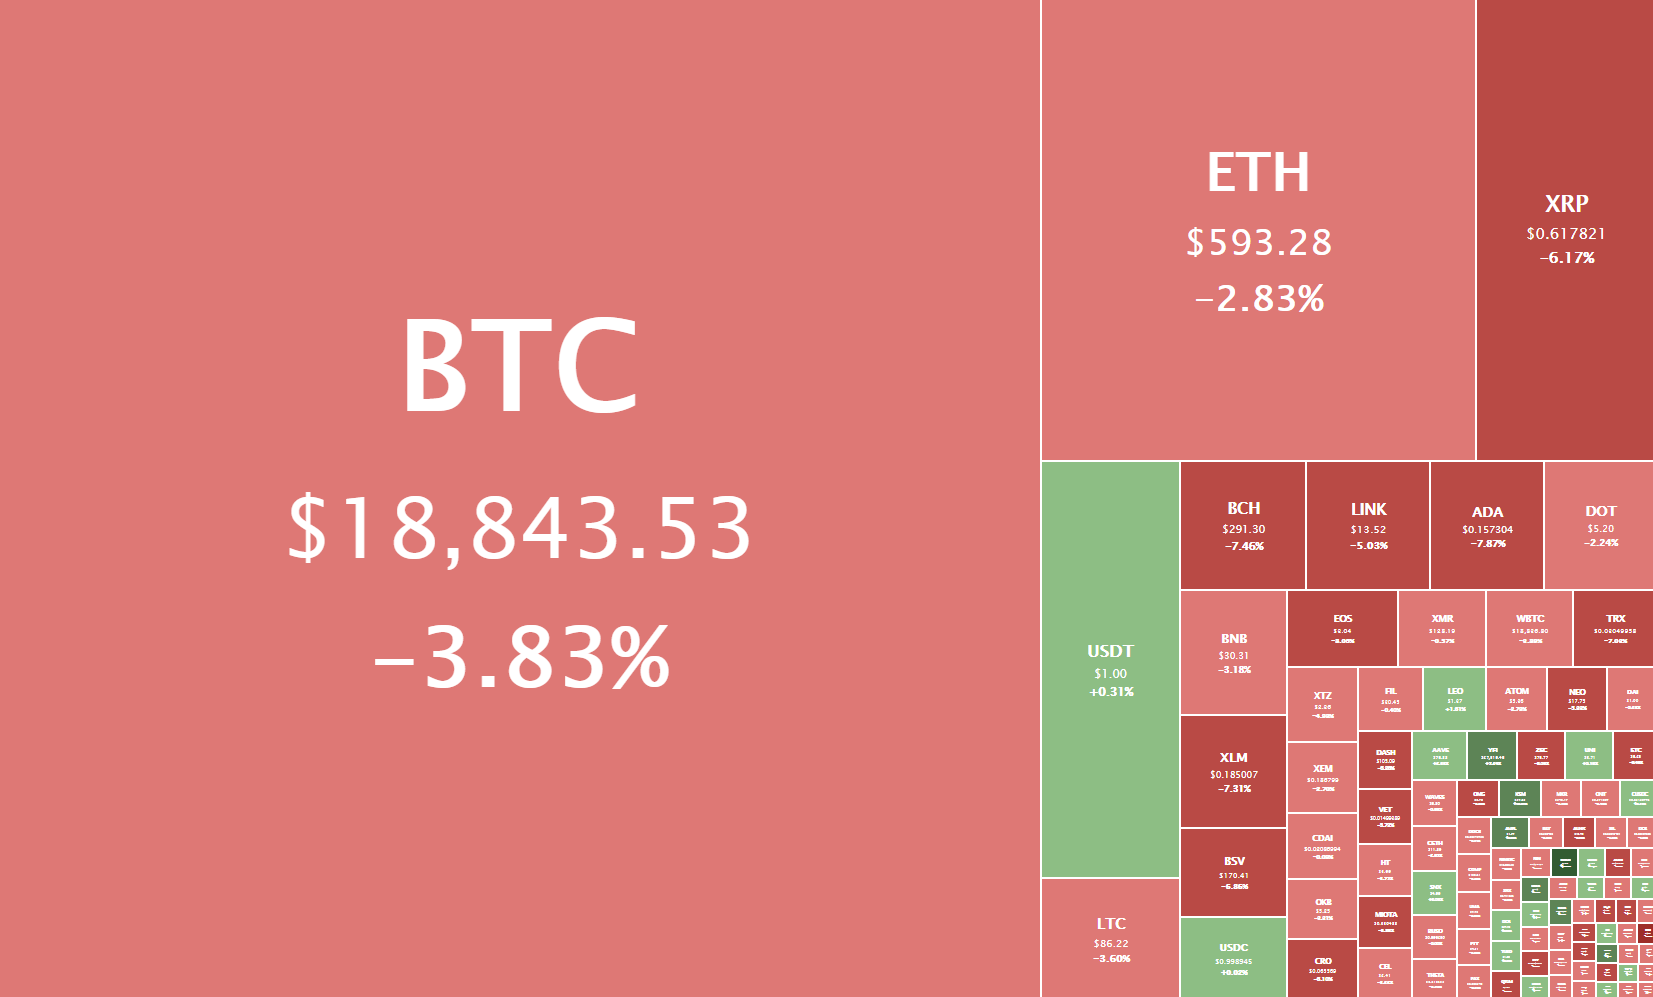
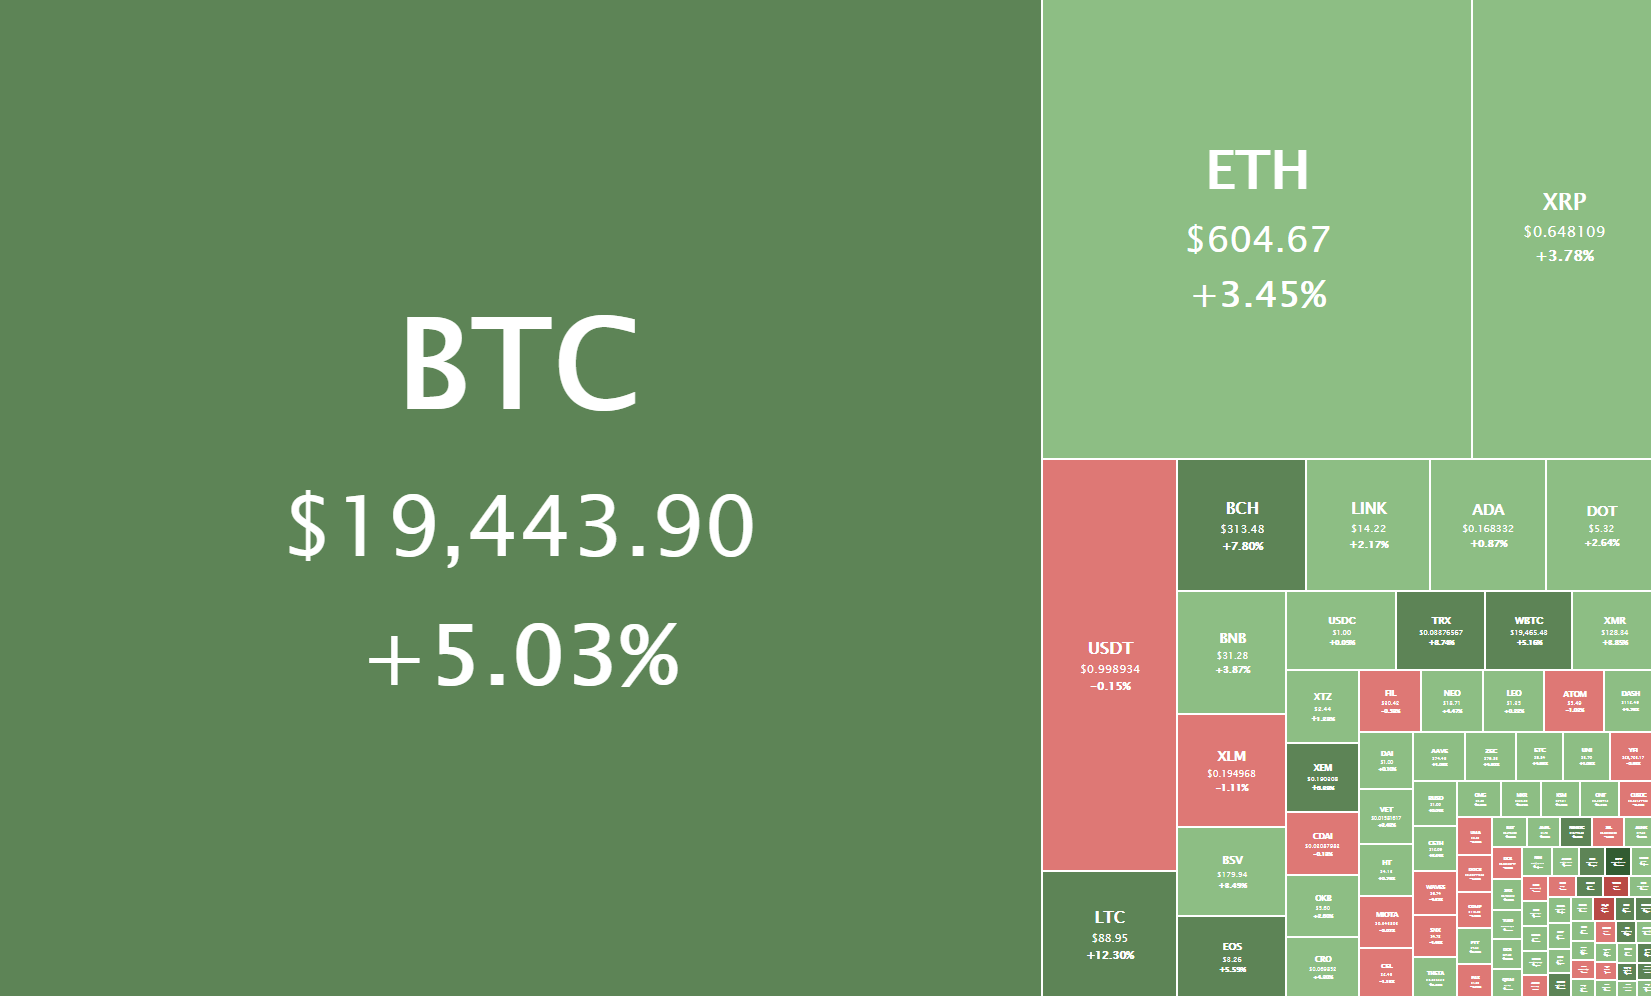
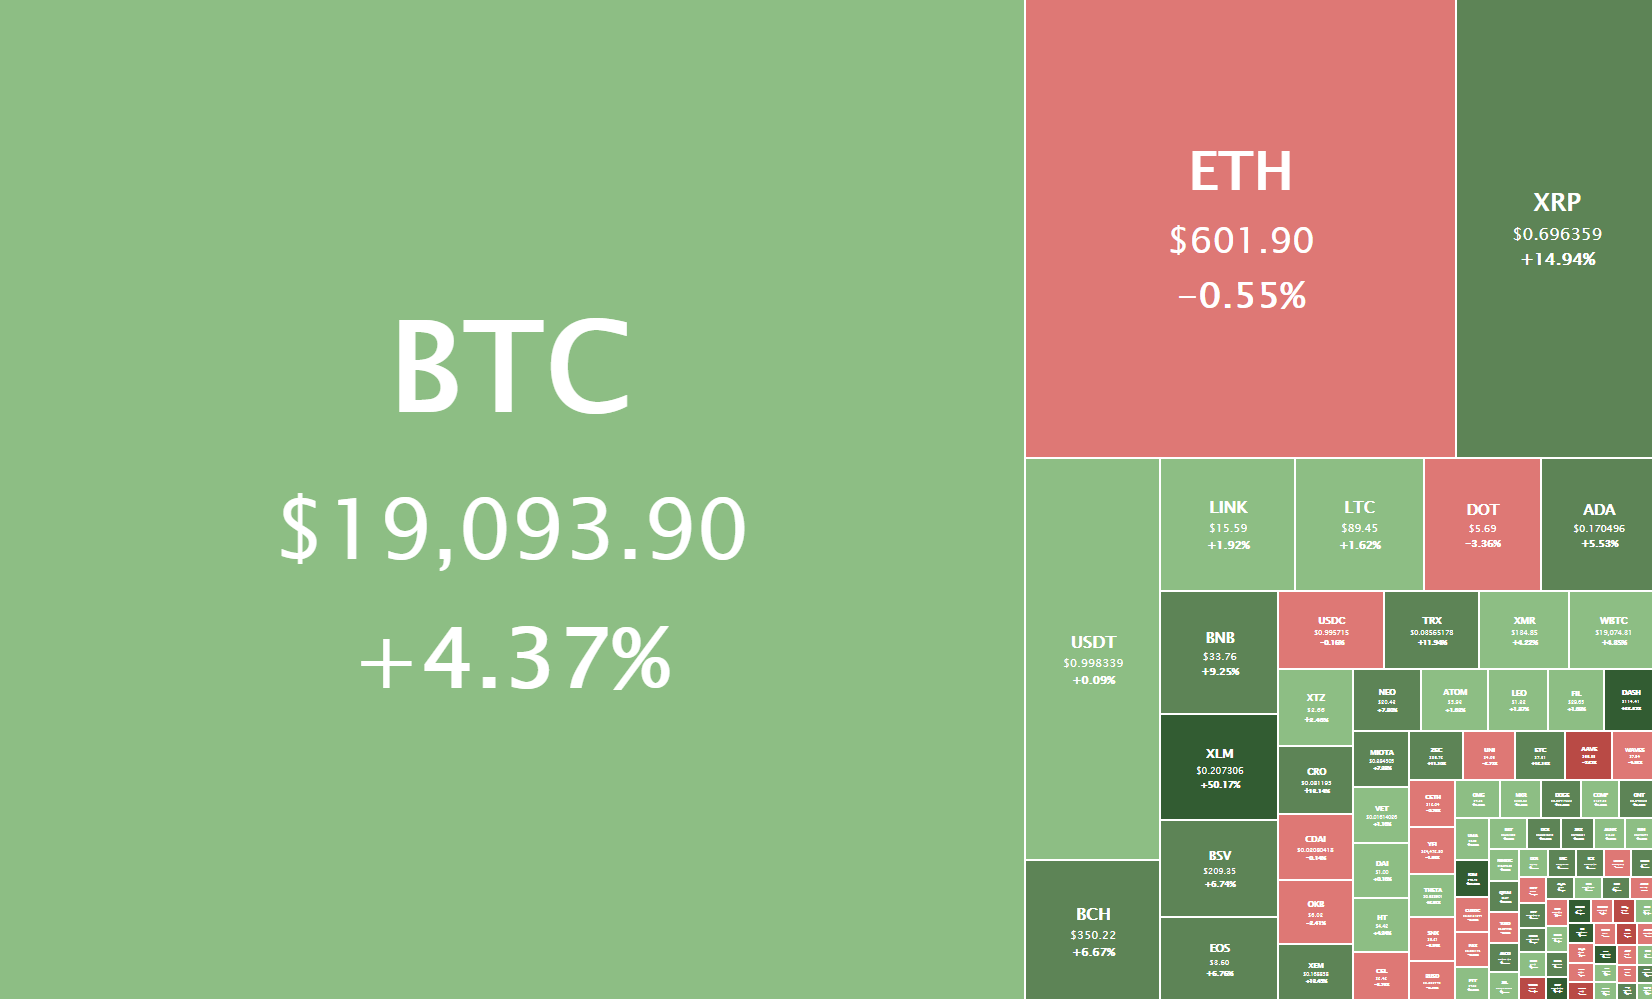
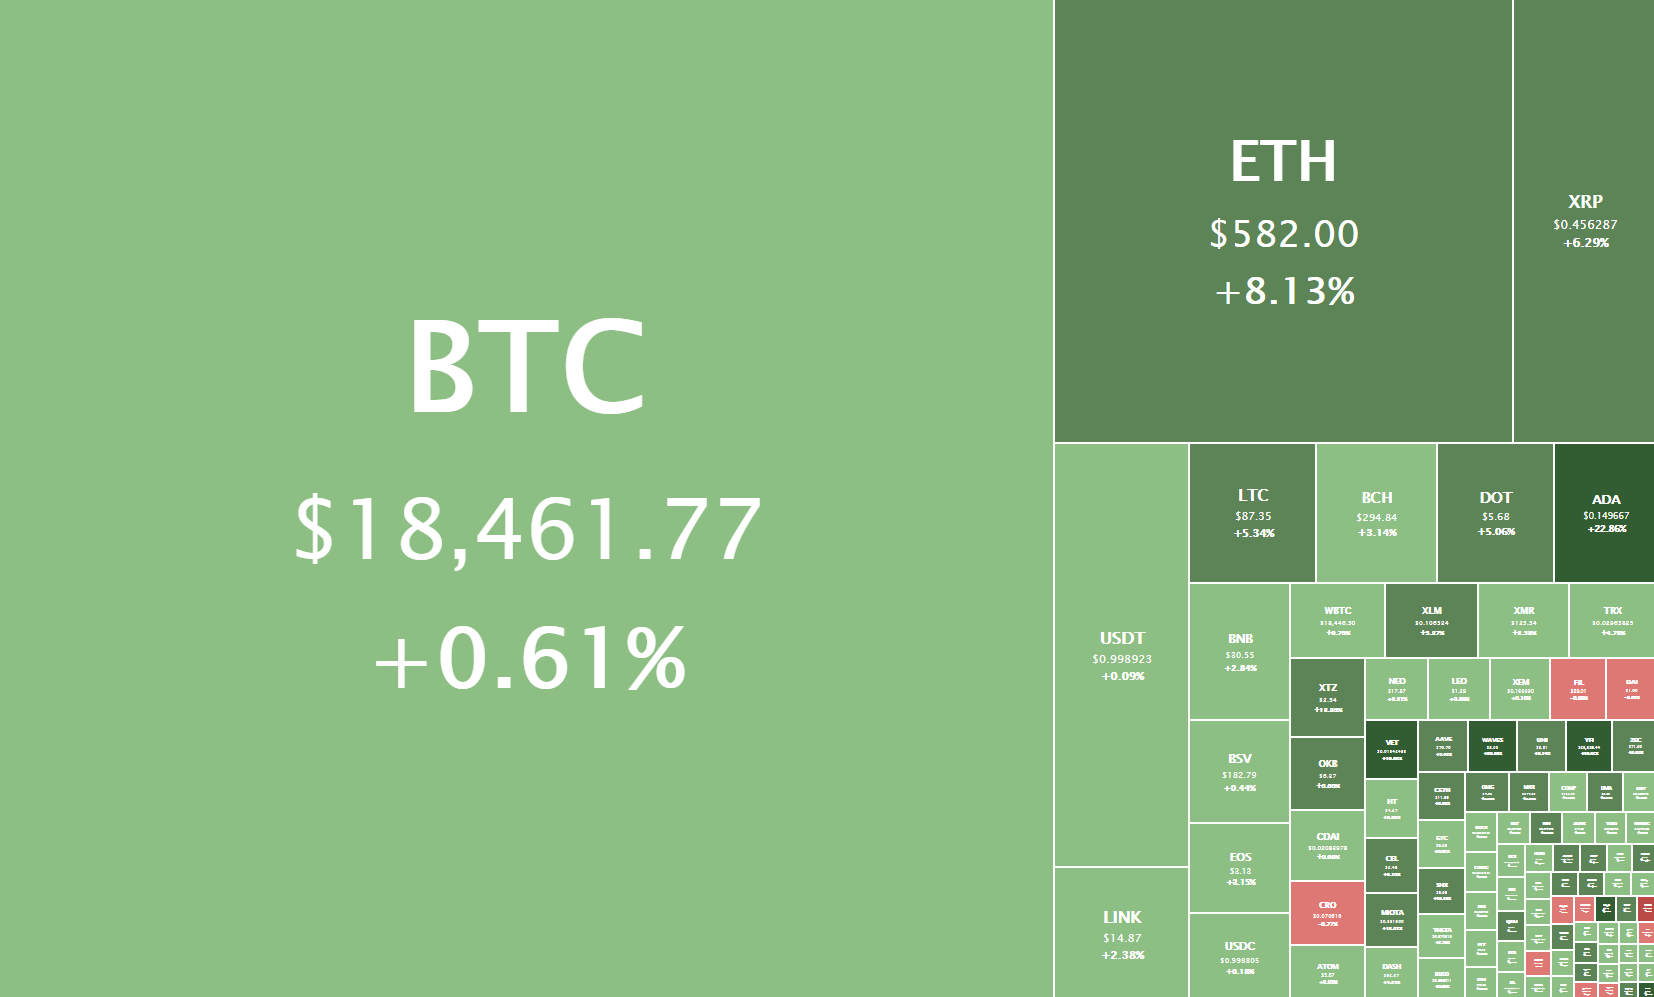
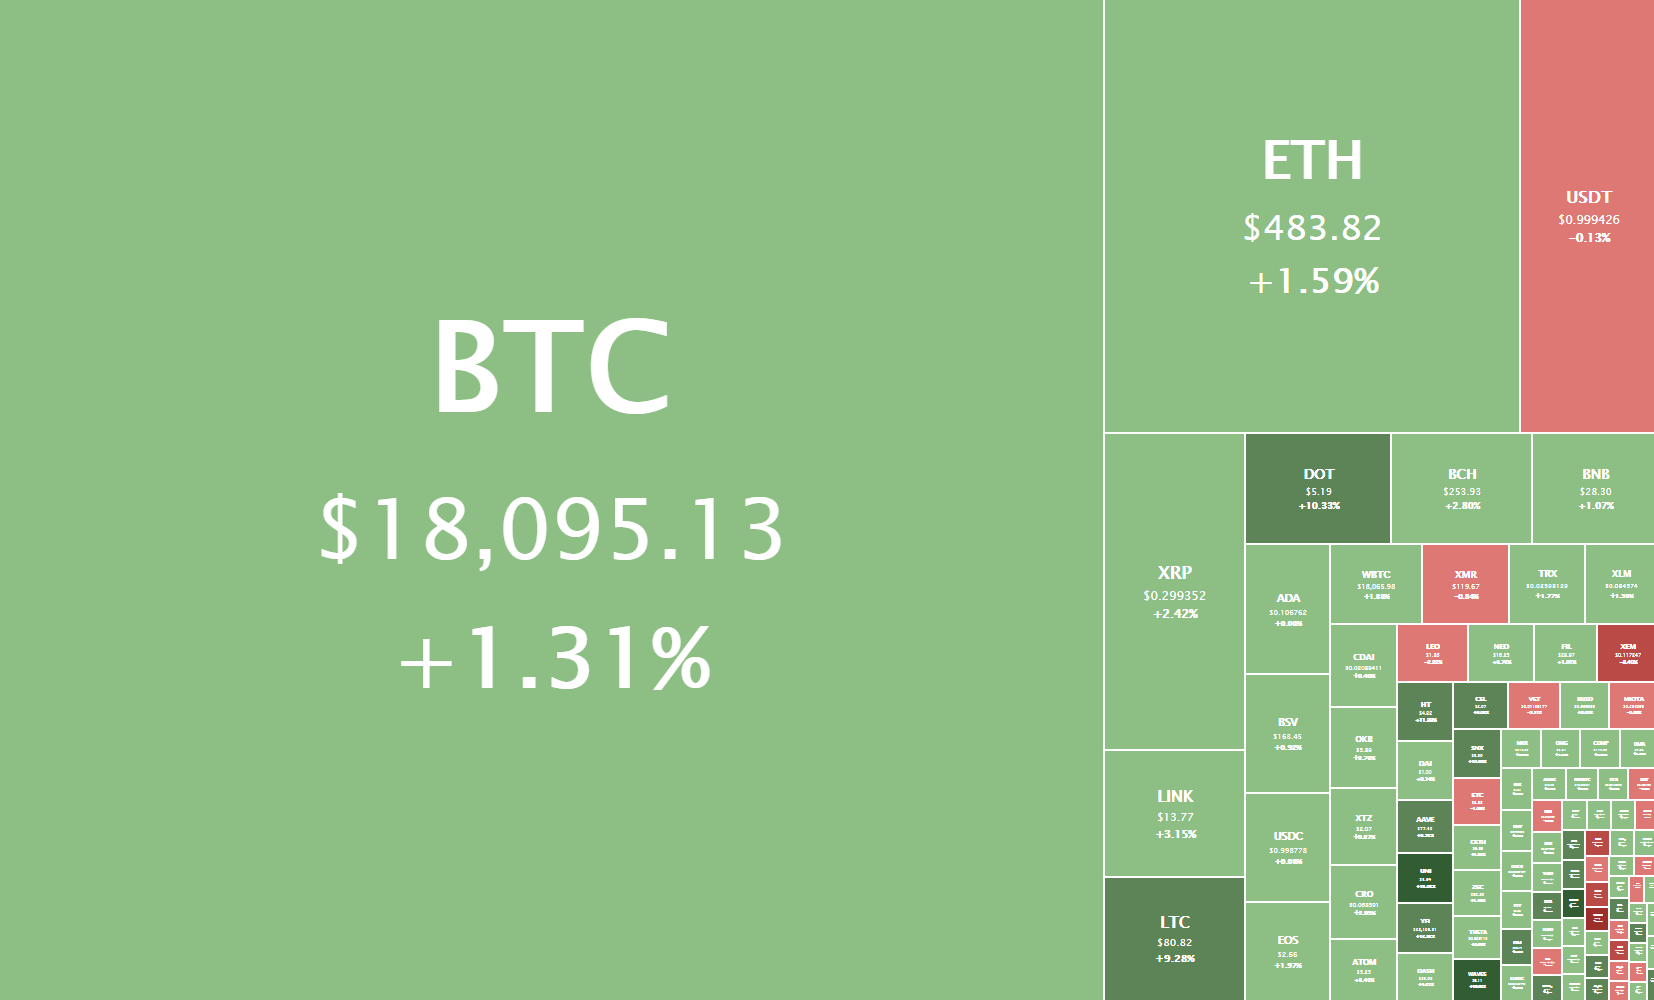
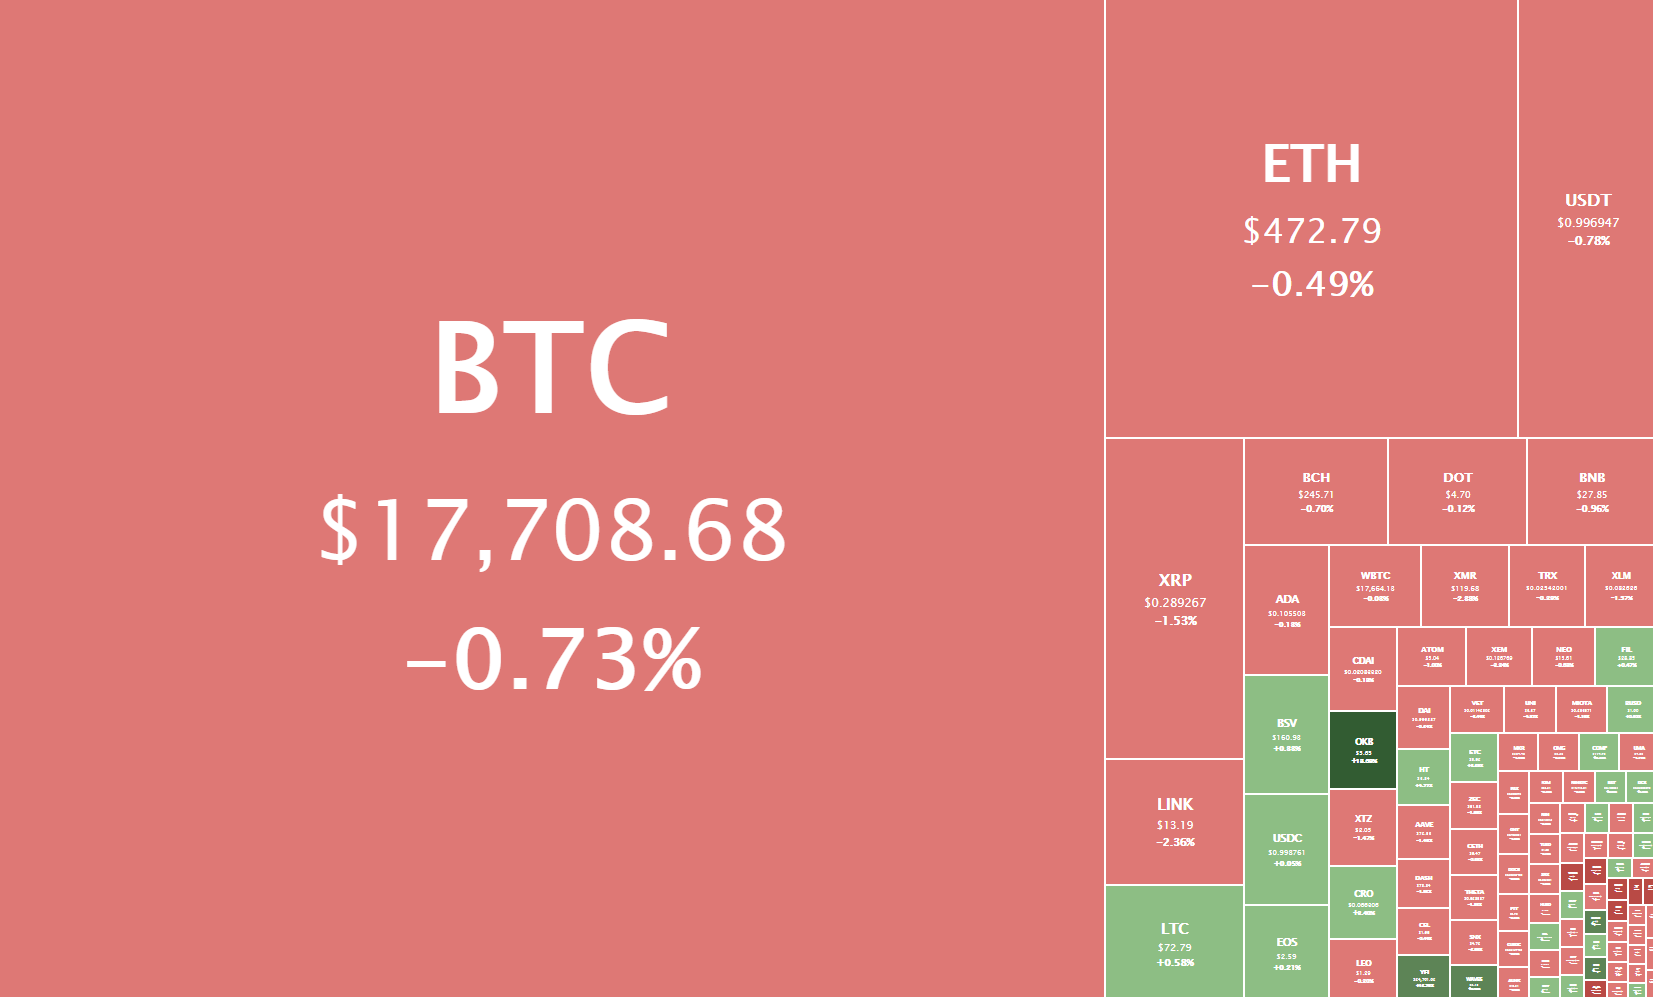
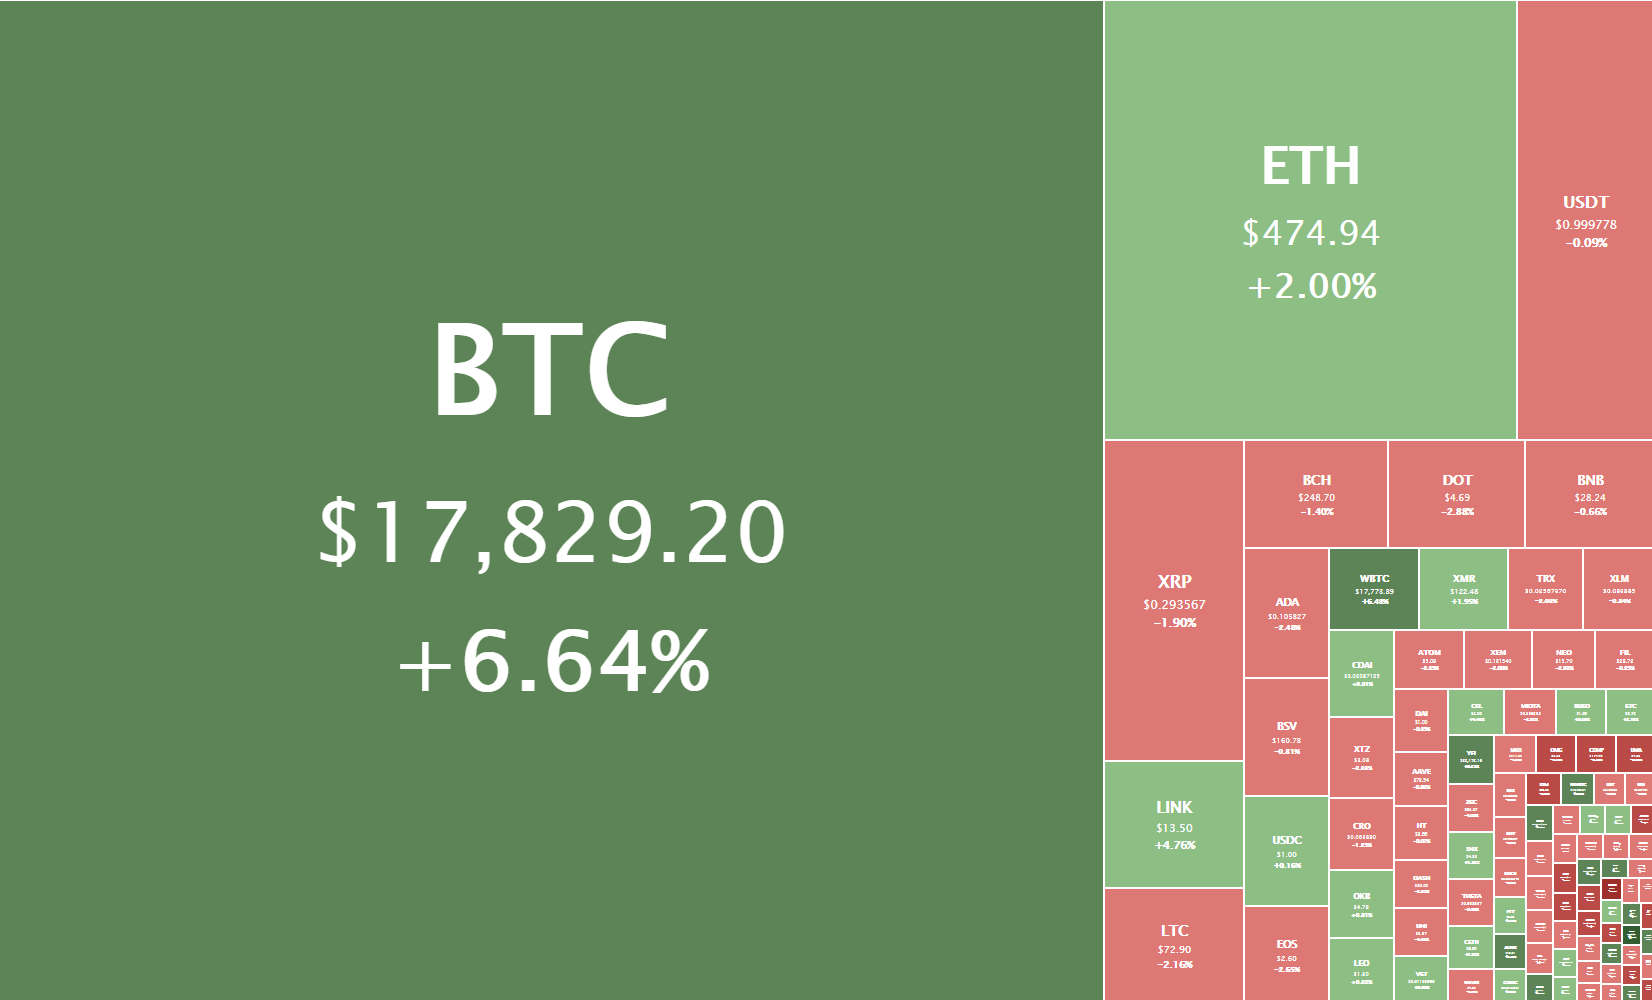
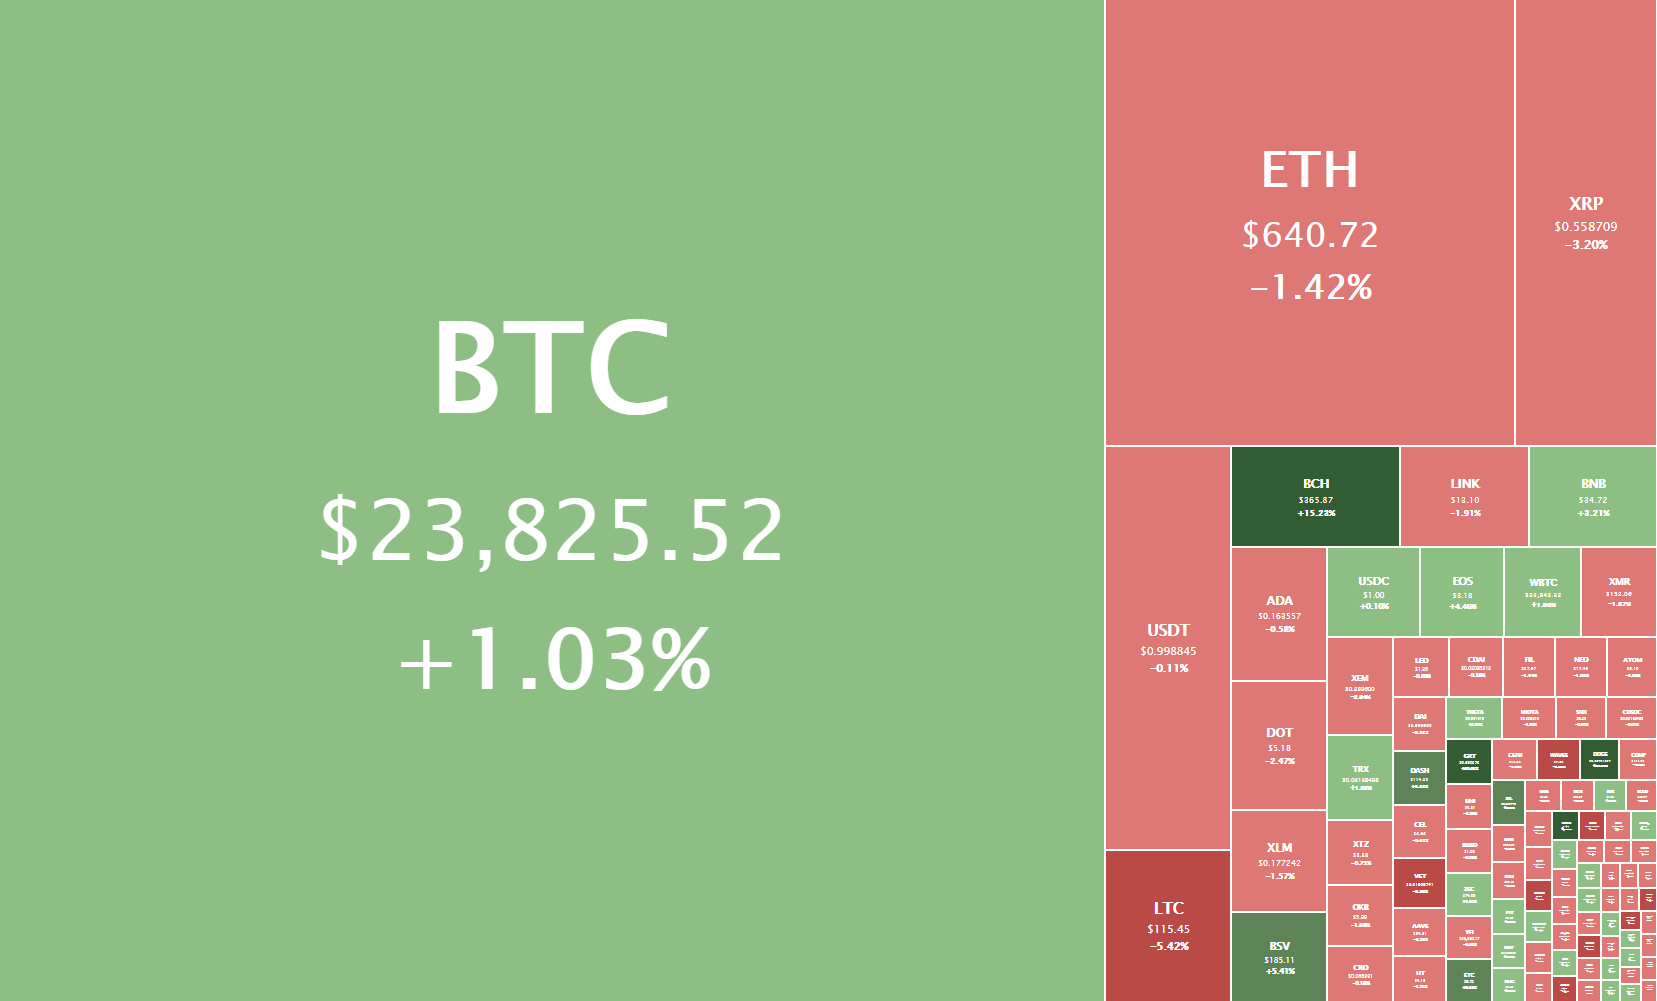
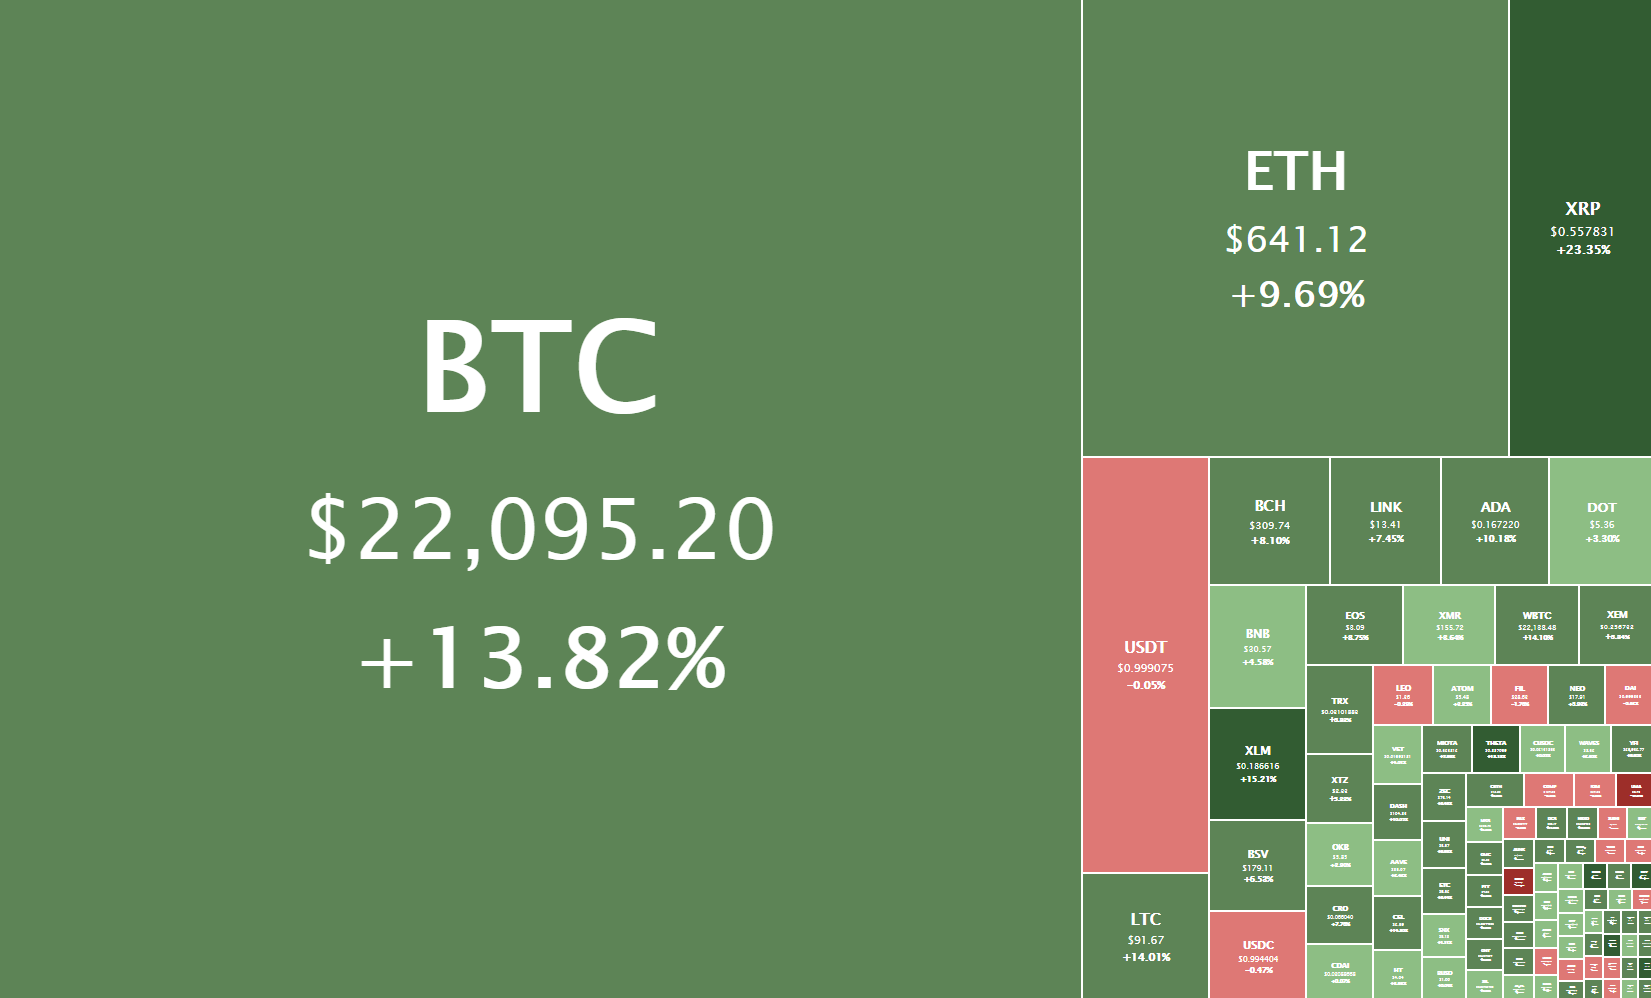
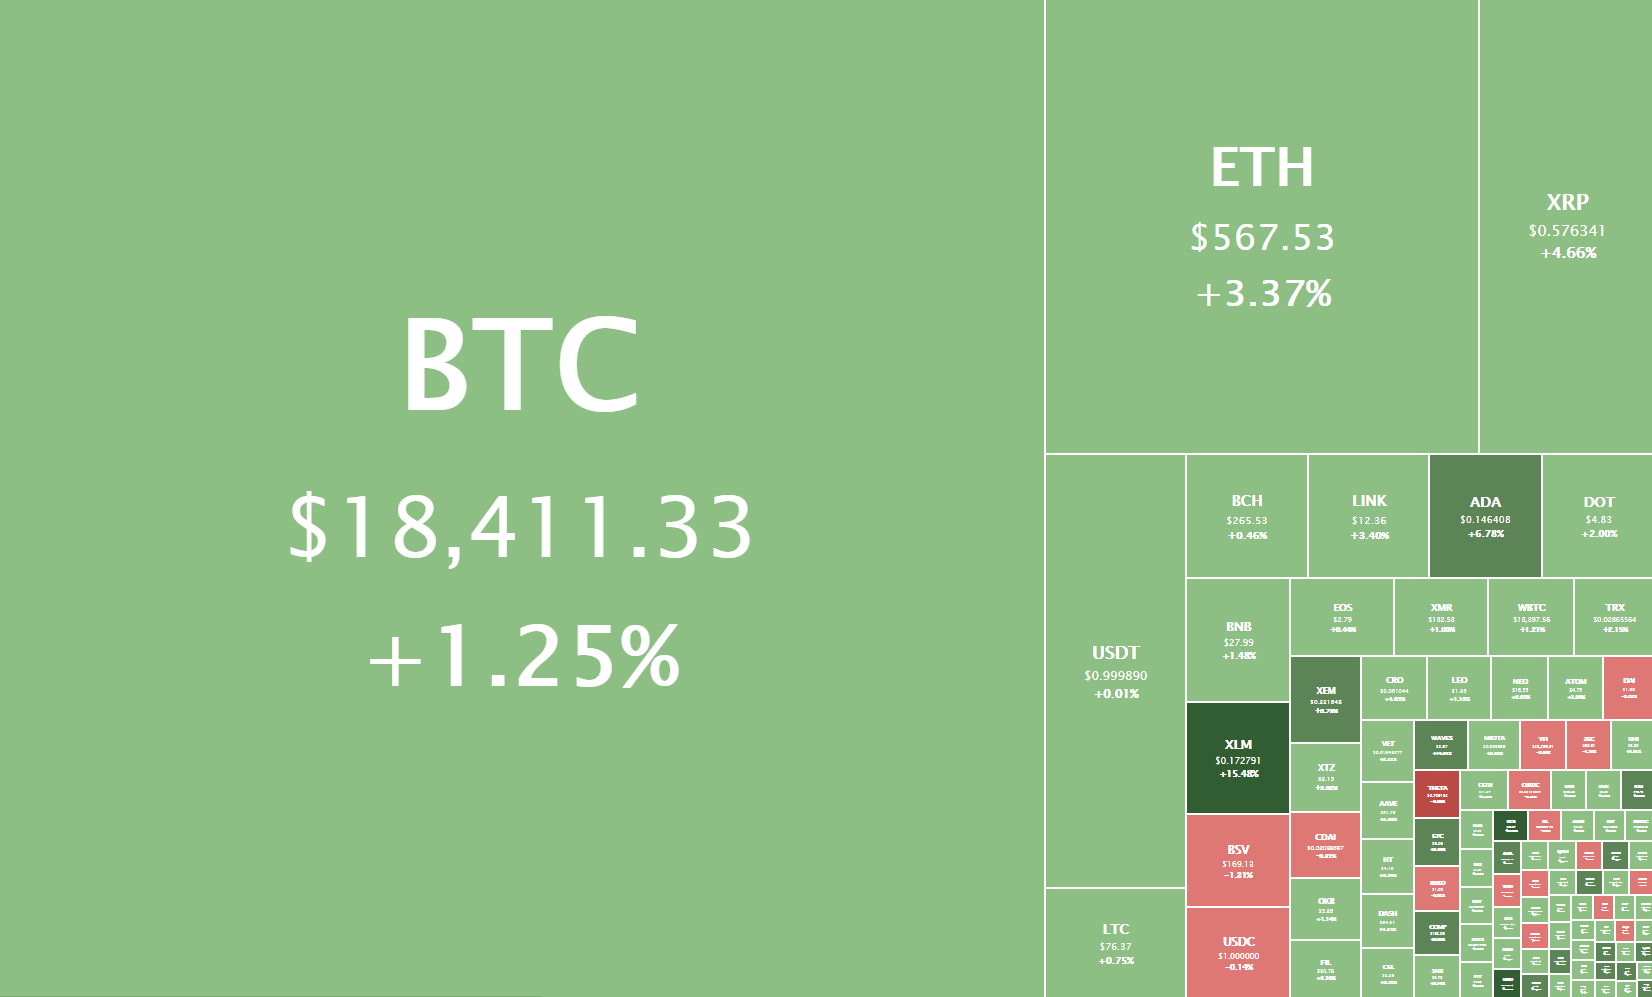
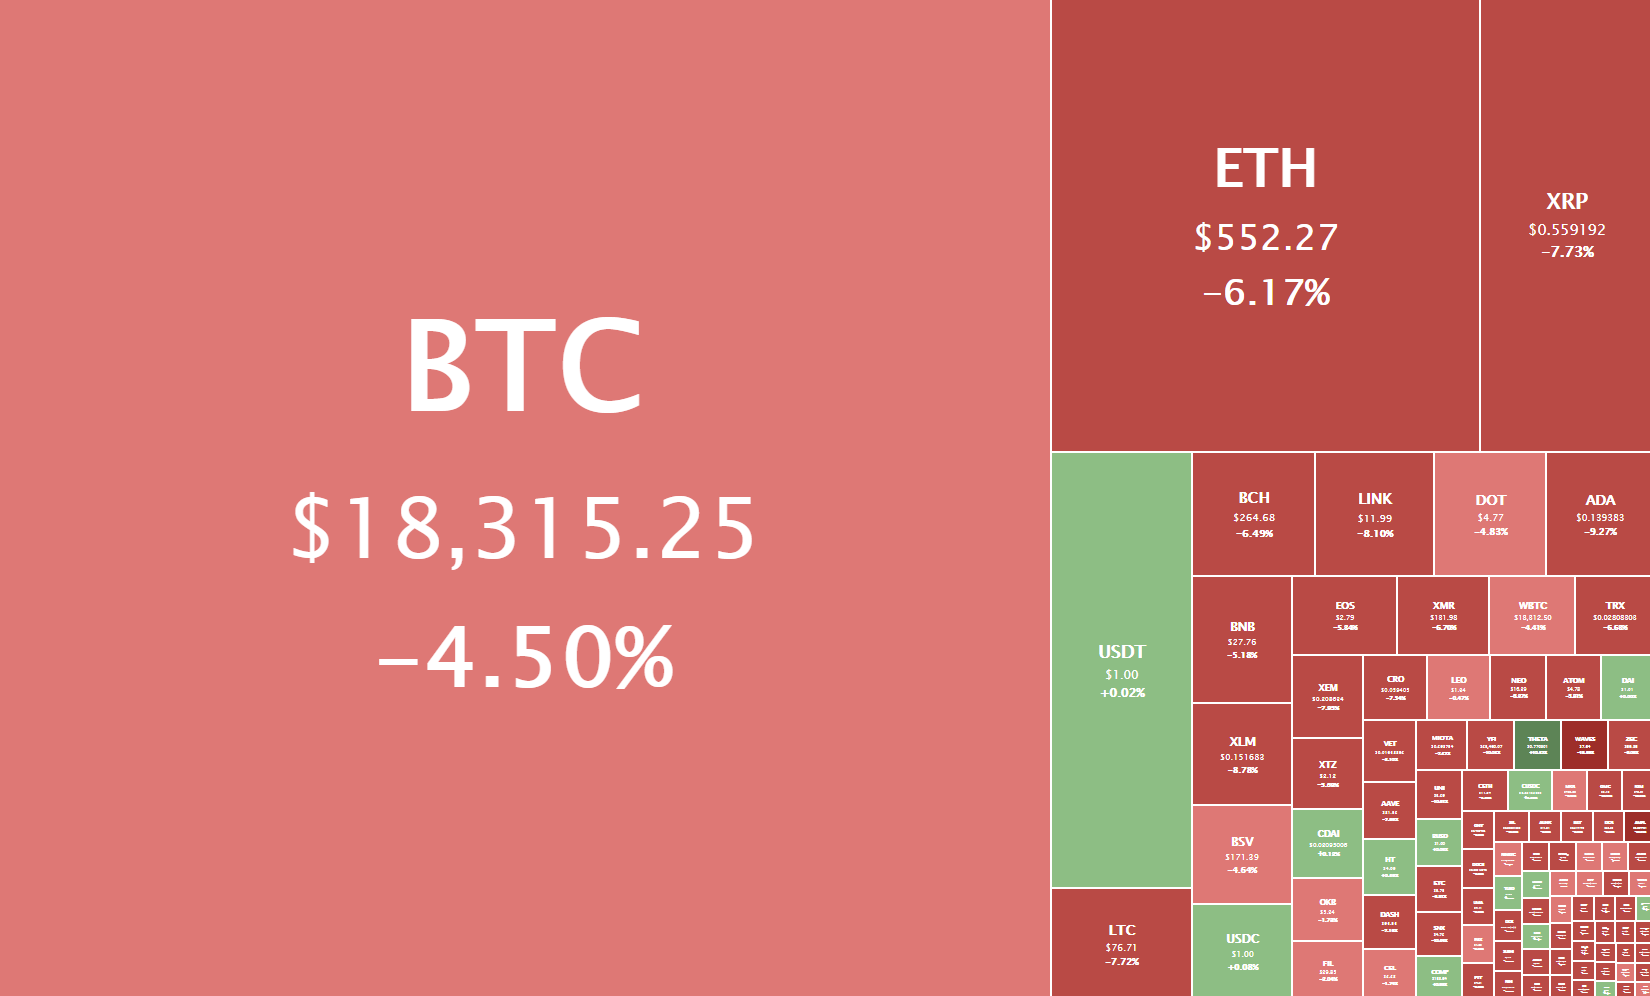
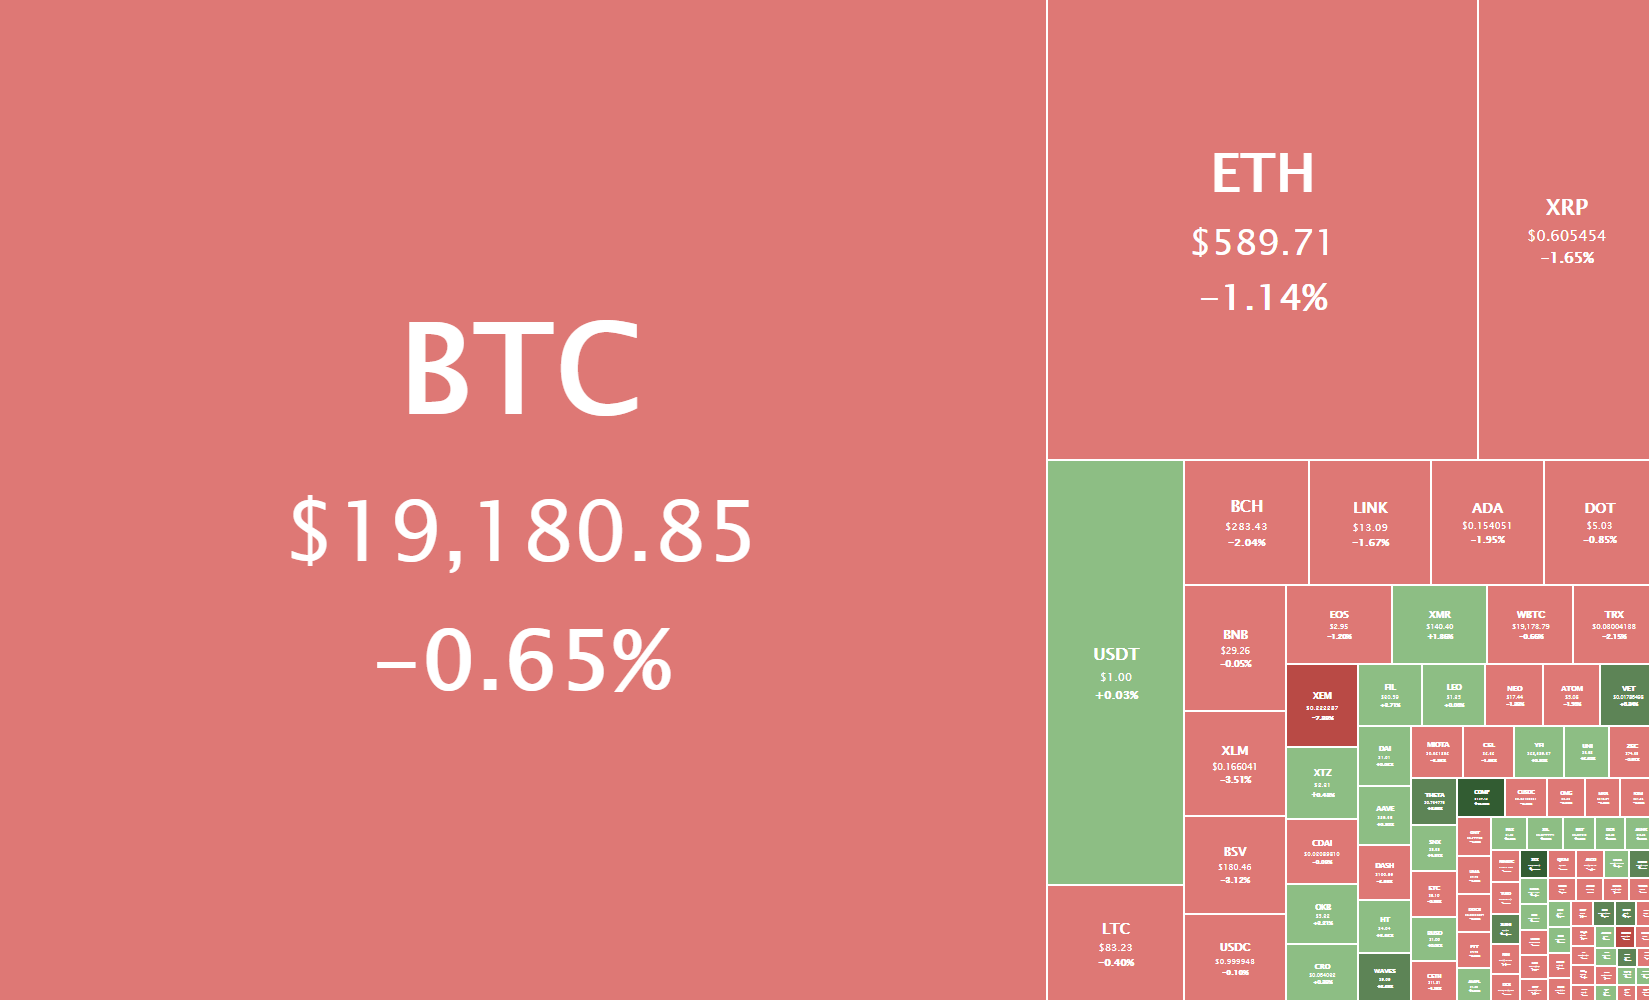
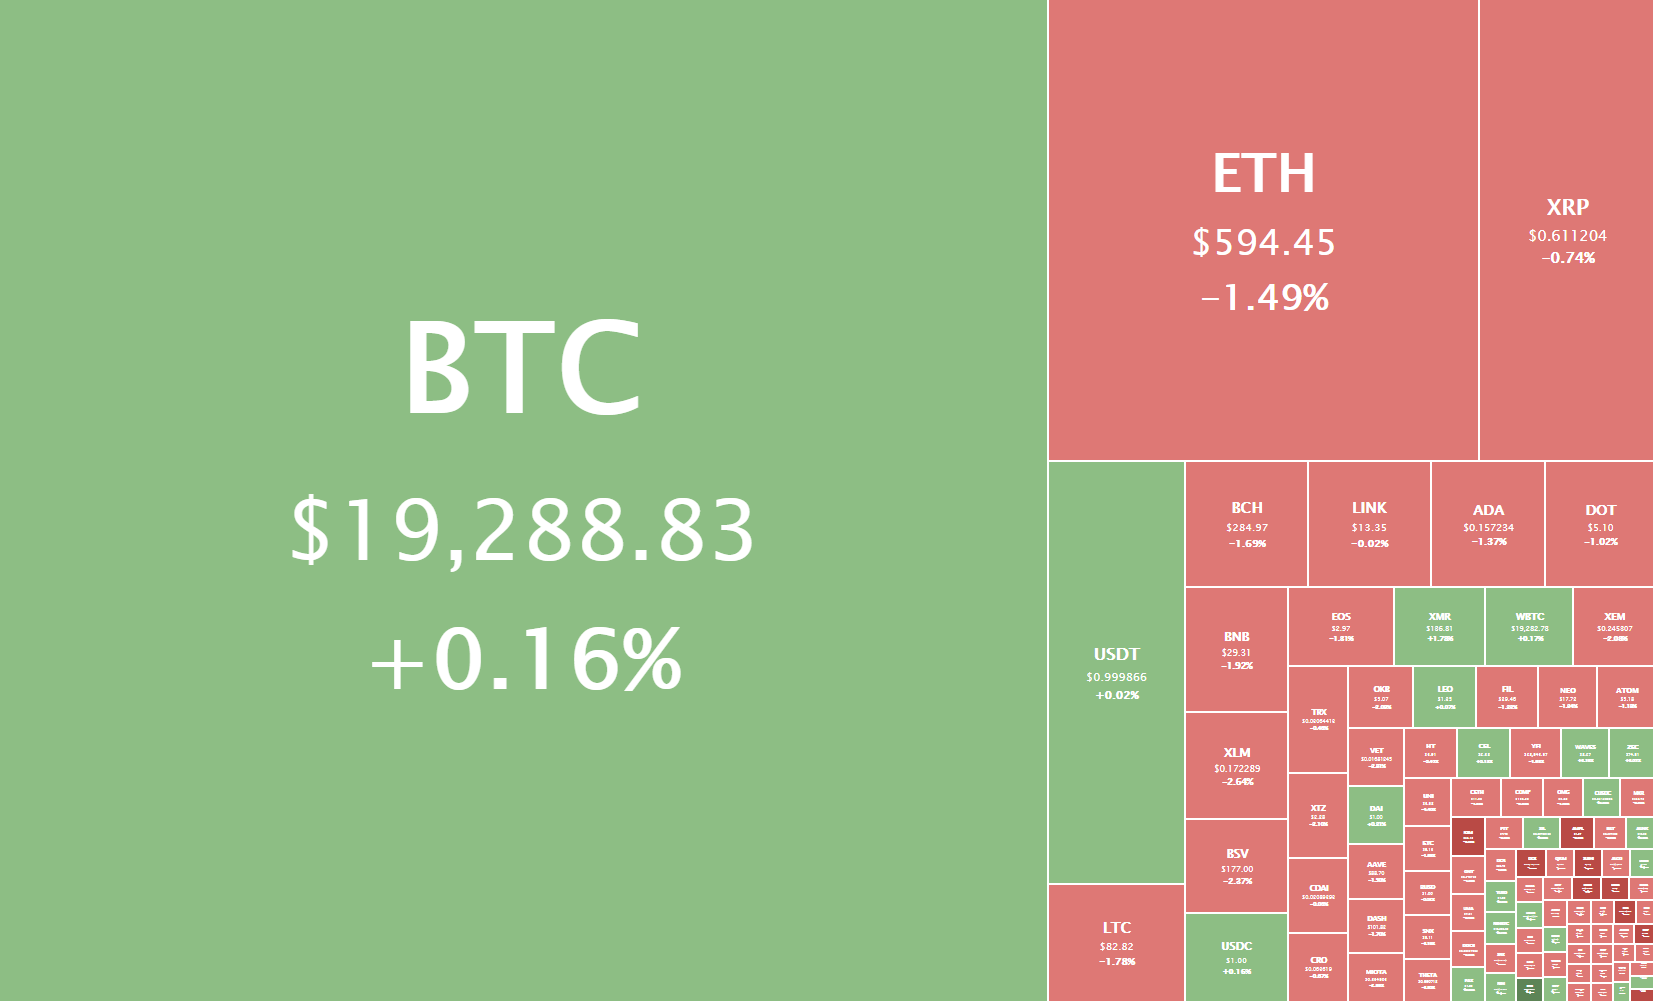
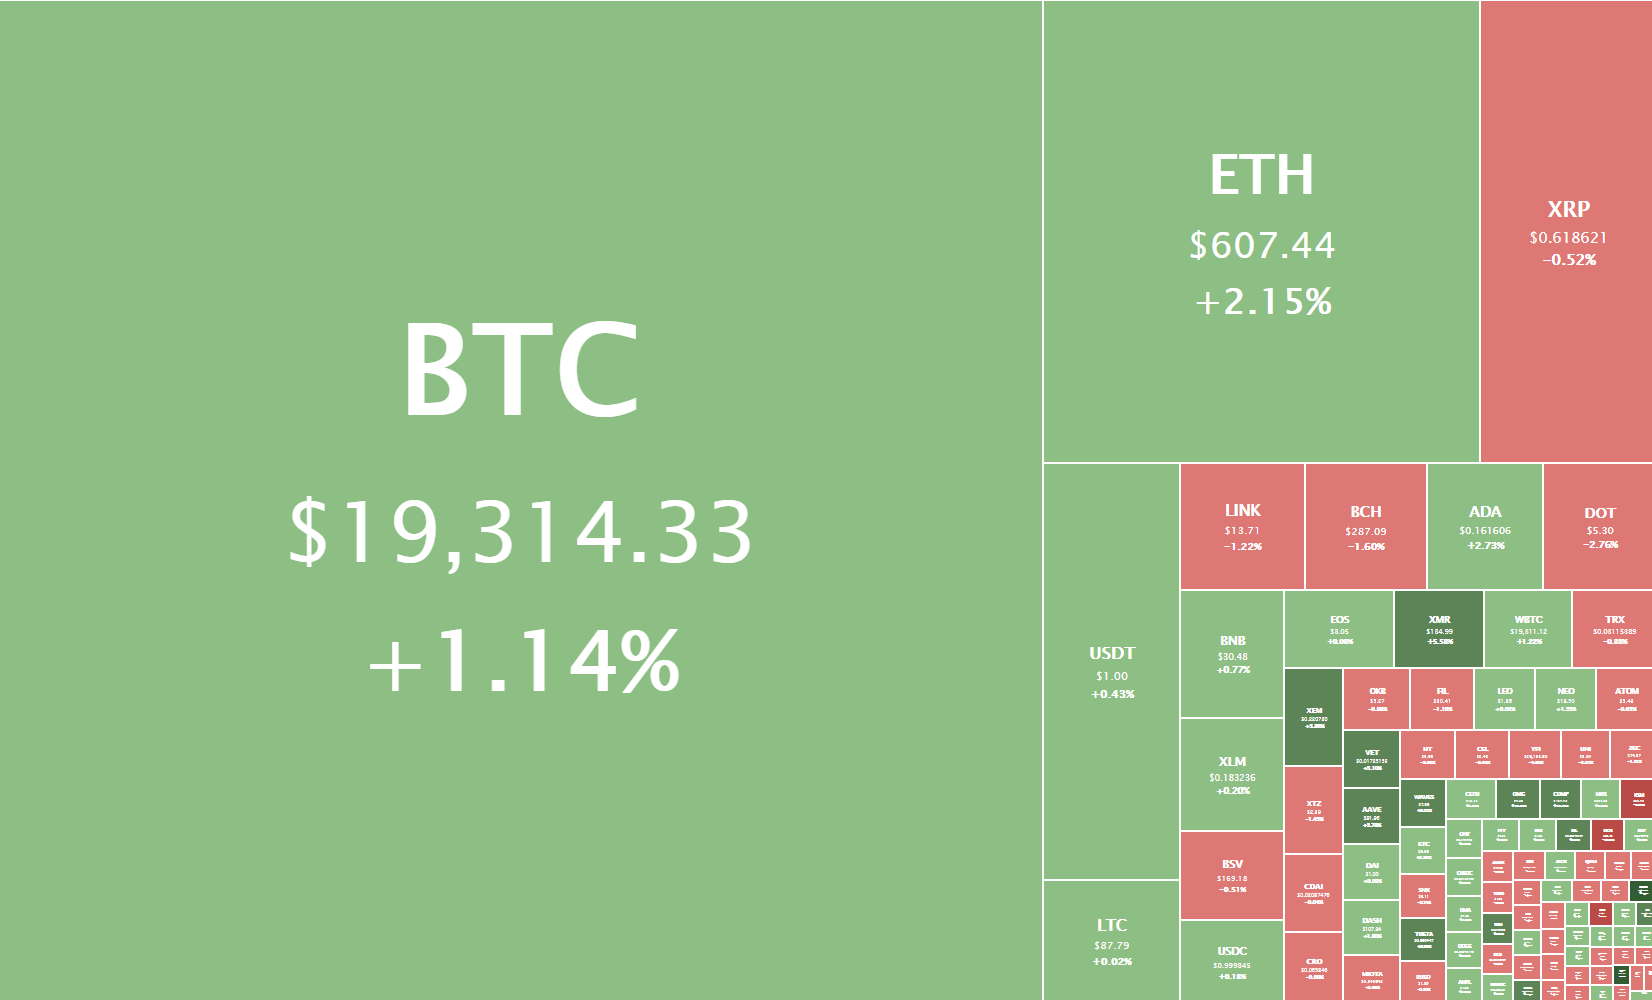
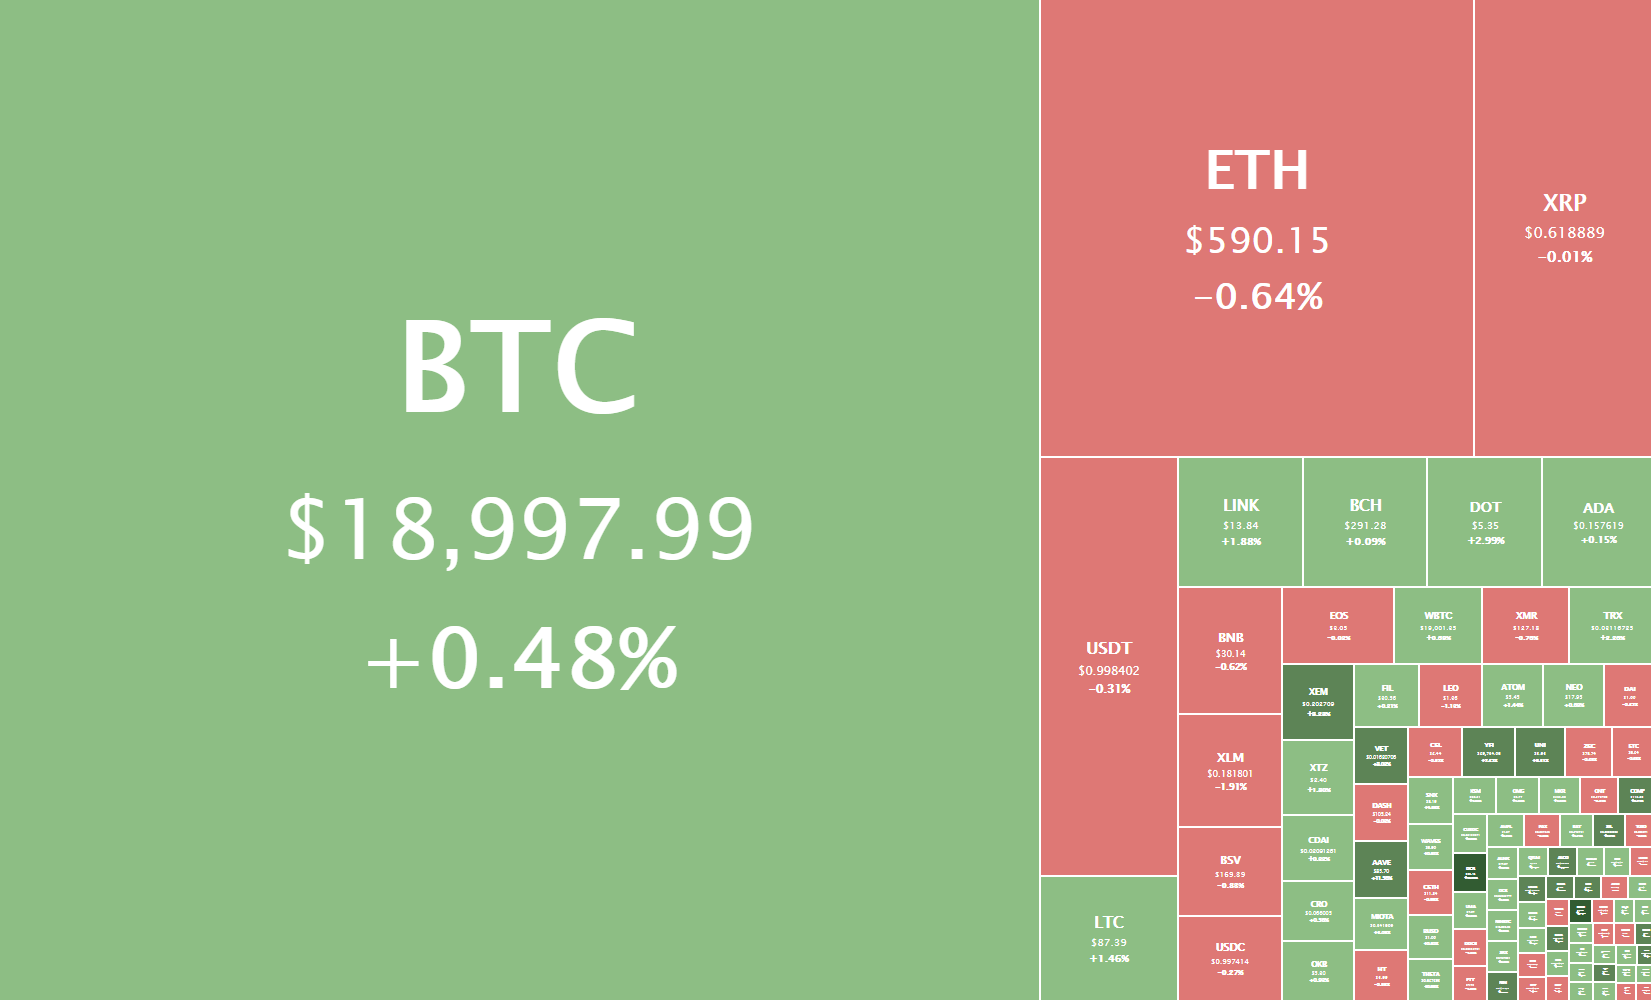
Daily Crypto Sector Heat Map
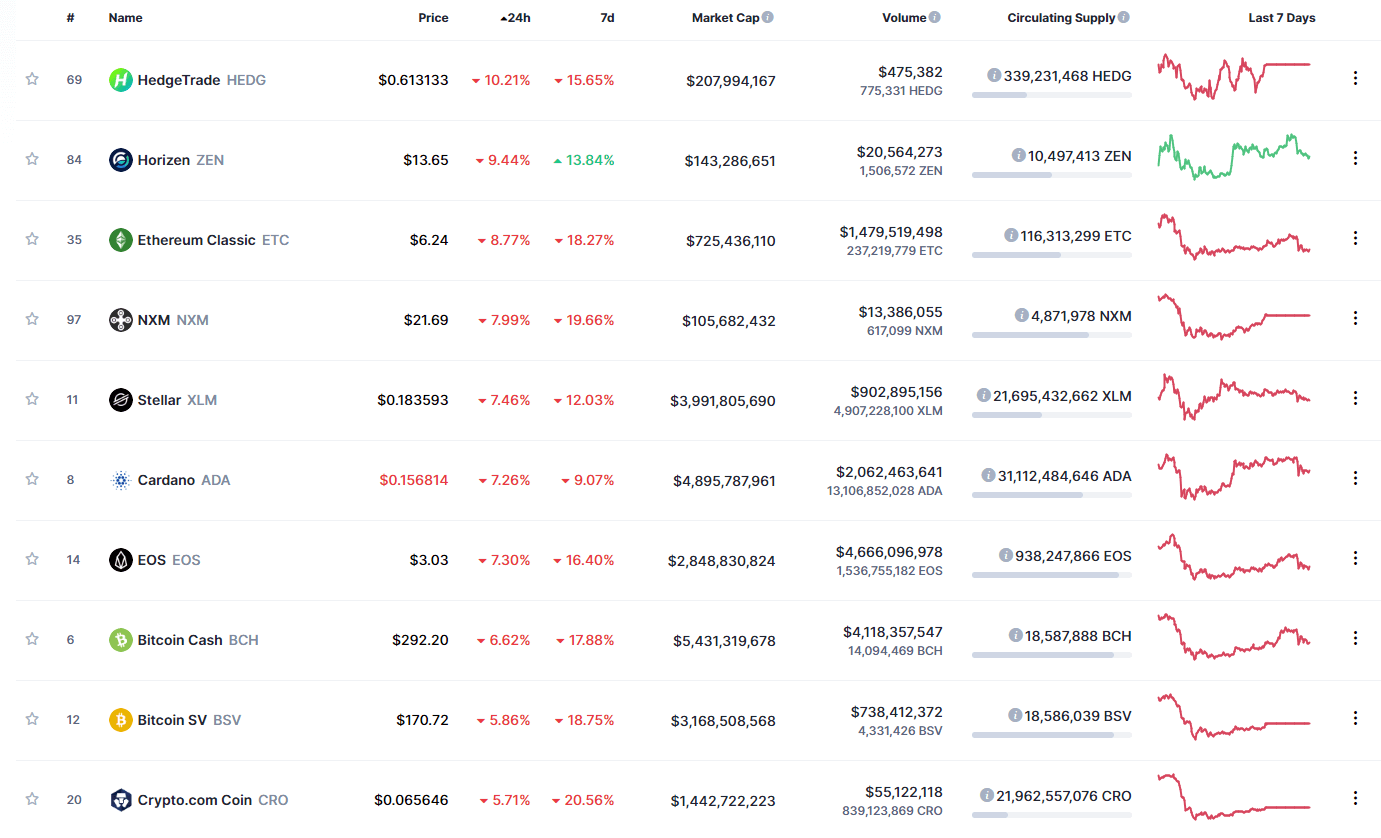
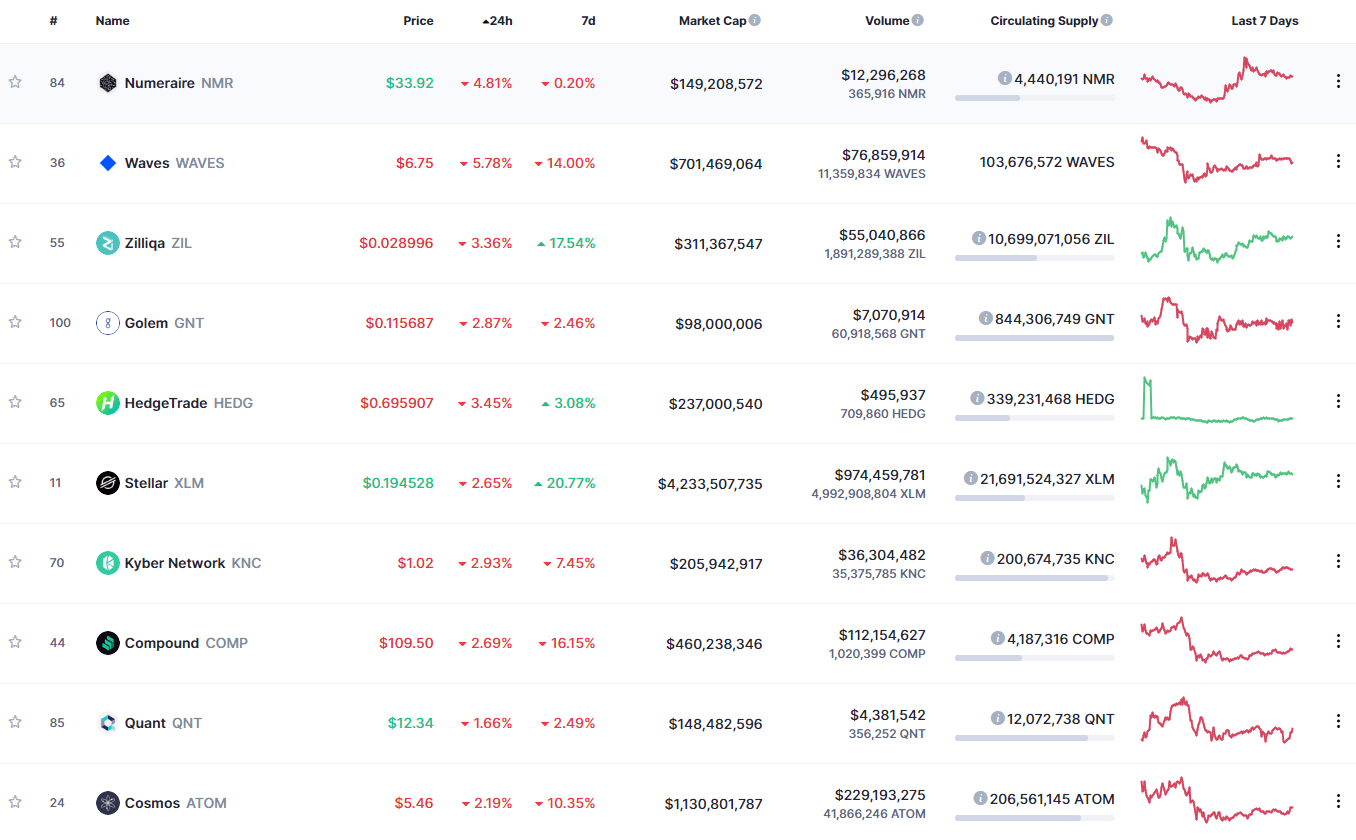
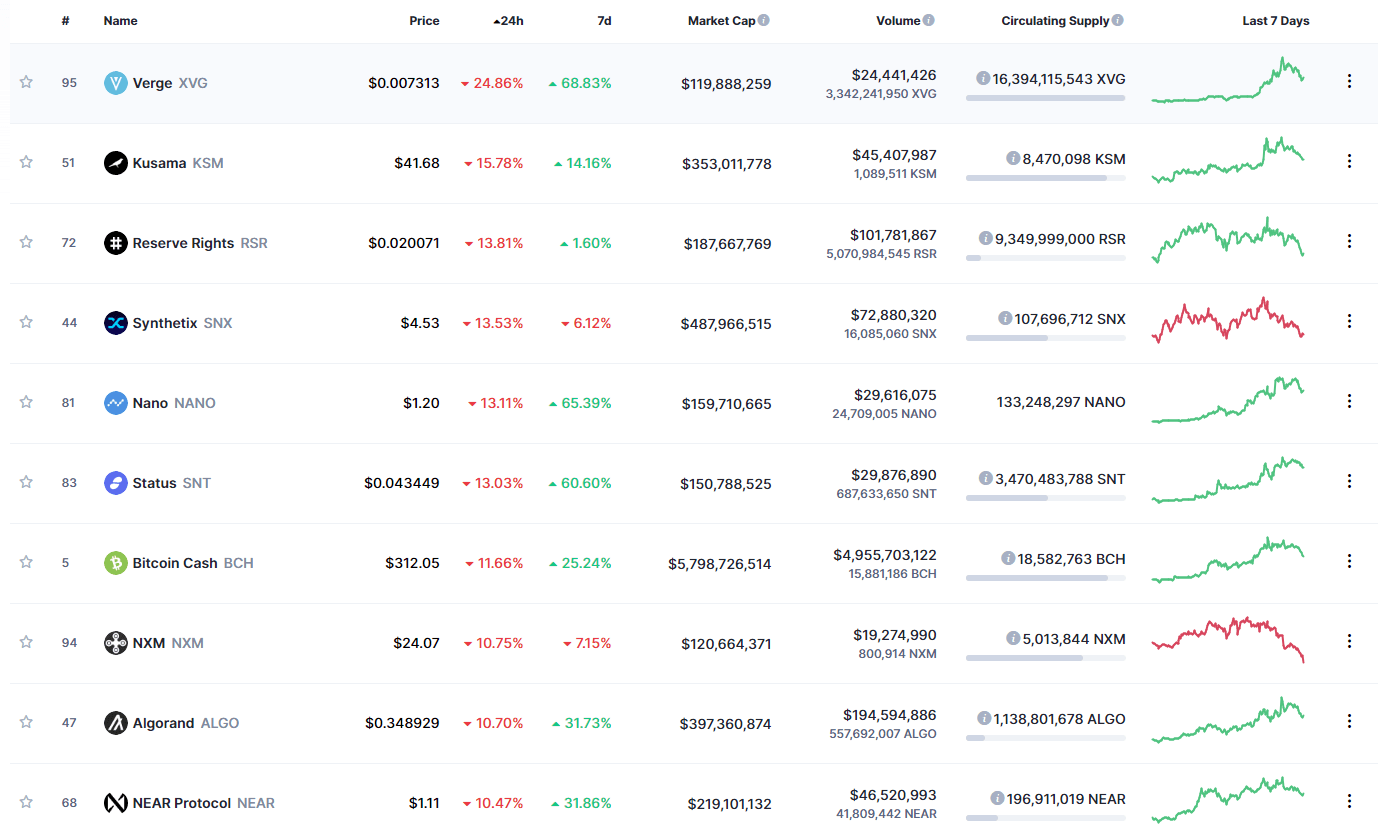
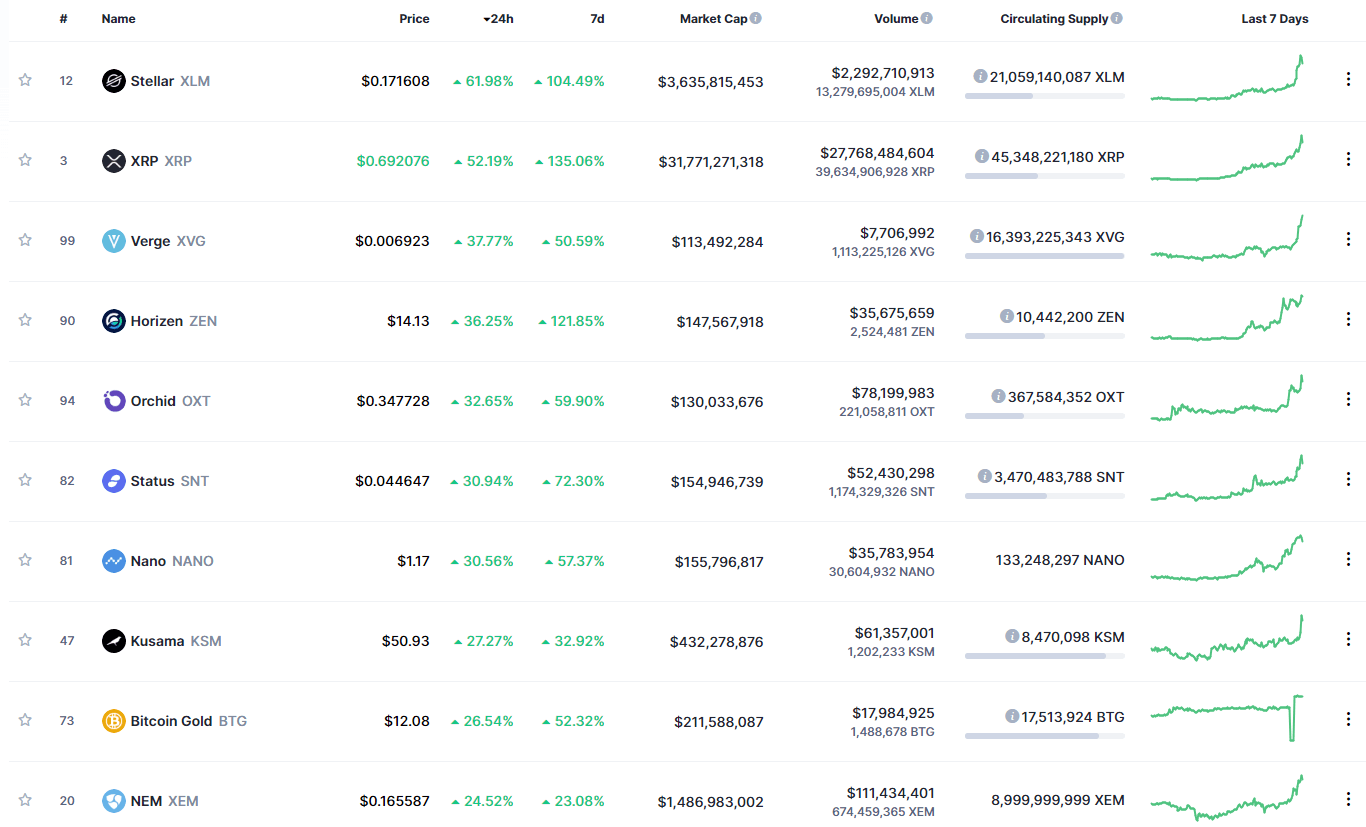
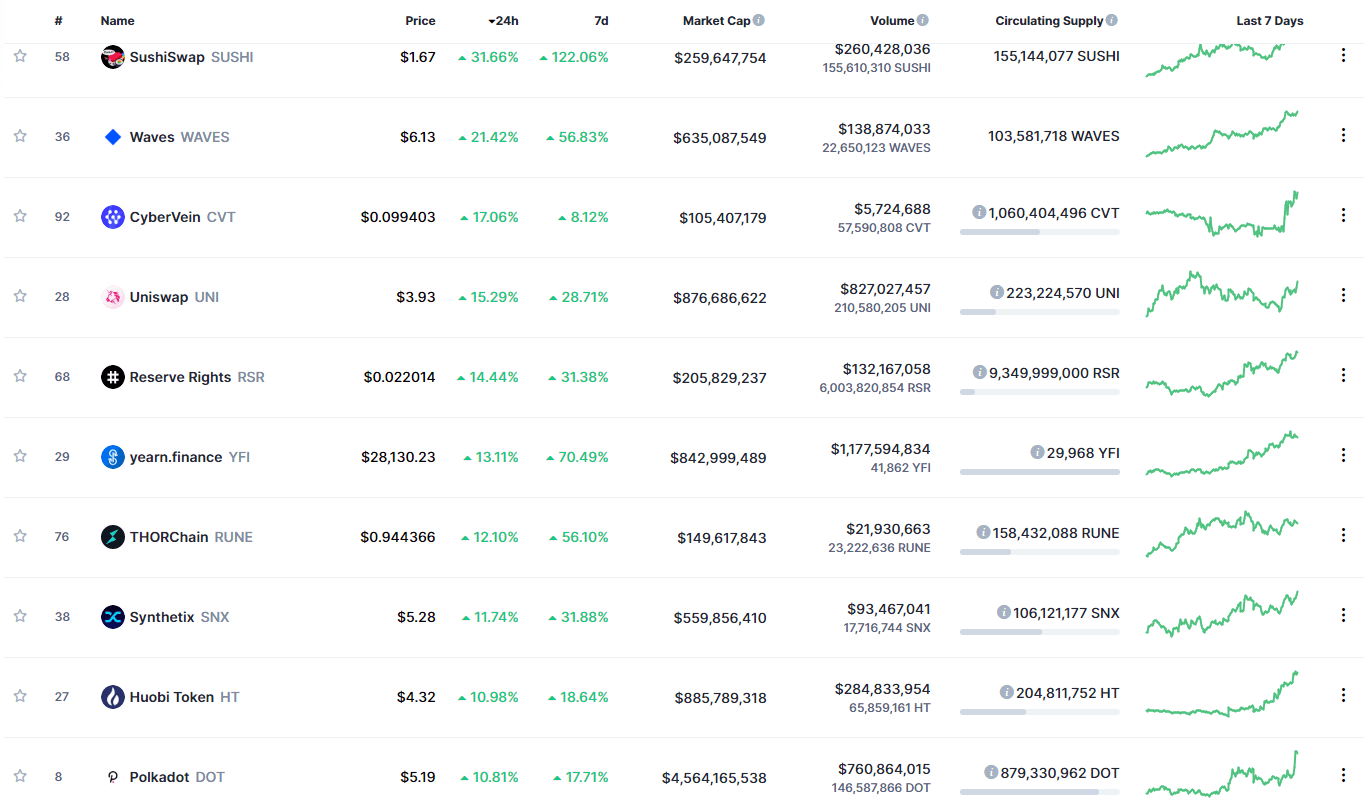
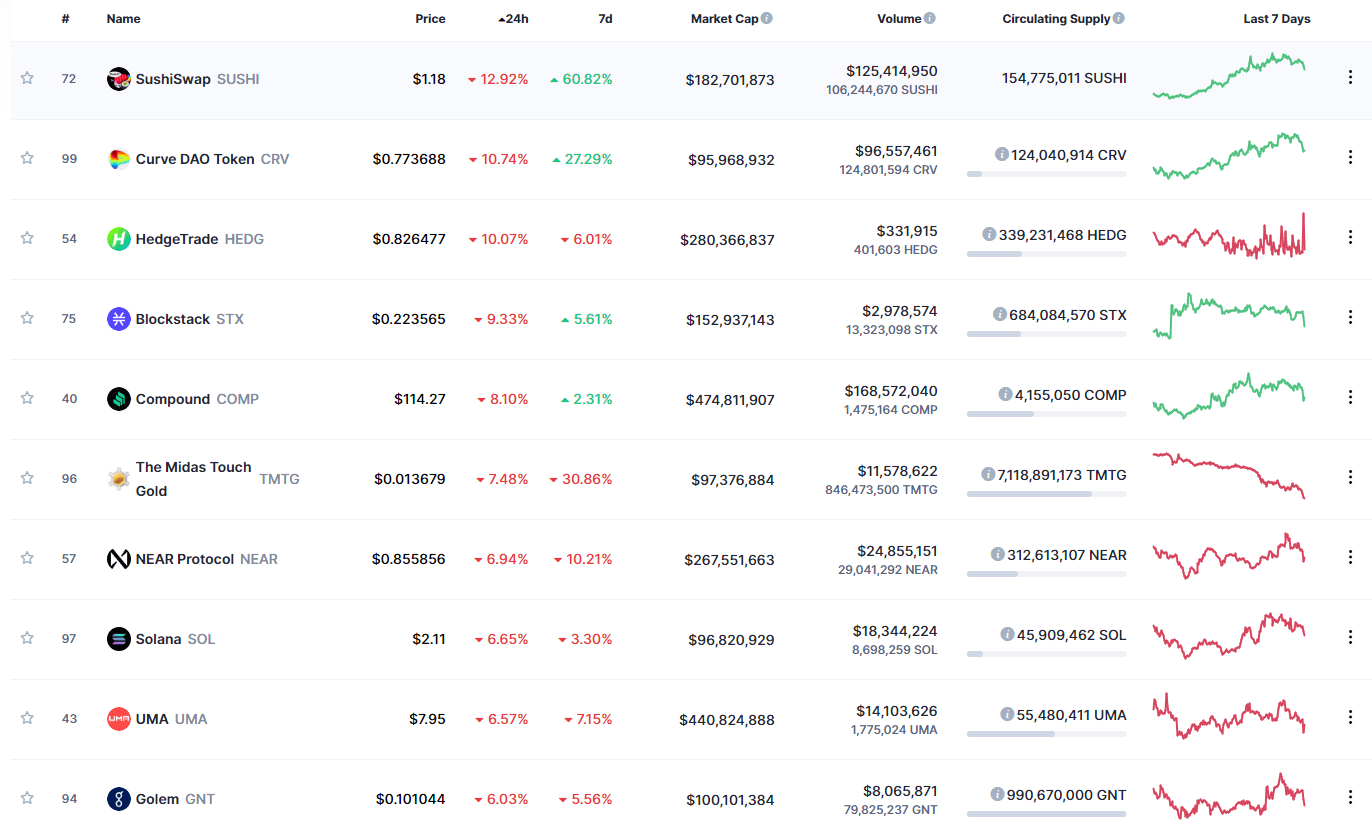
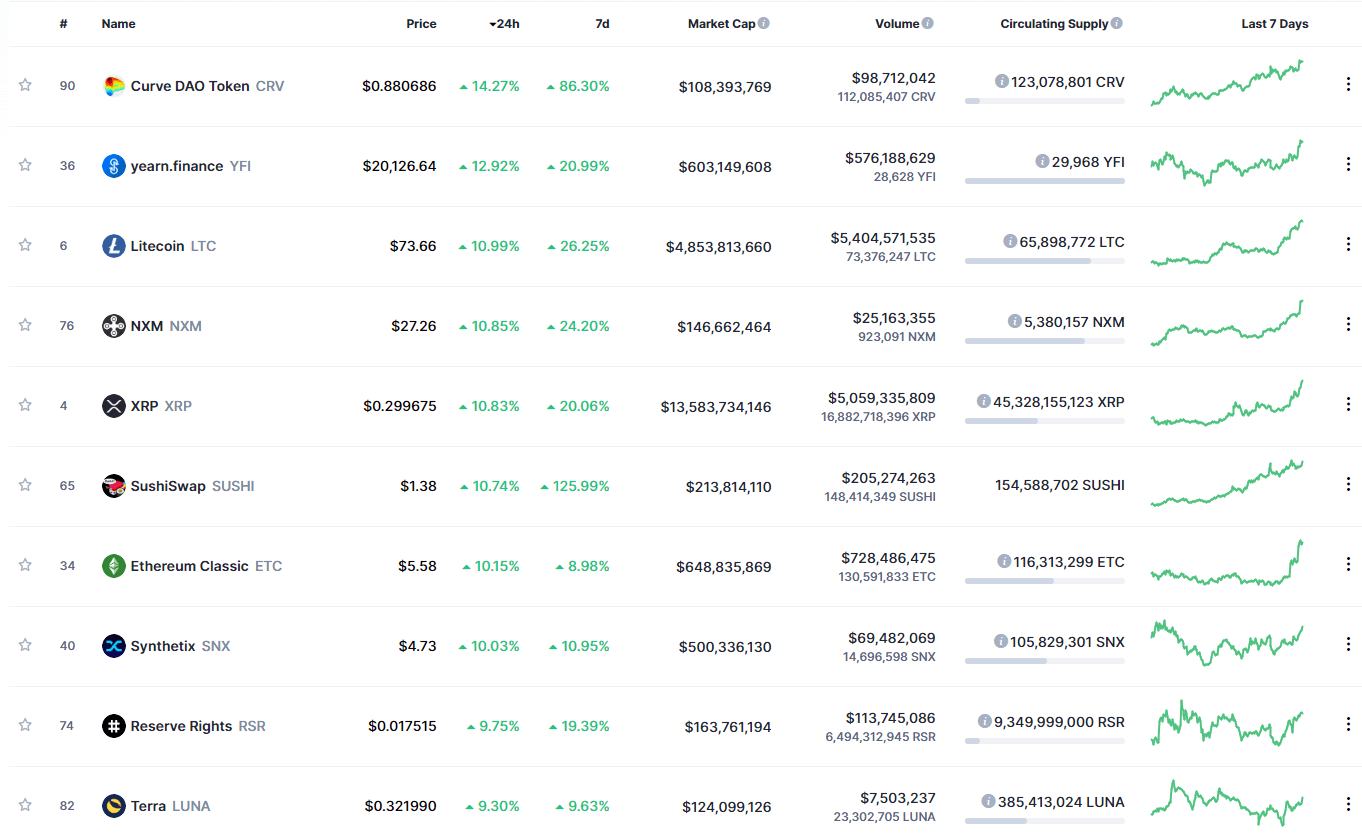
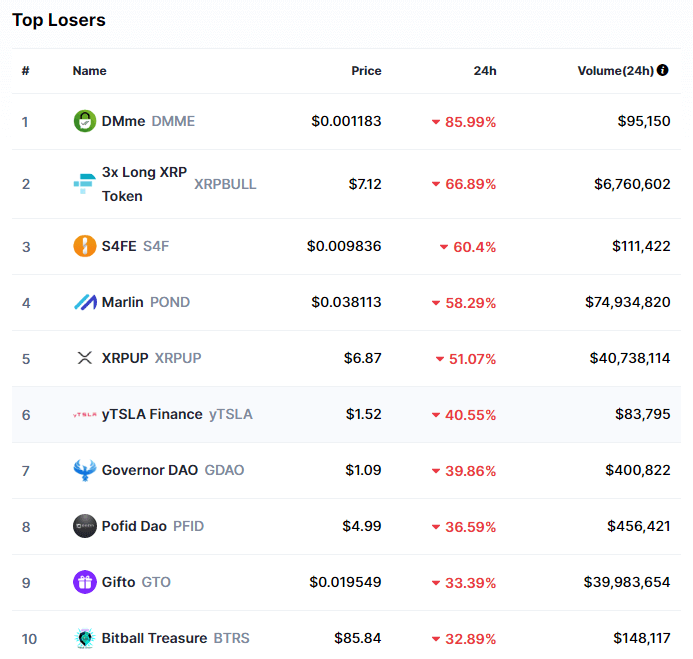
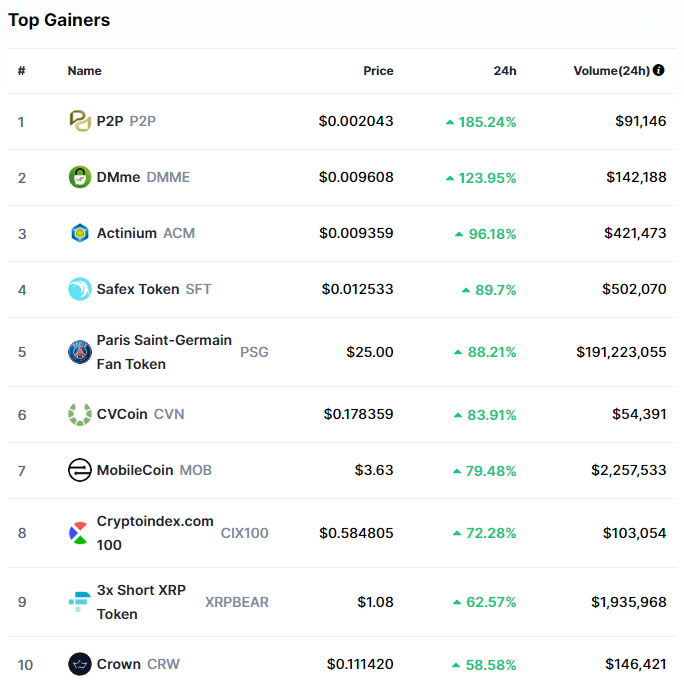
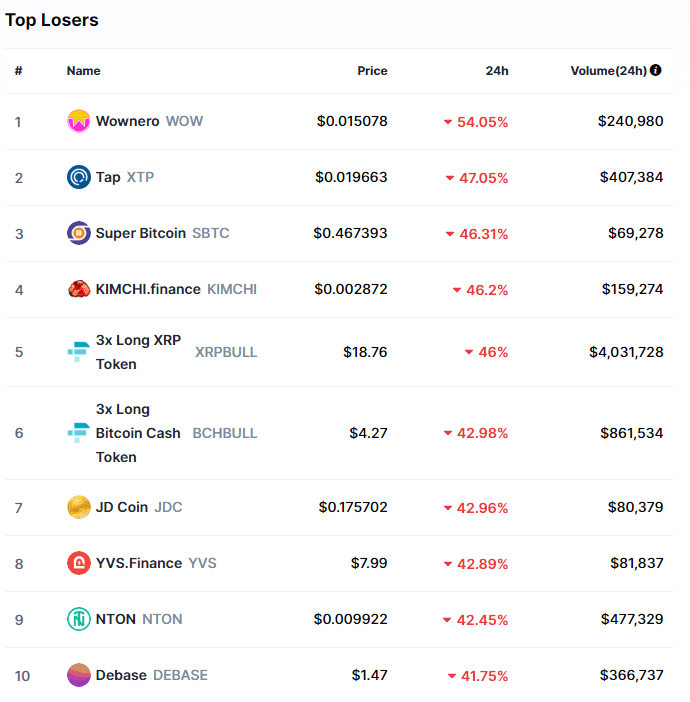
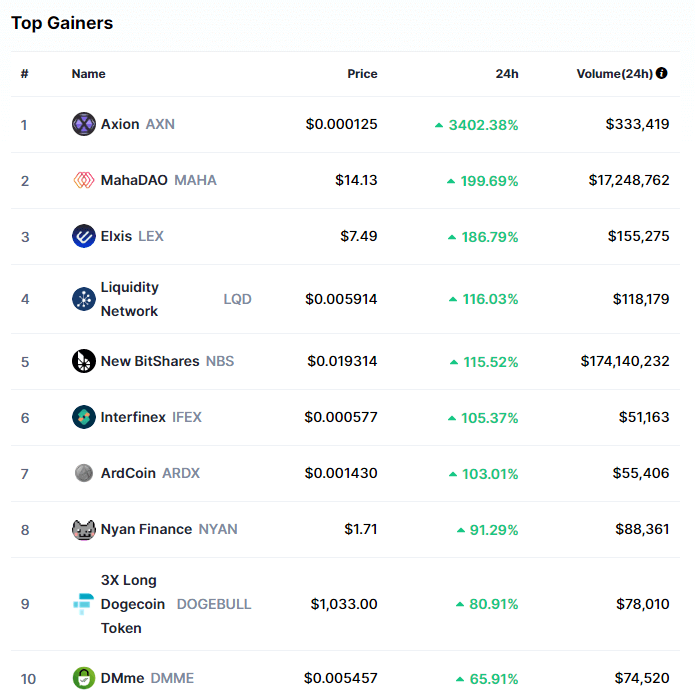
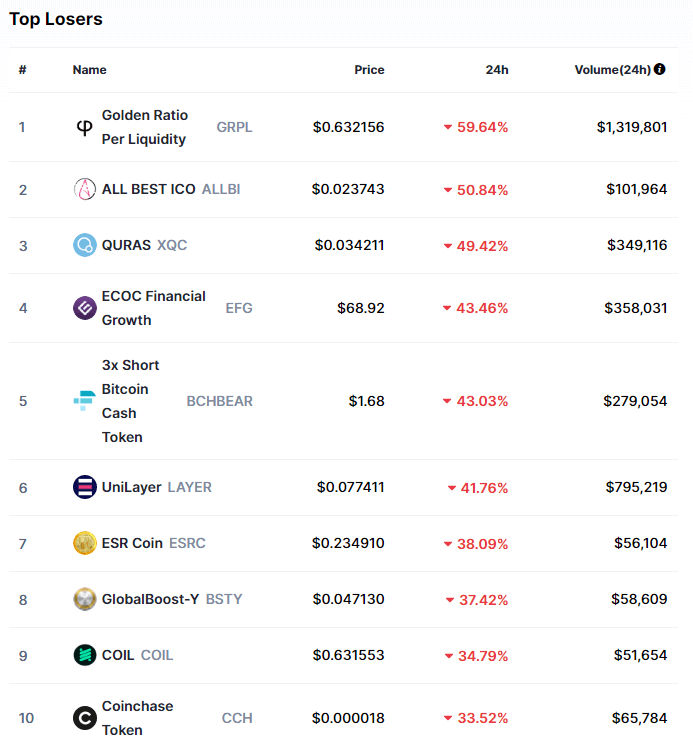
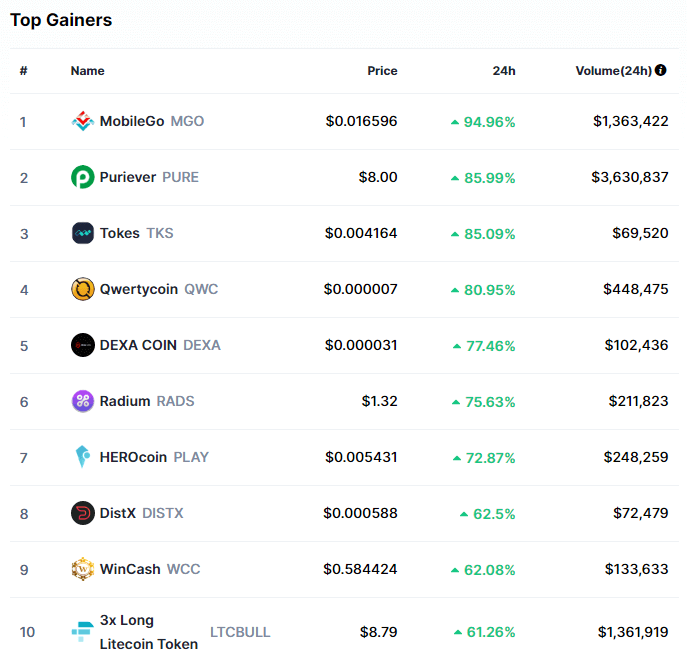
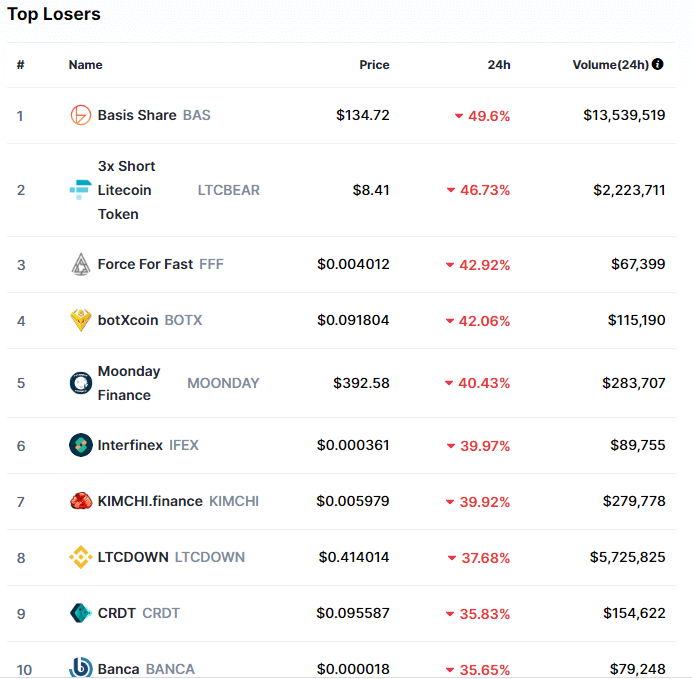
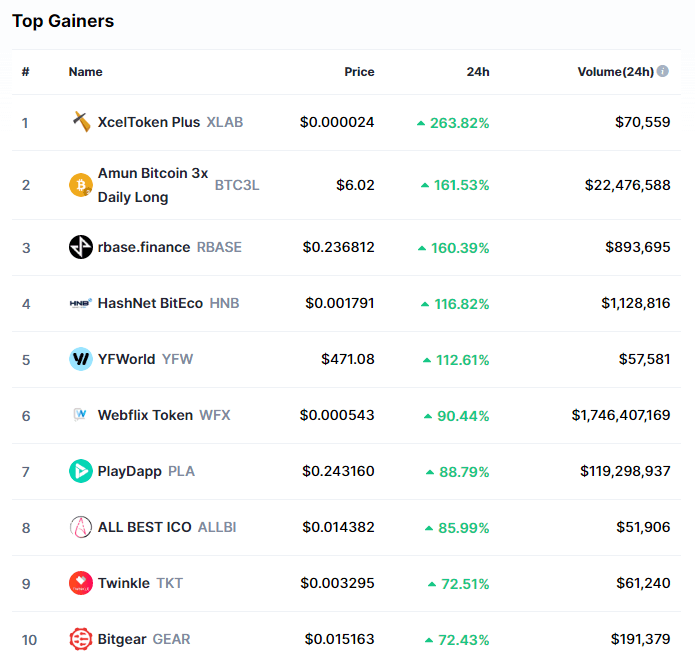
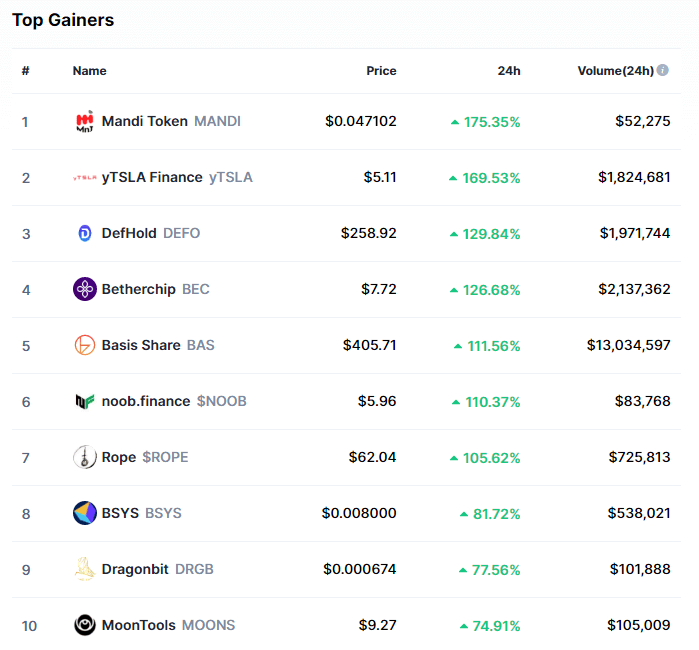
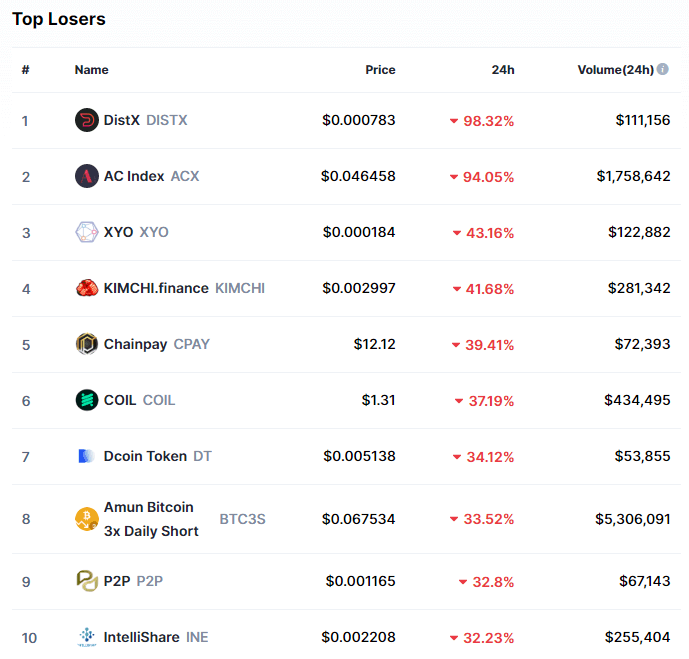
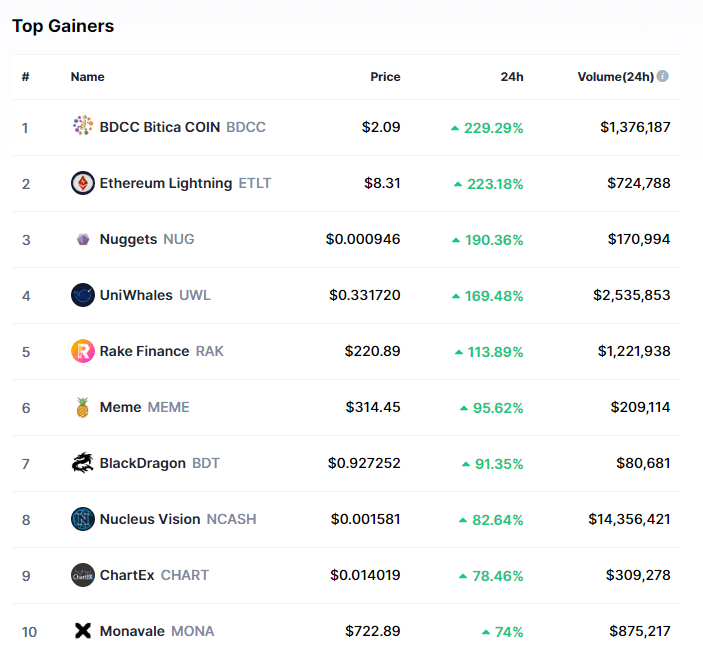
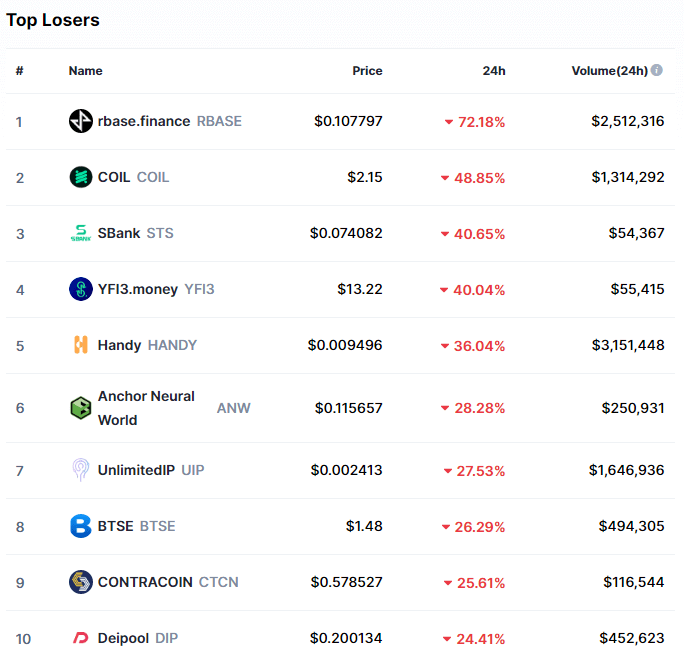
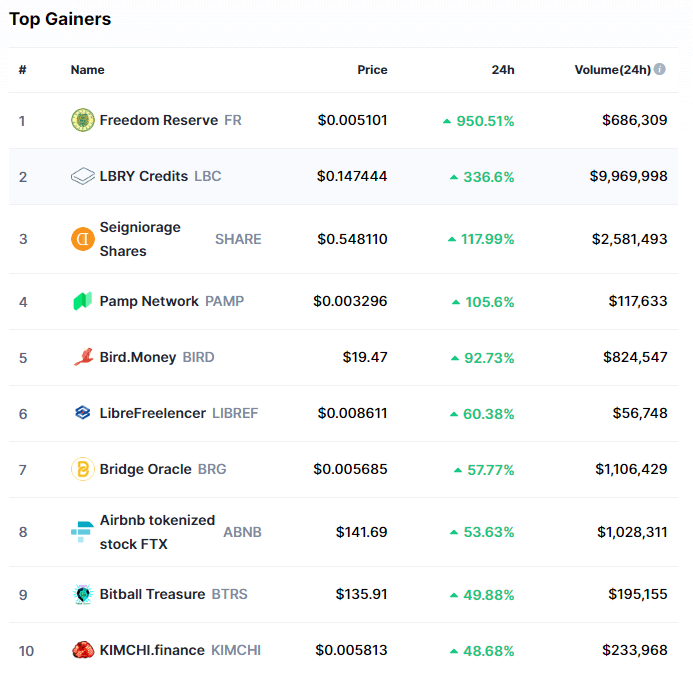
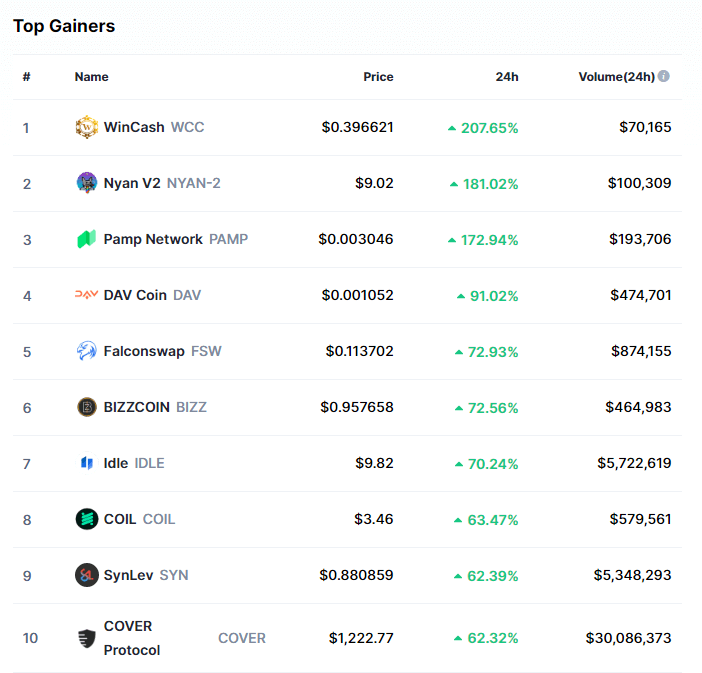
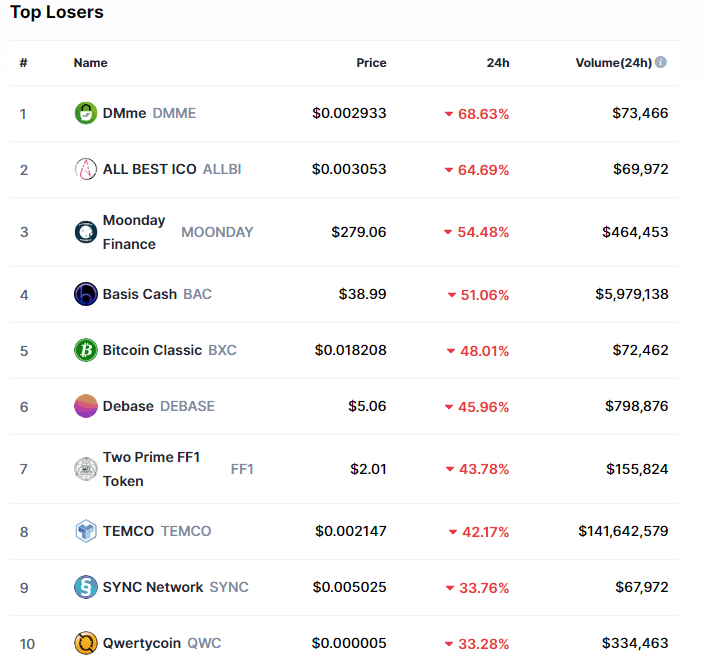
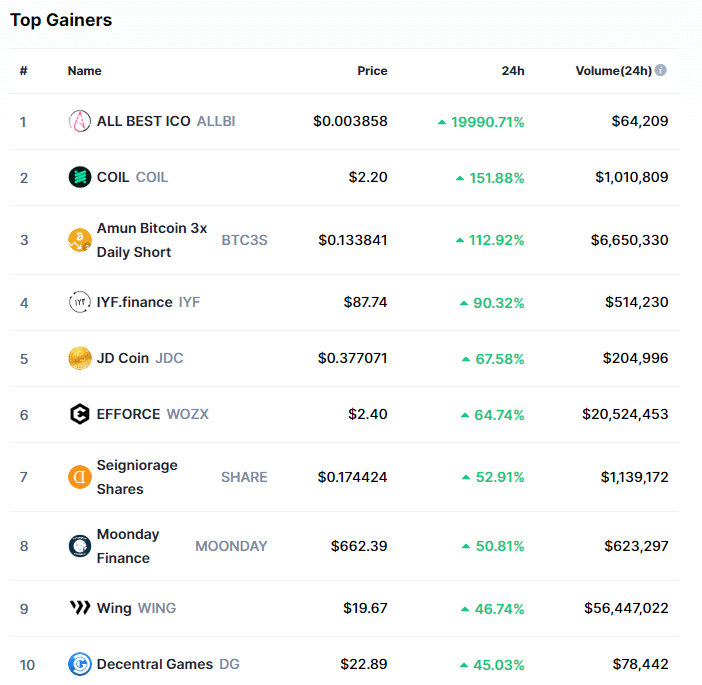
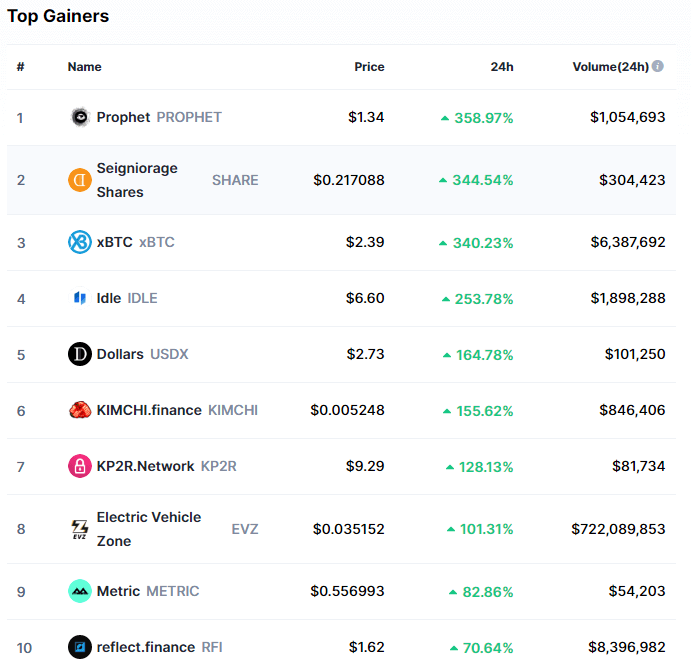
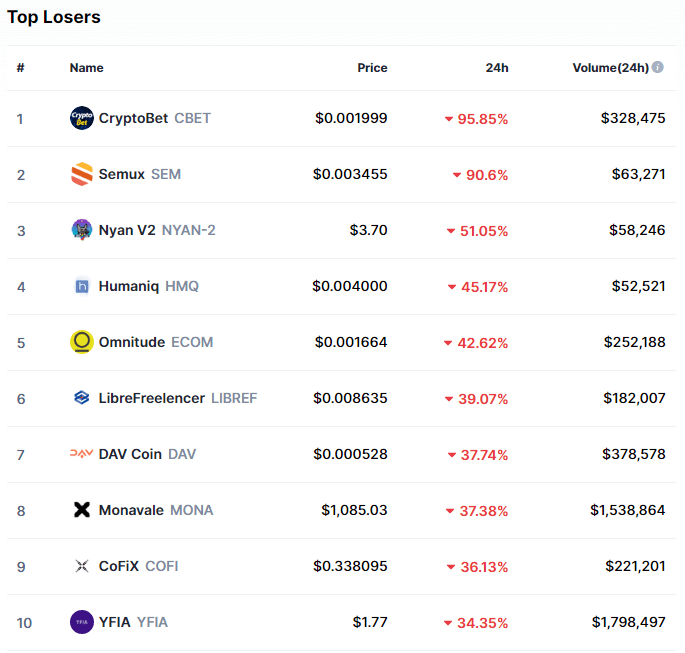
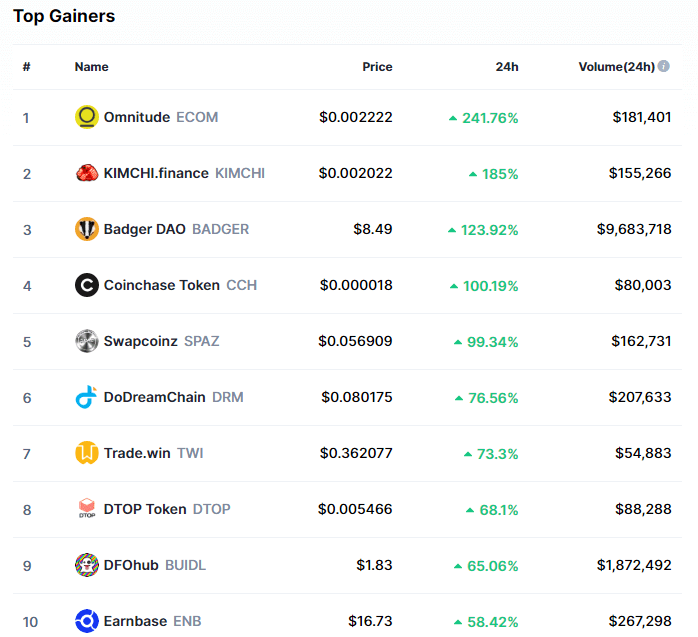
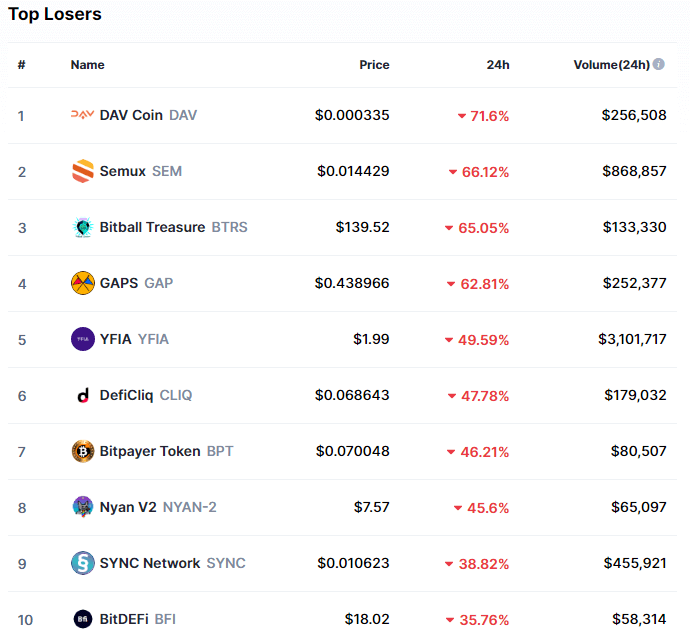
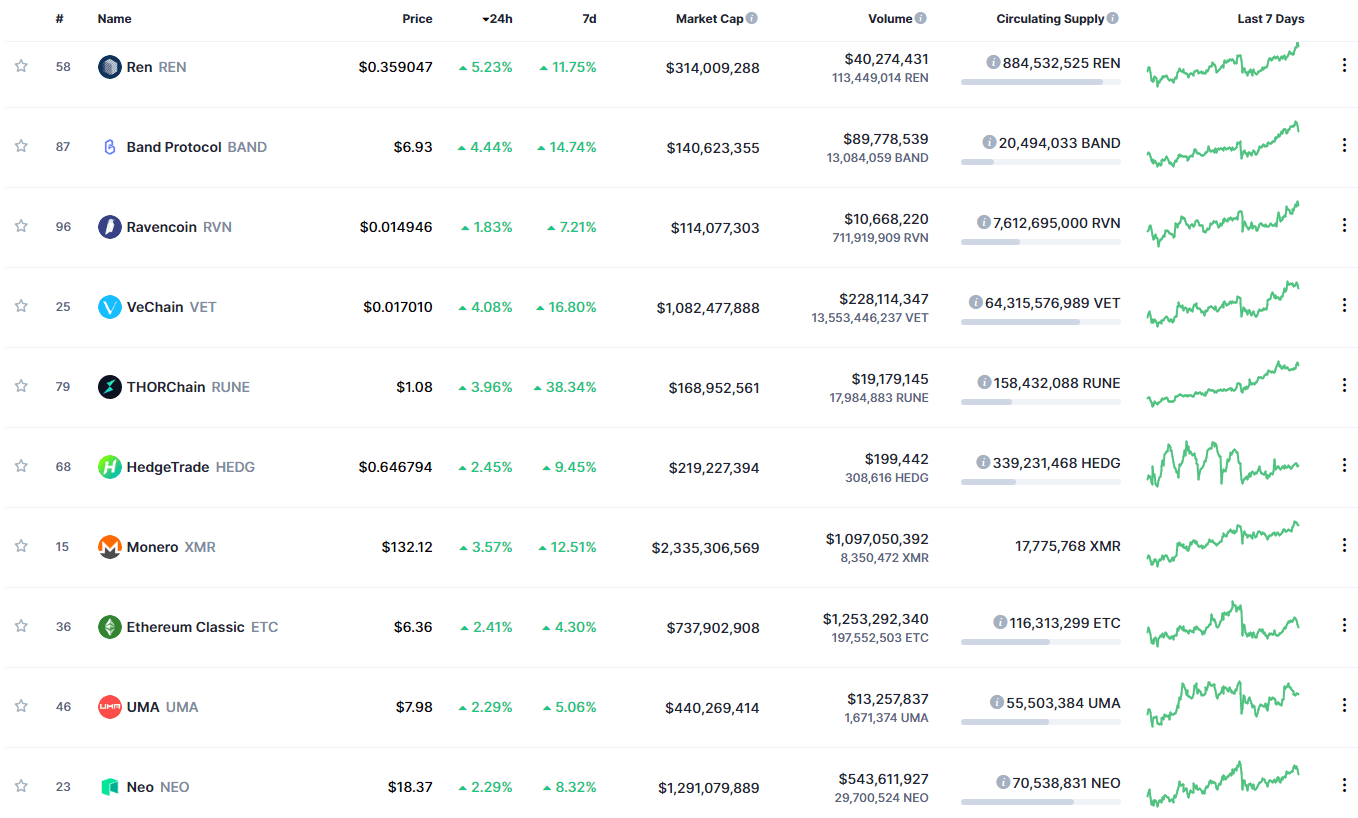
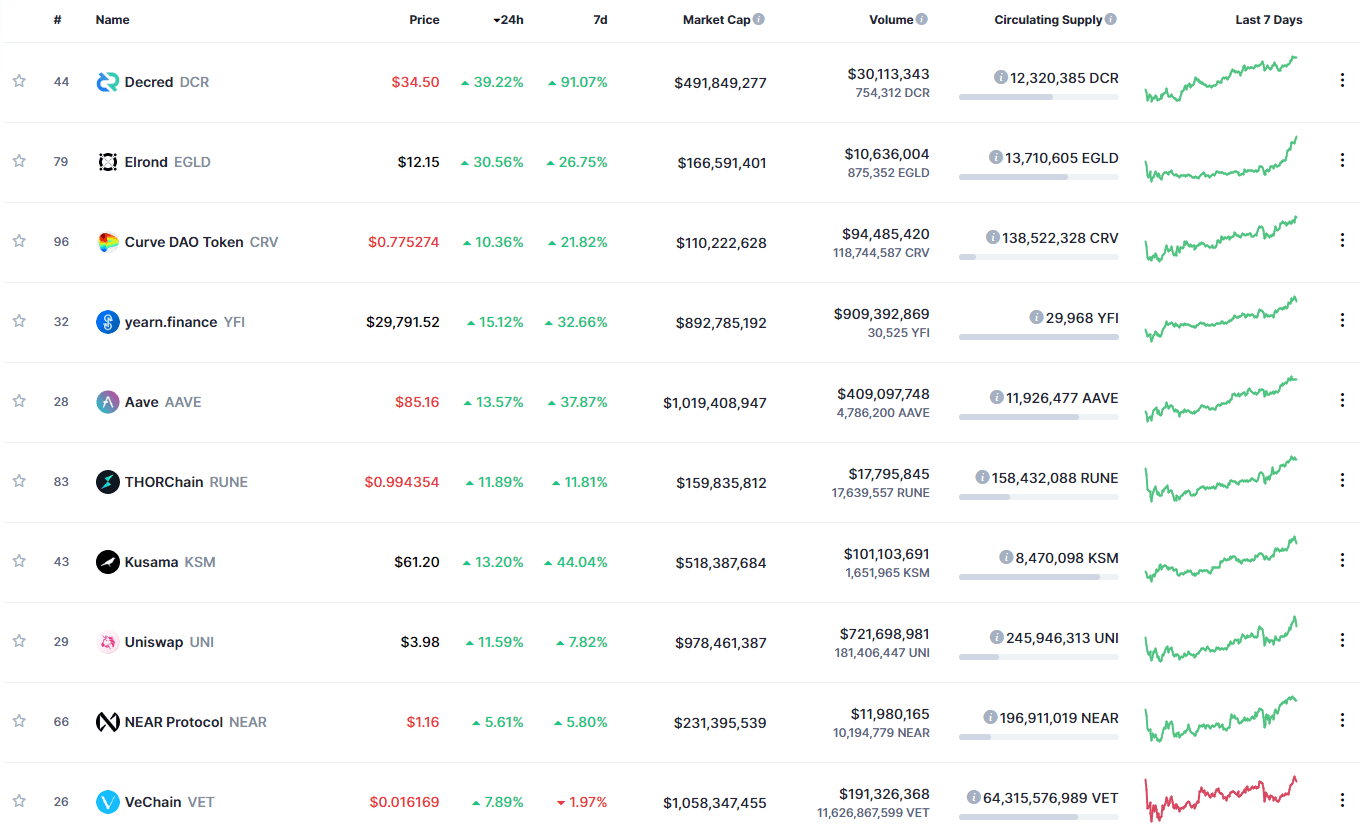
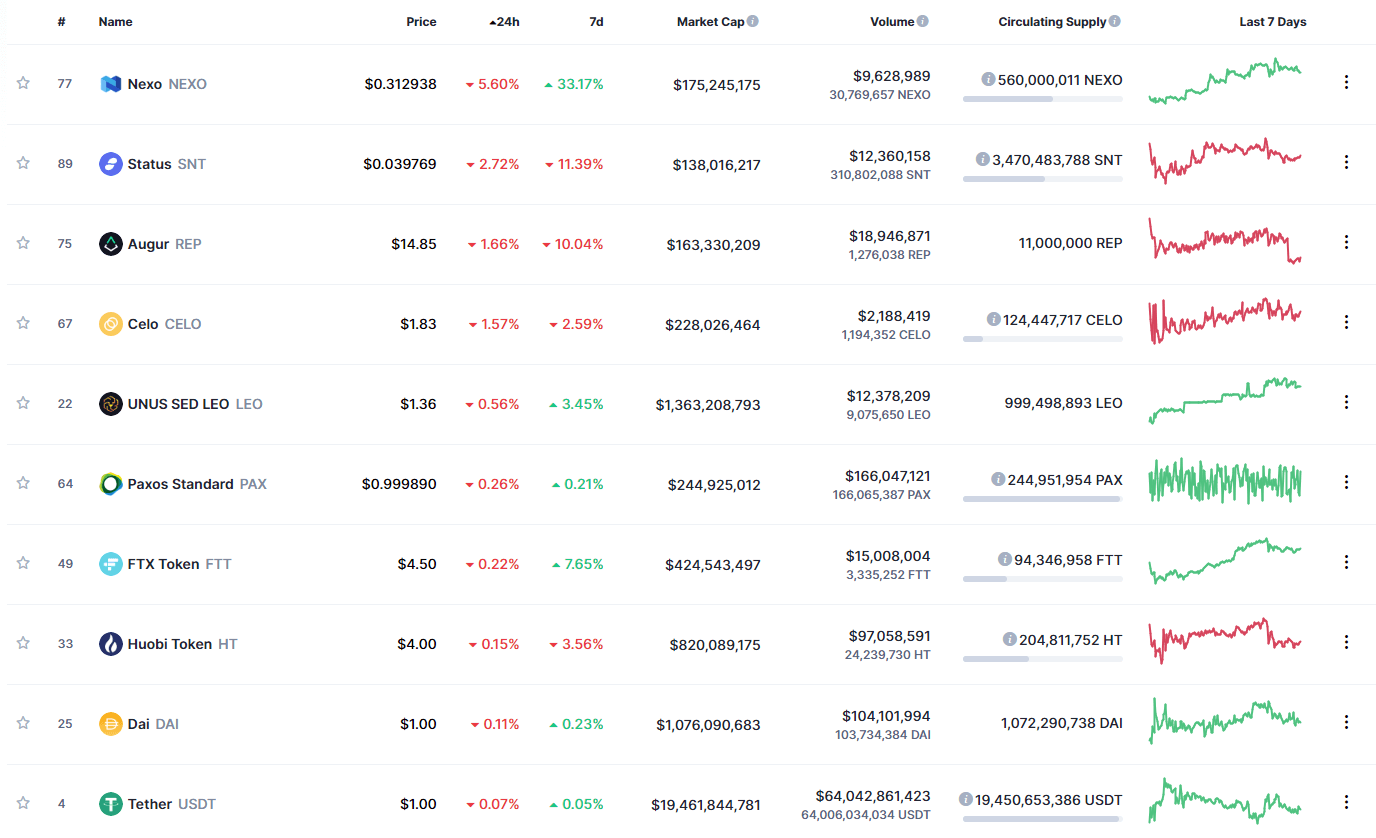
Folgory Coin gained 5571.49% in the past 24 hours, making it the most prominent daily crypto gainer by far. It is followed by MINDOL’s 1224.26% and DACC’s 1070.44% gain. On the other hand, 3x Long XRP Token lost 77.00%, making it the most prominent daily loser. It is followed by B21 Invest’s loss of 74.30% and YFPRO Finance’s loss of 70.96%.
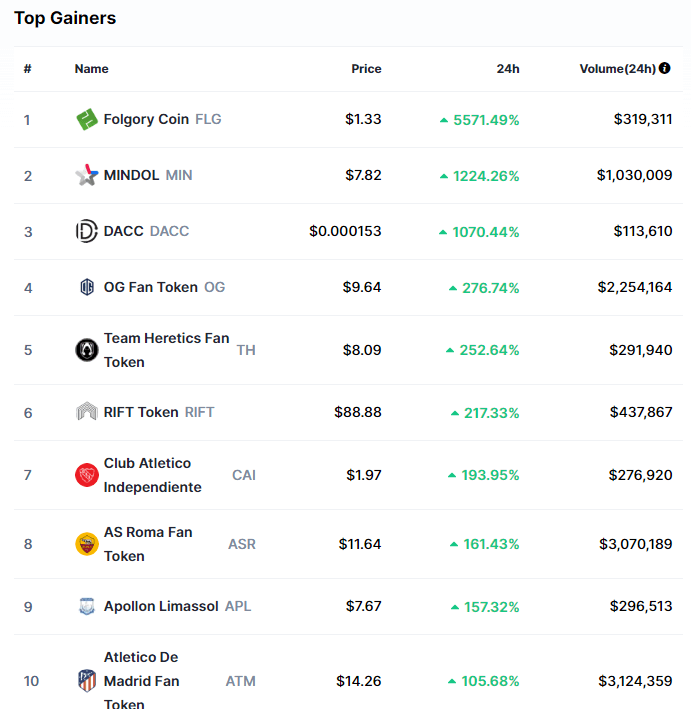
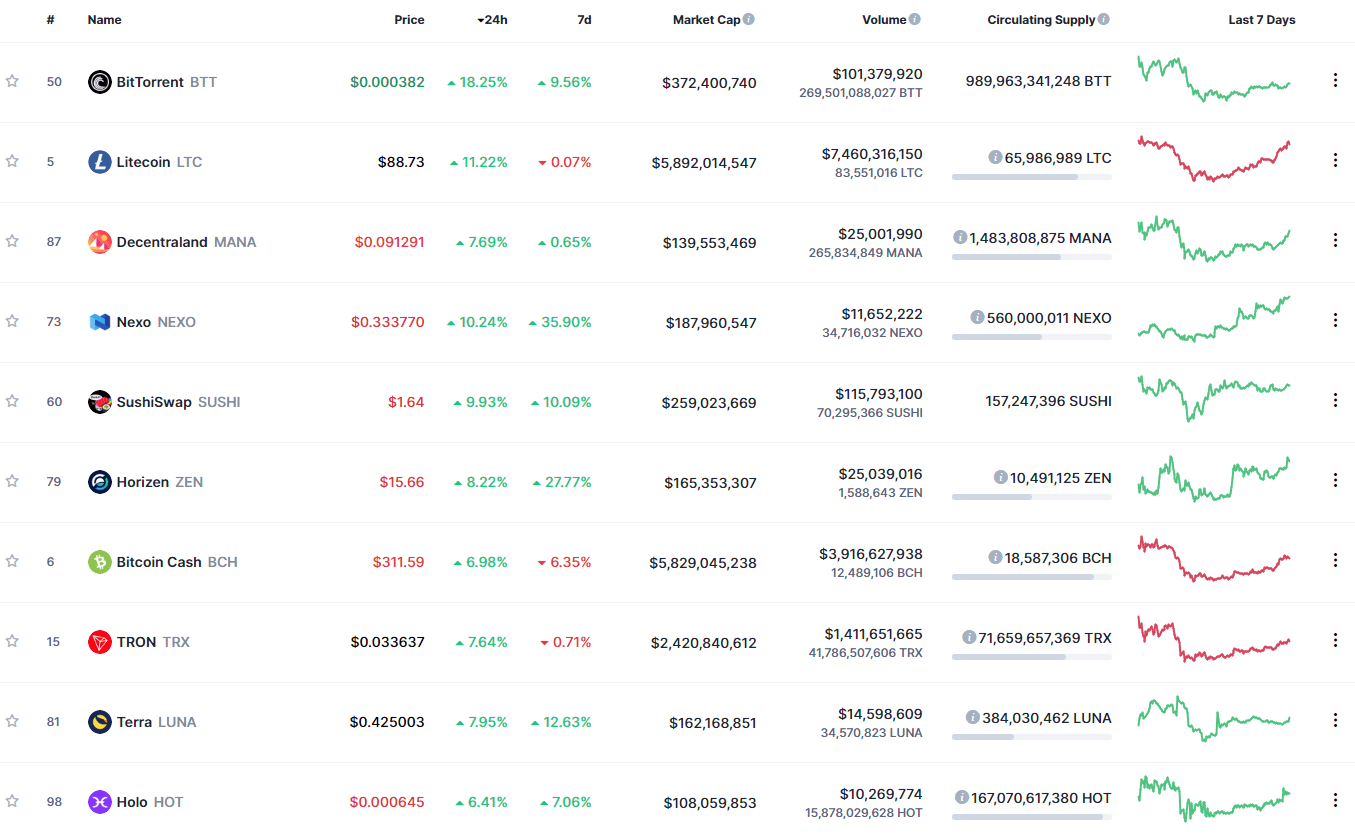
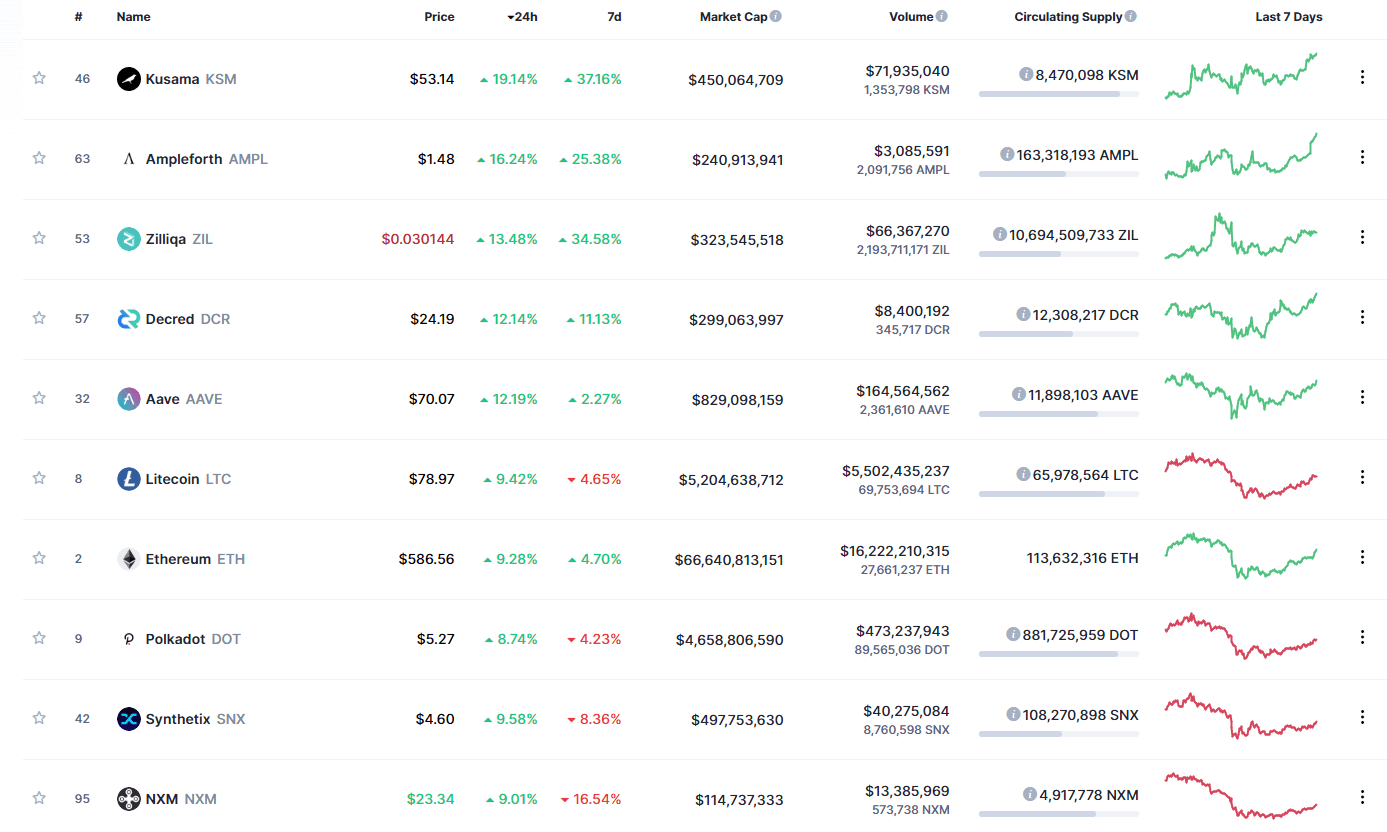
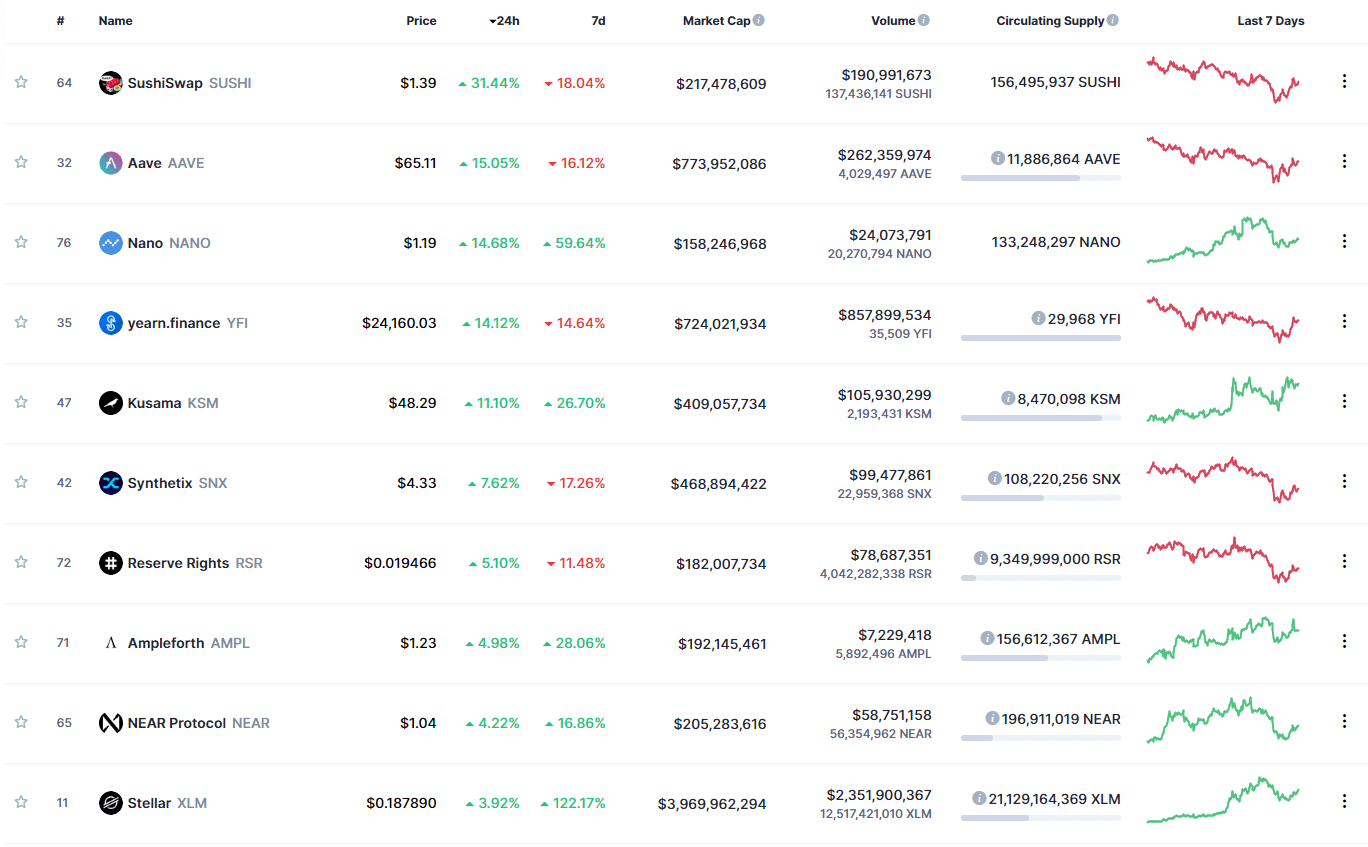
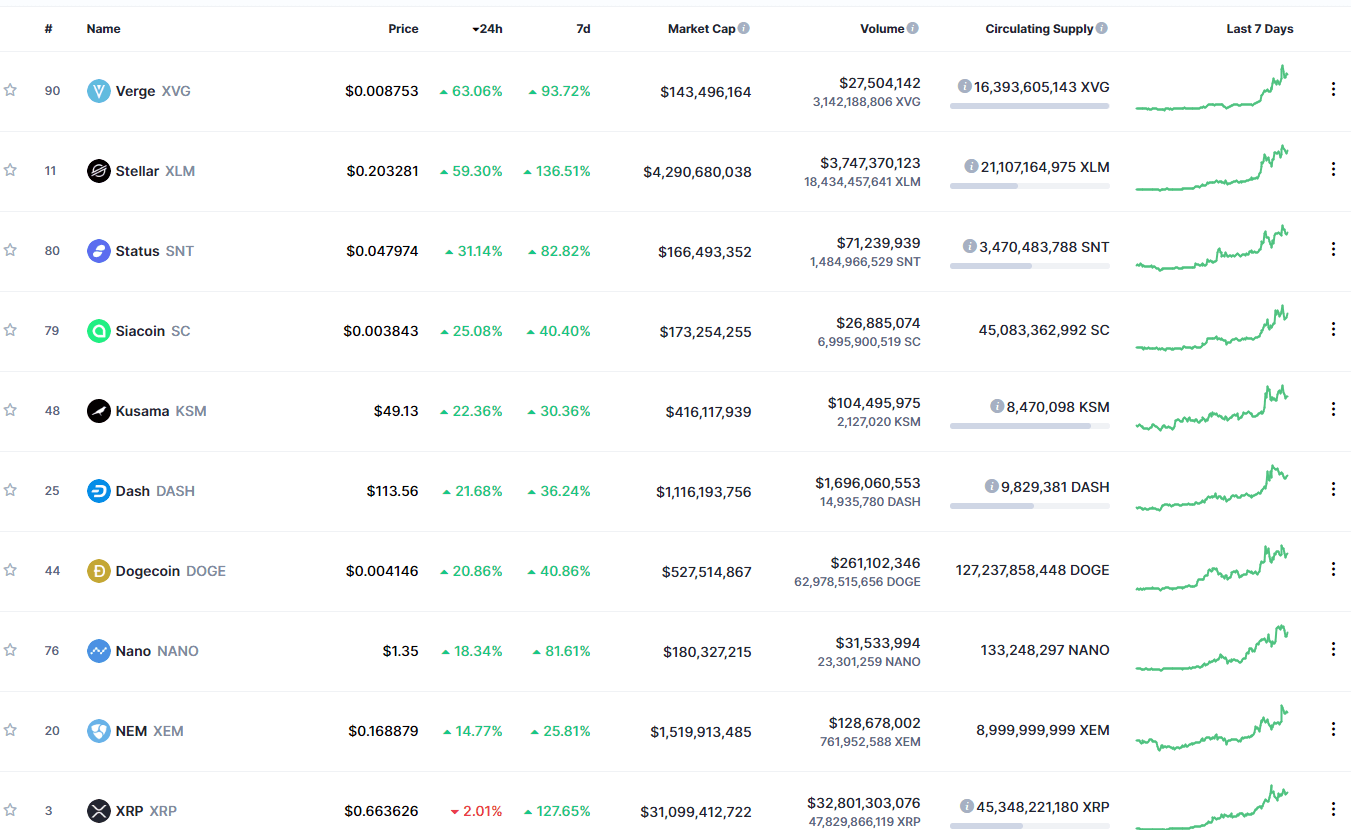
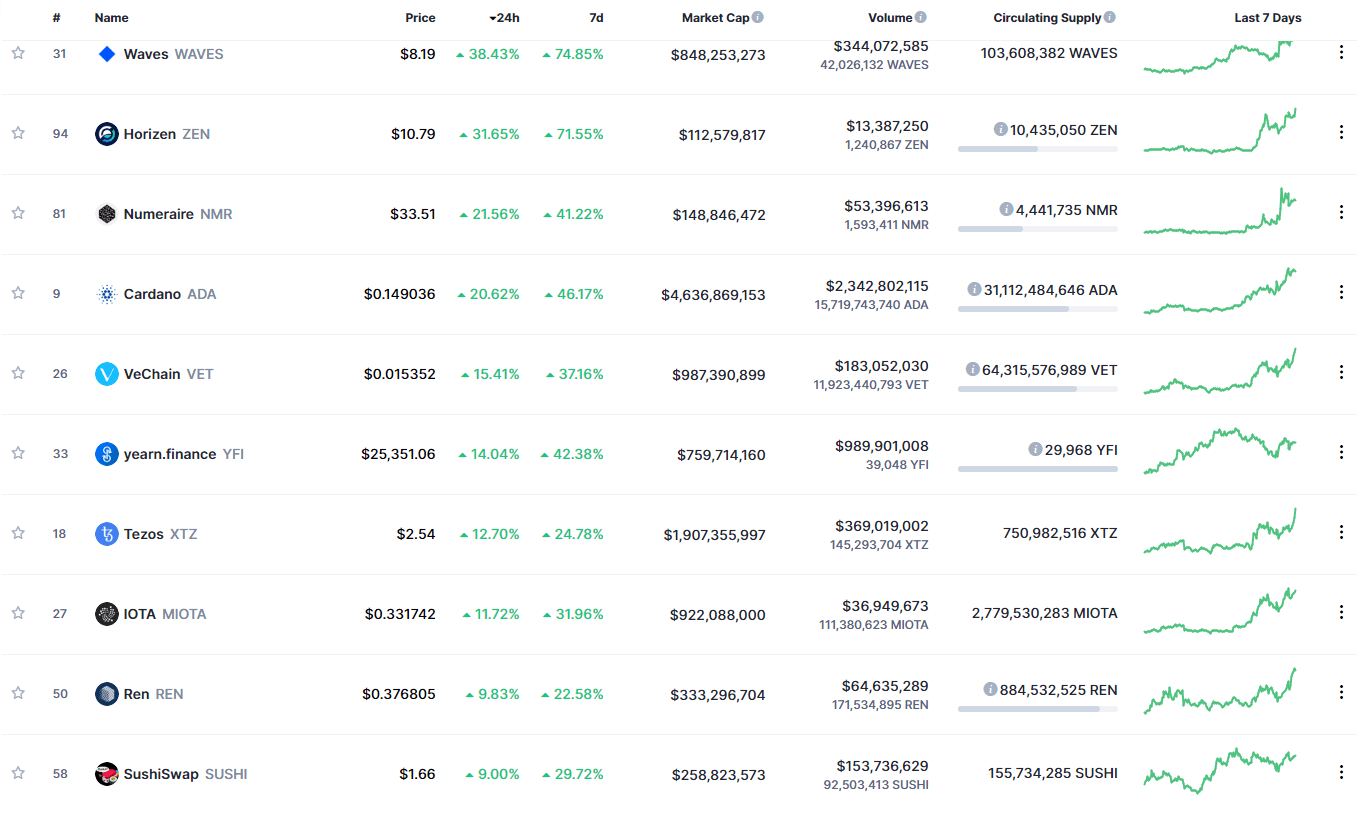
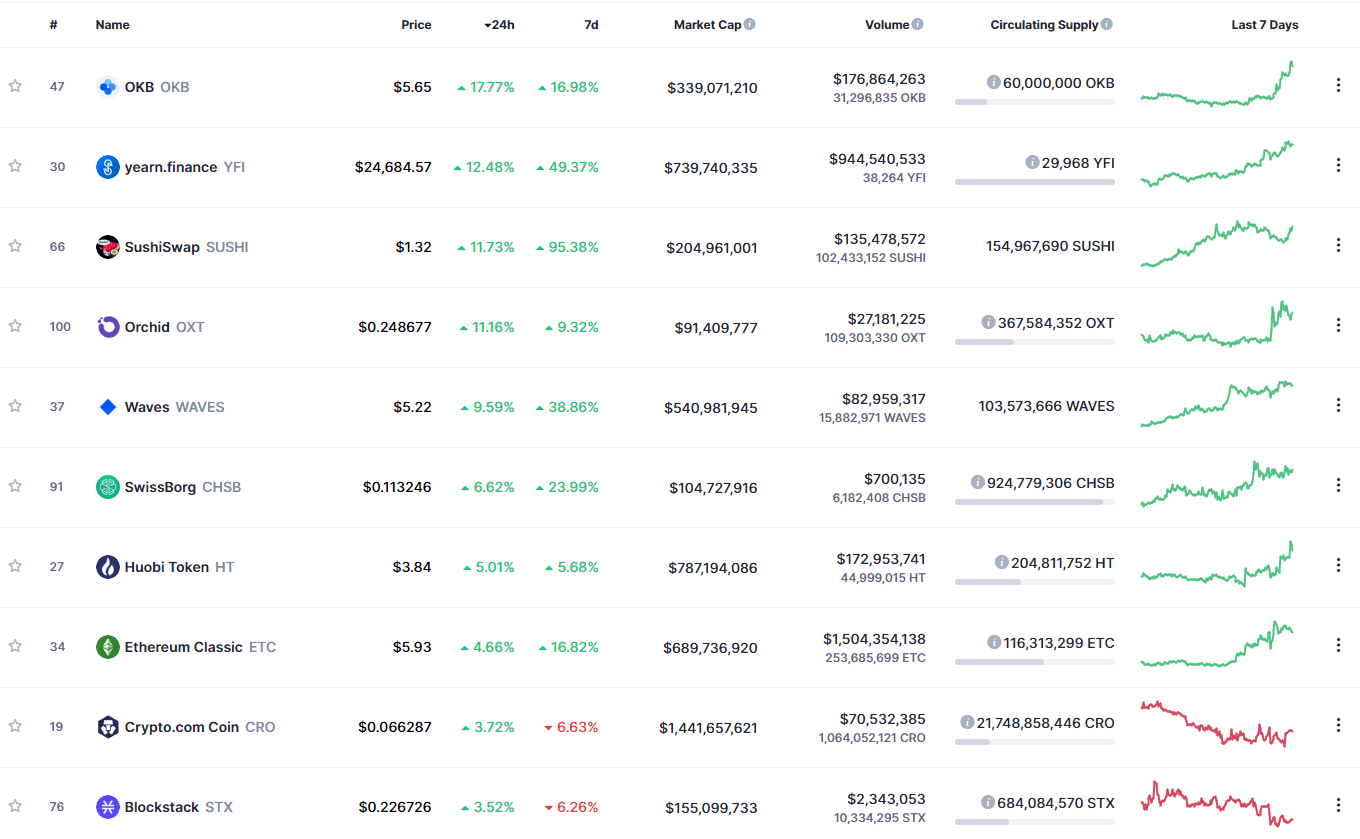
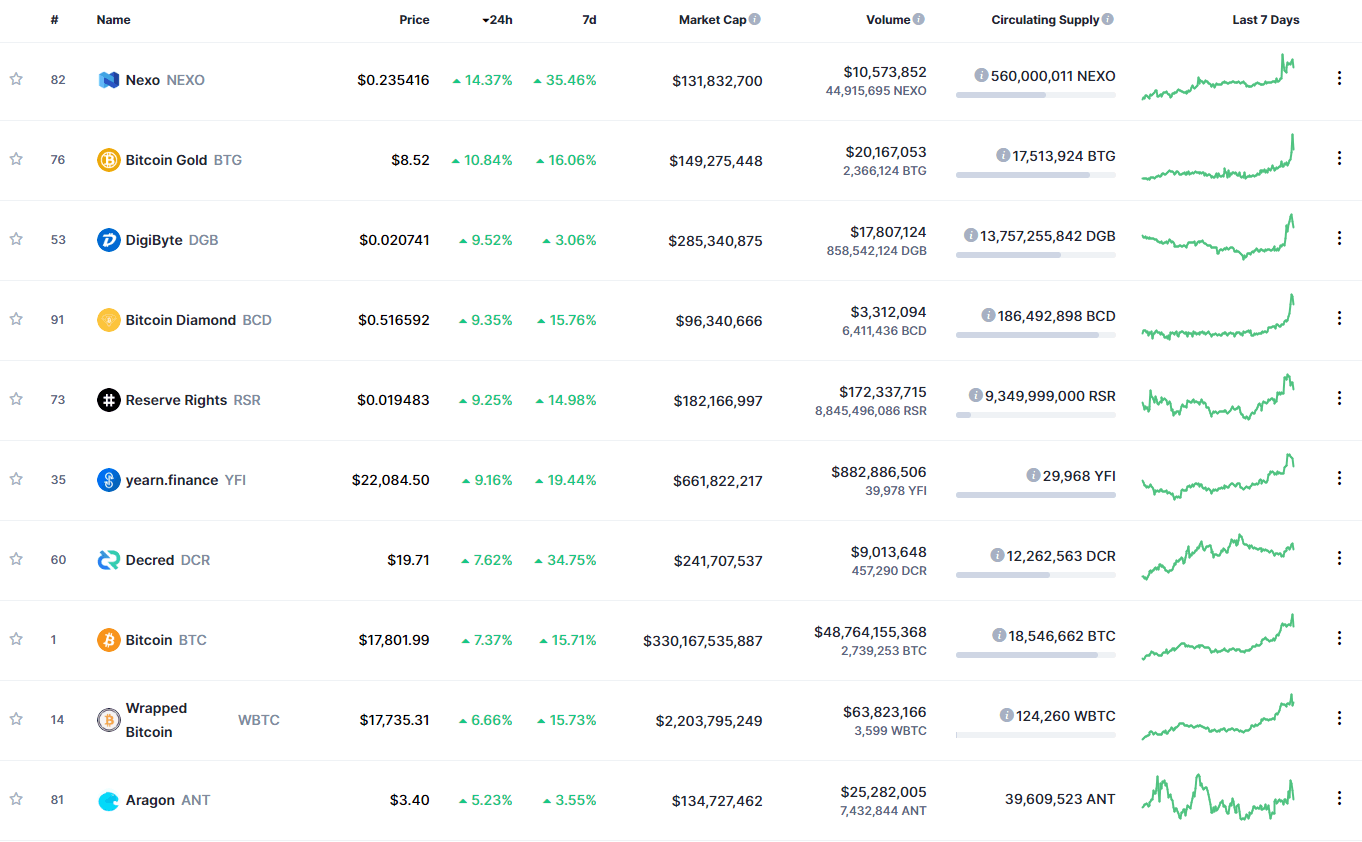
Top 10 24-hour Performers (Click to enlarge)
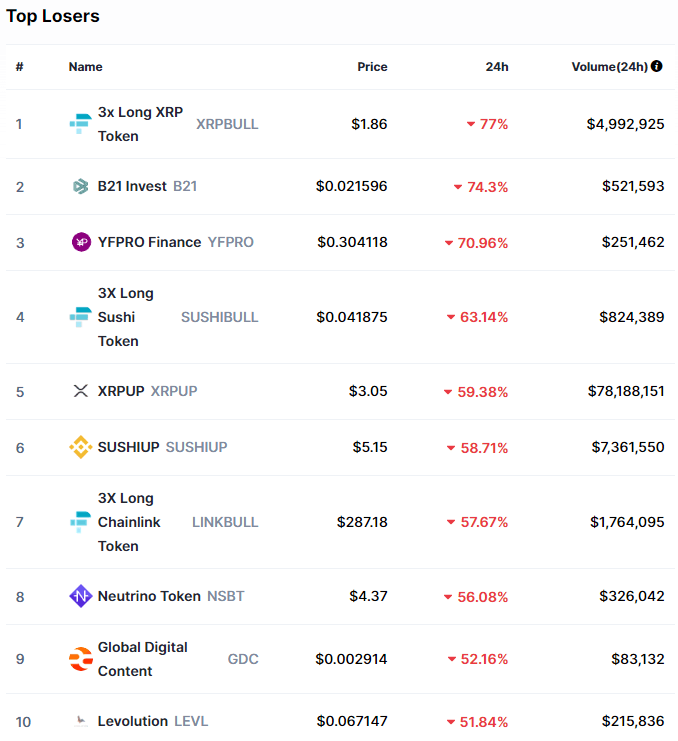
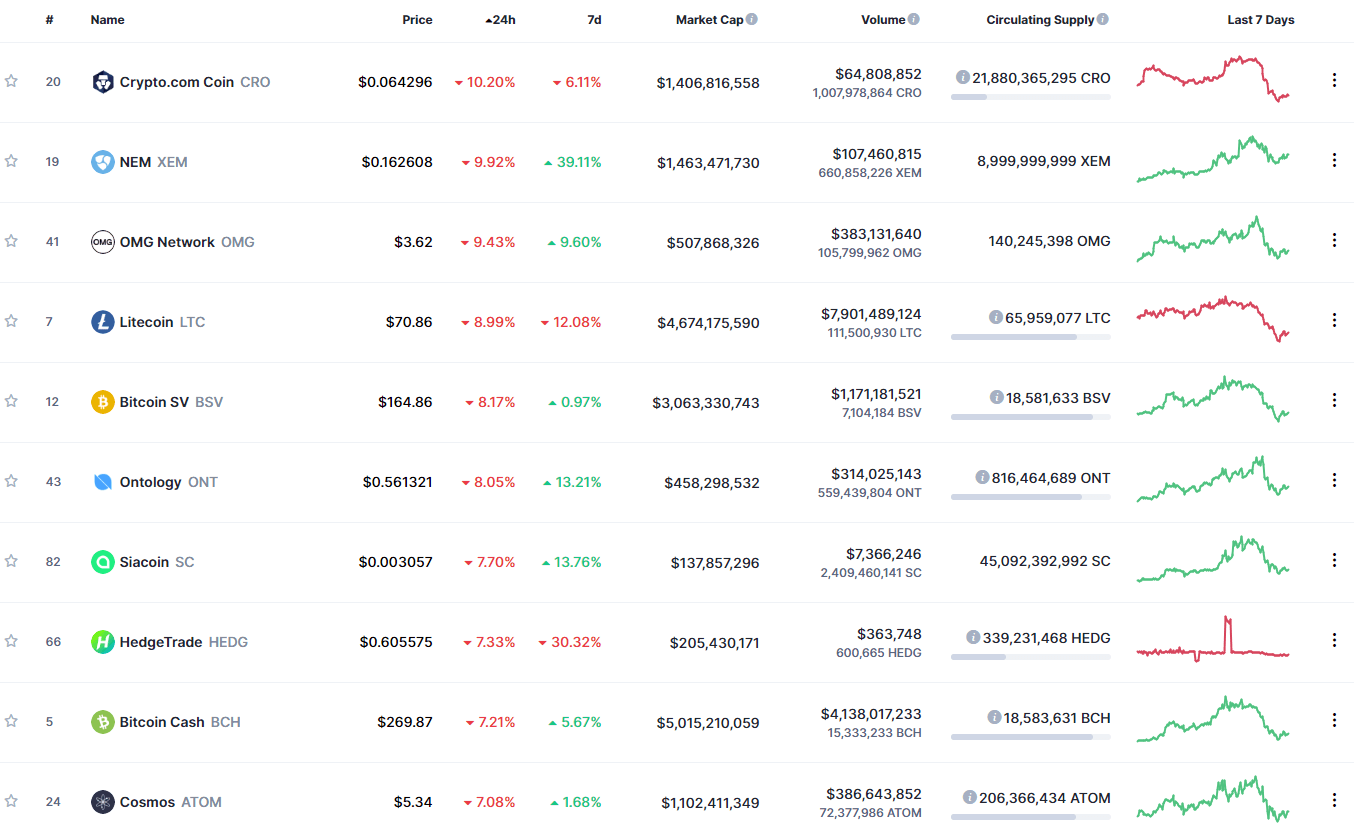
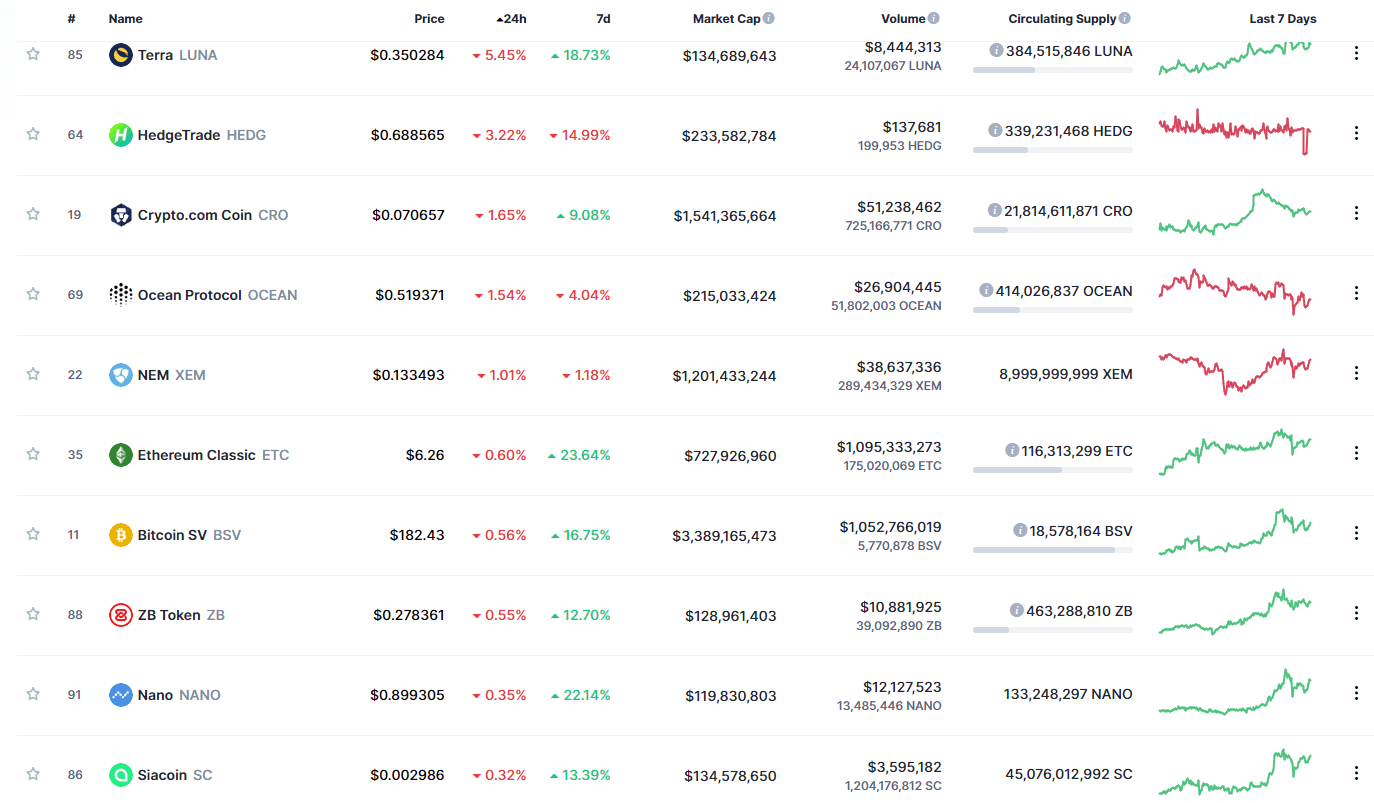
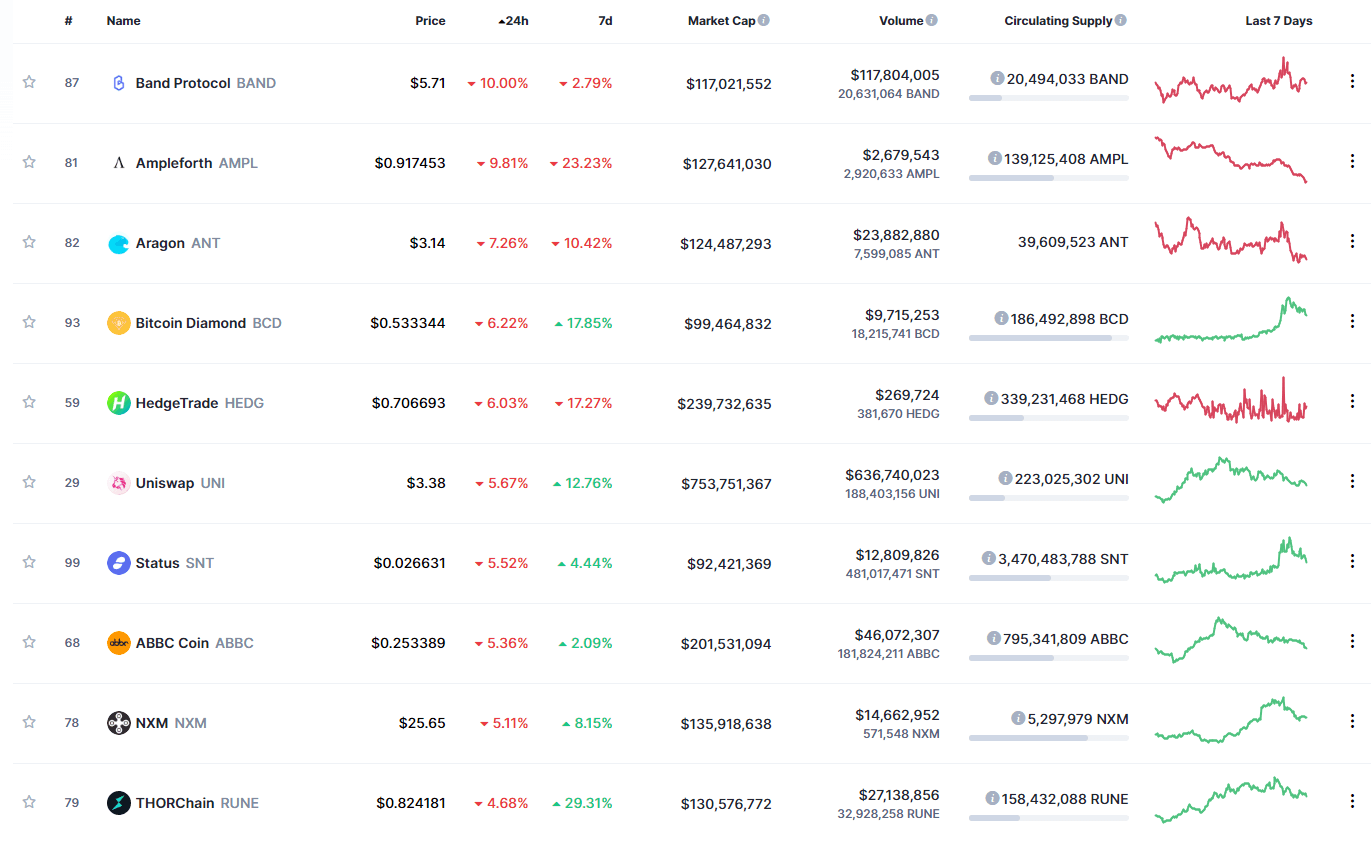
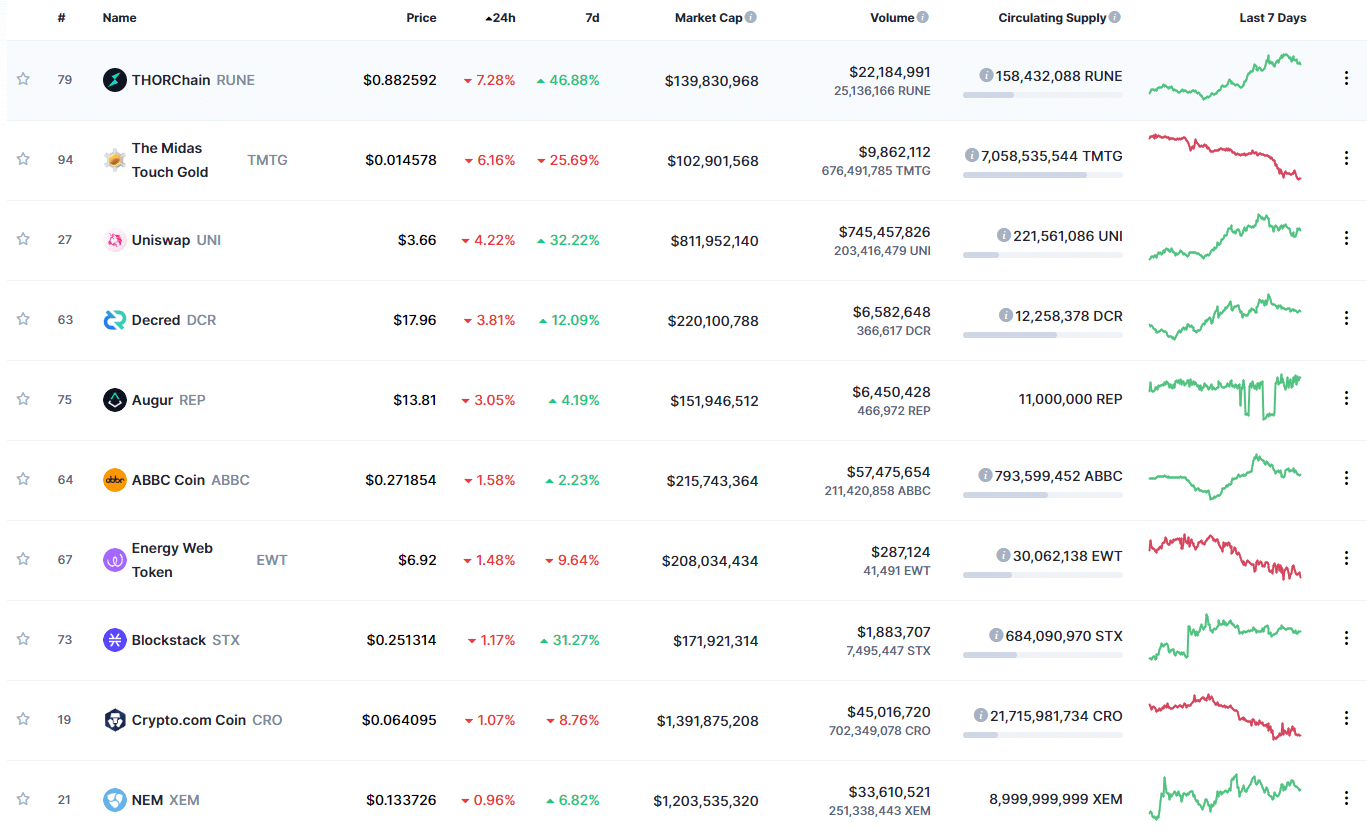
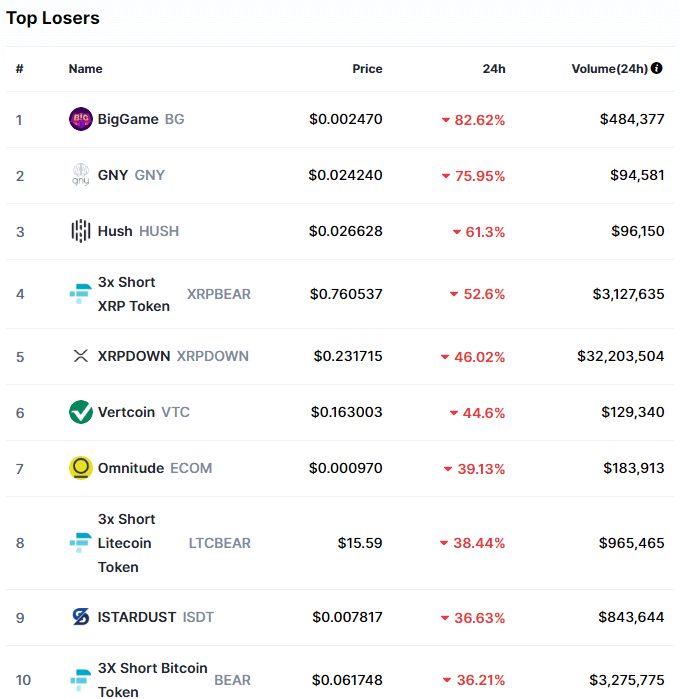
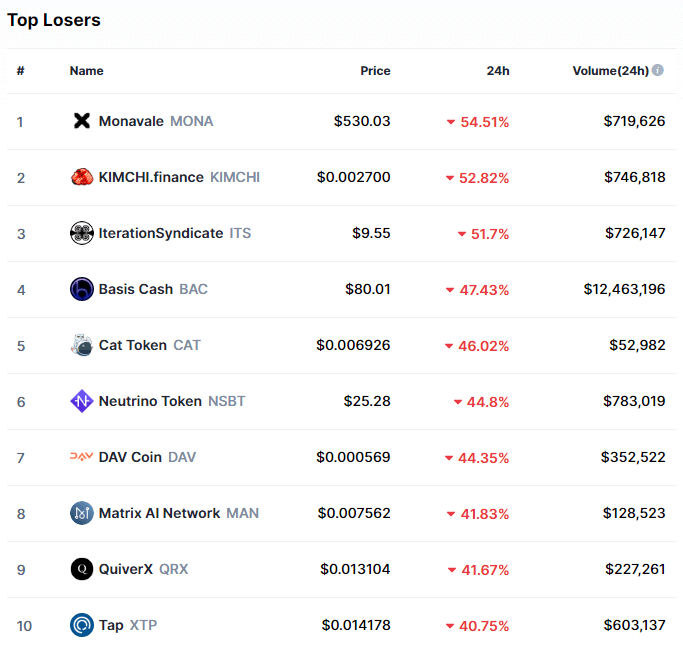
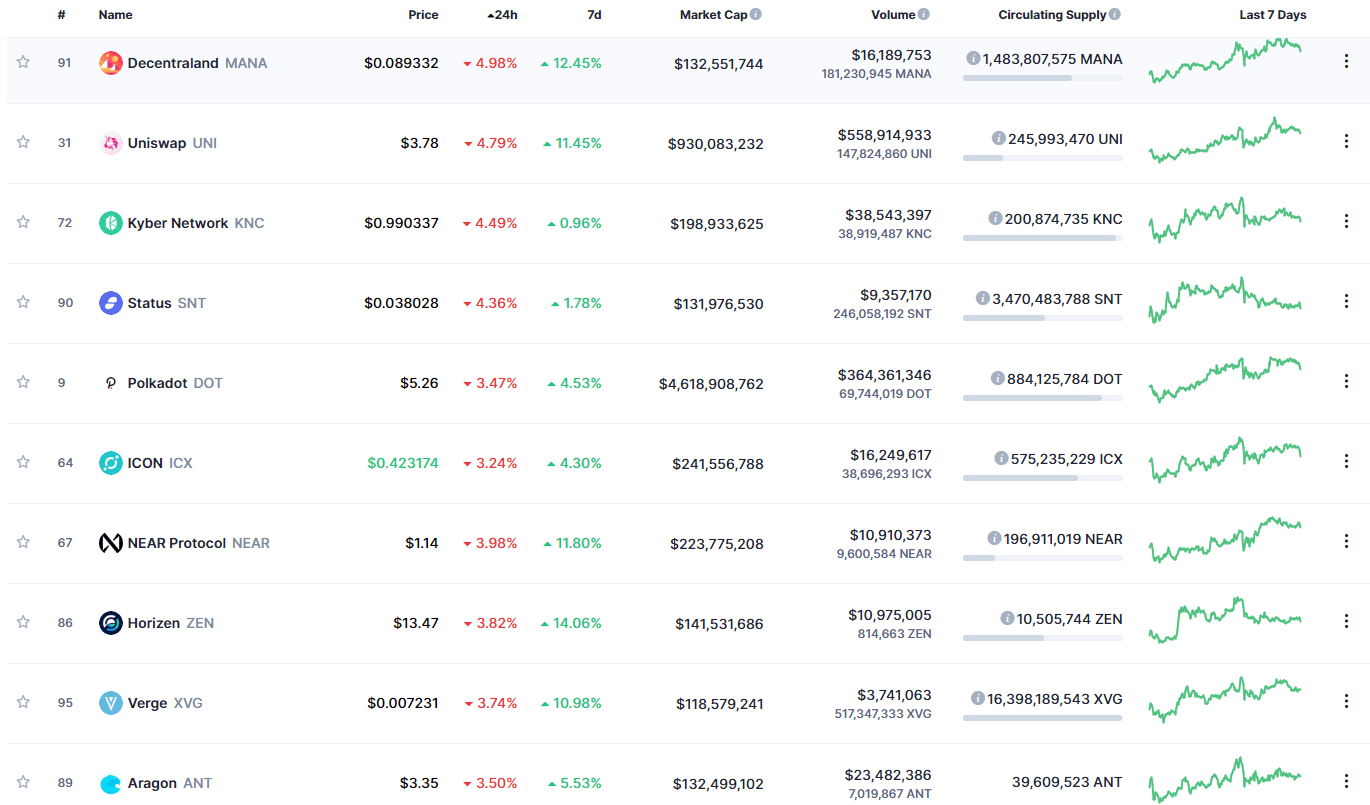
Bottom 10 24-hour Performers (Click to enlarge)
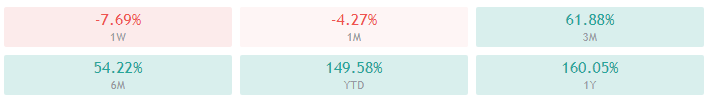
Bitcoin’s market dominance has moved up over one percent since our last report, with its value currently being 69.3%. This value represents a 1.5% difference to the upside than the value it had when we last reported.
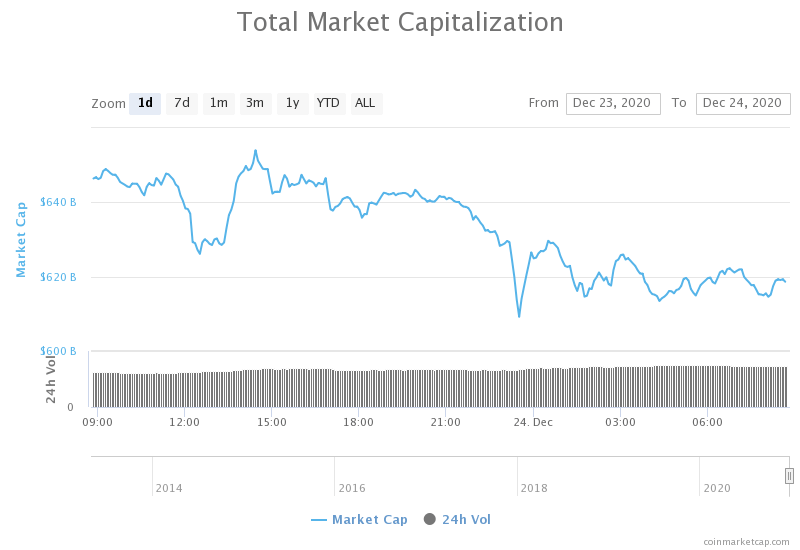
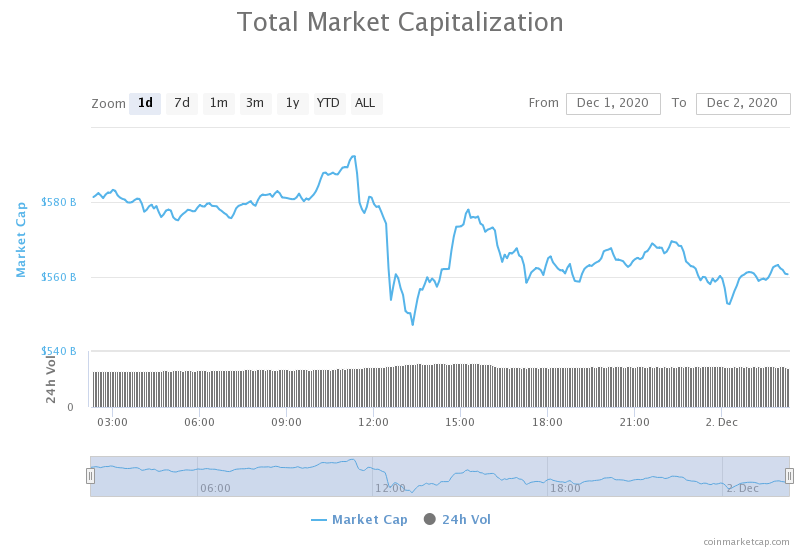
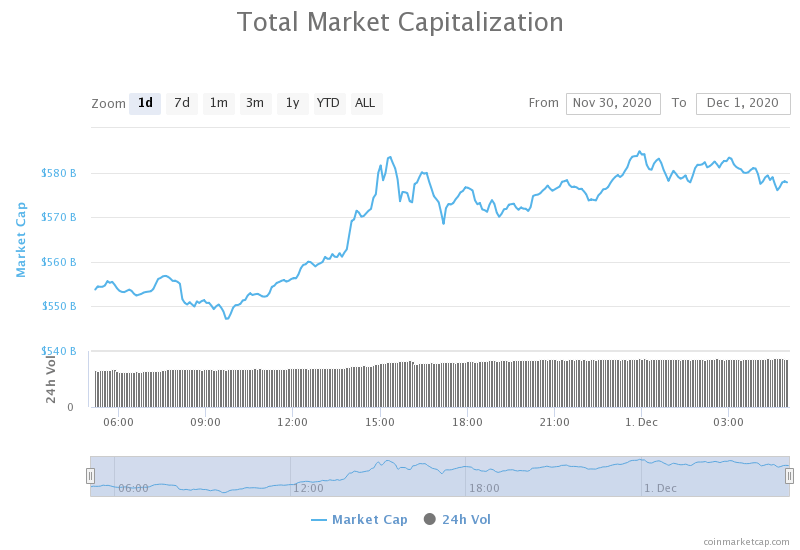
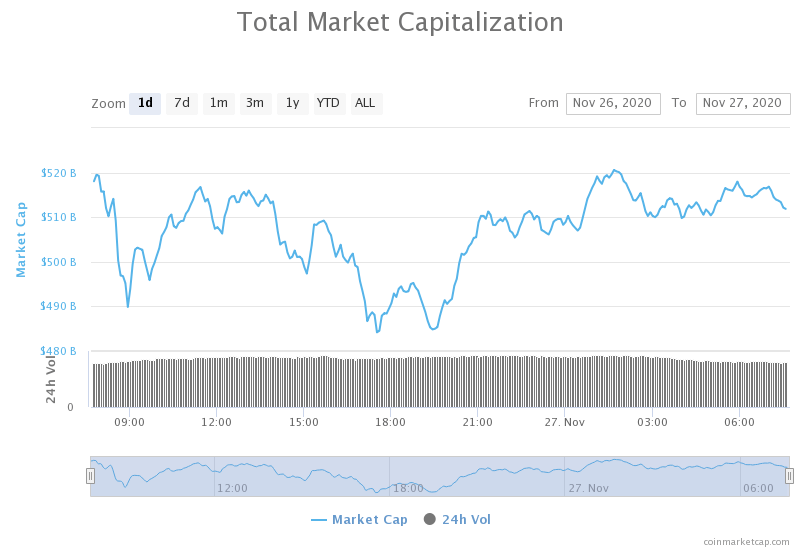
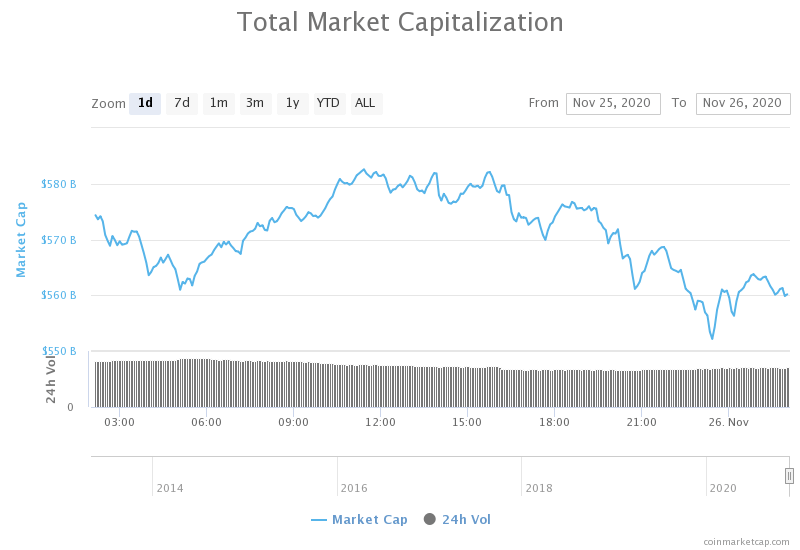
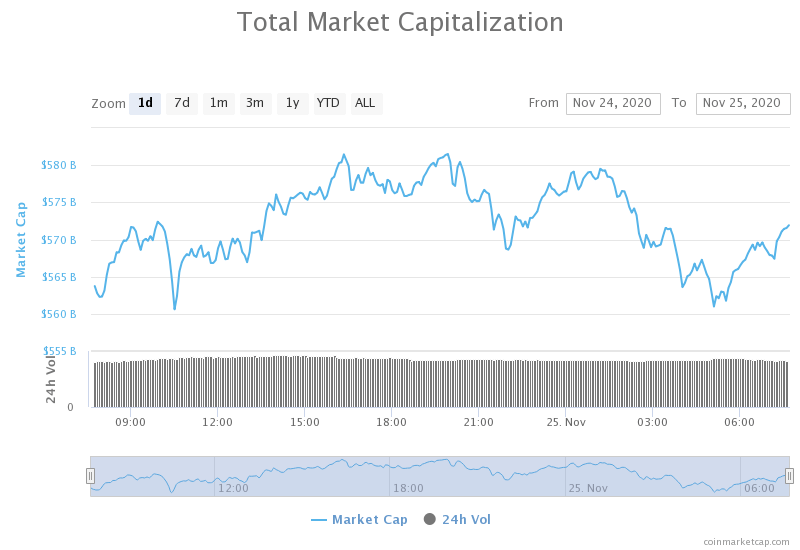
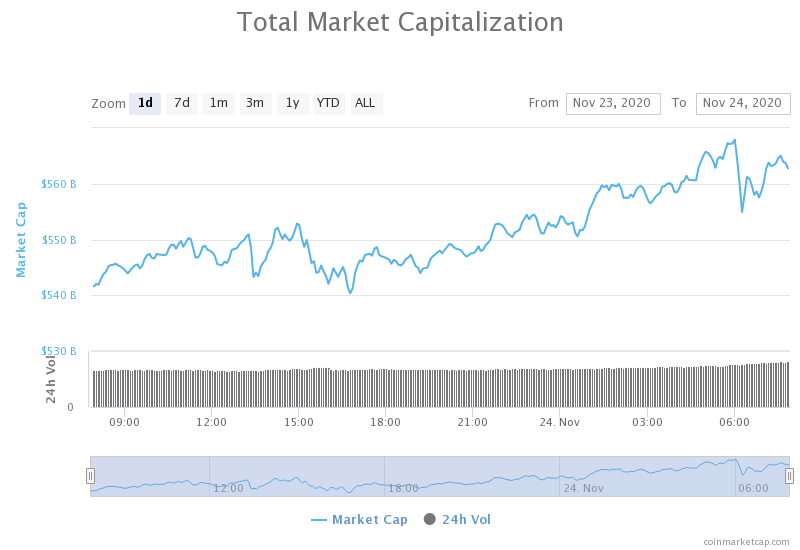
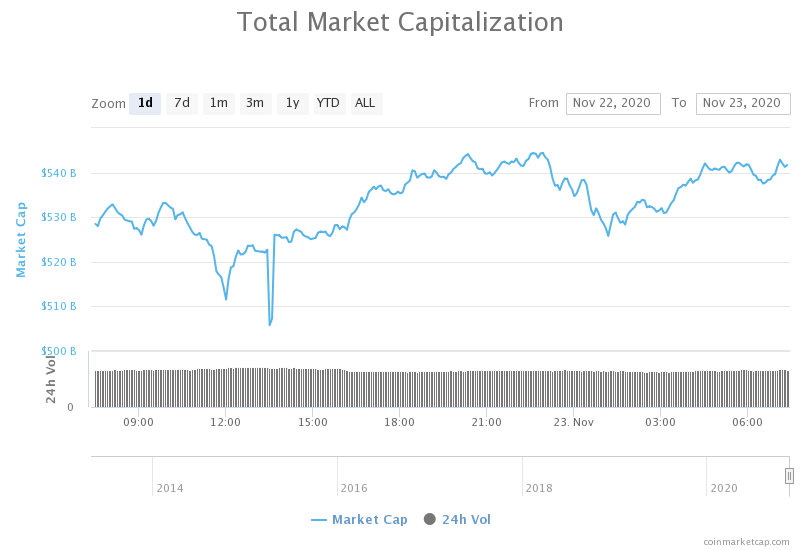
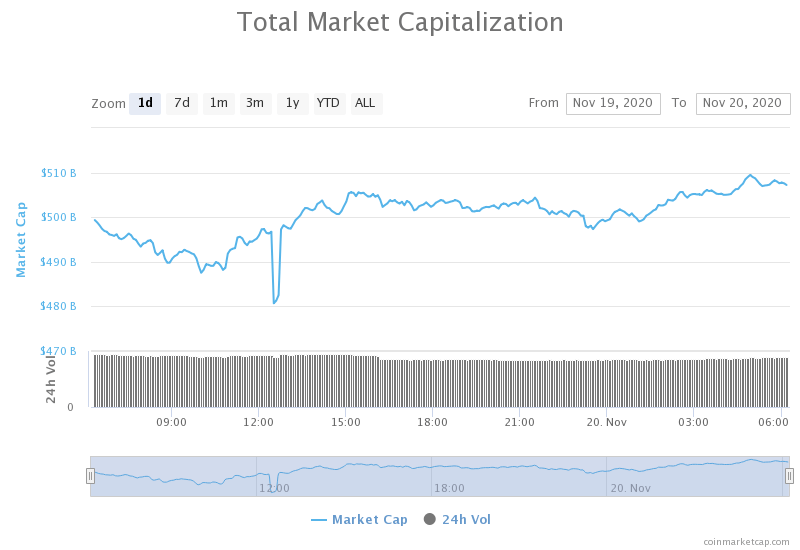
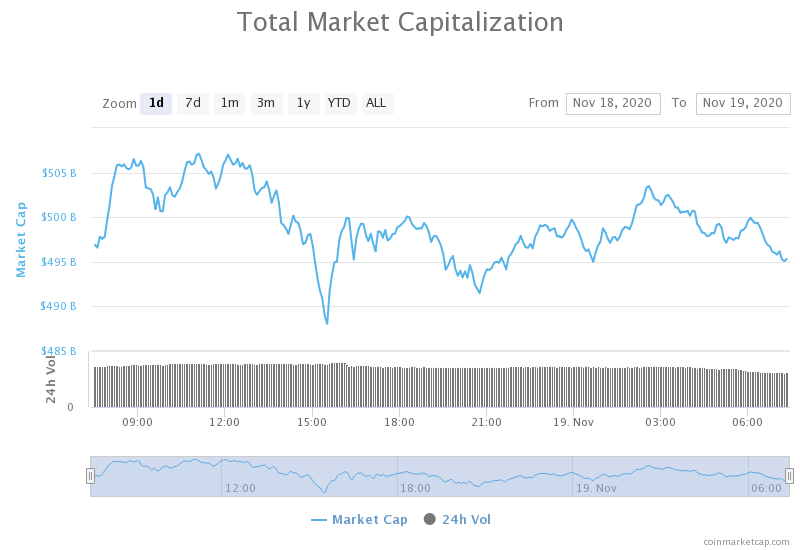
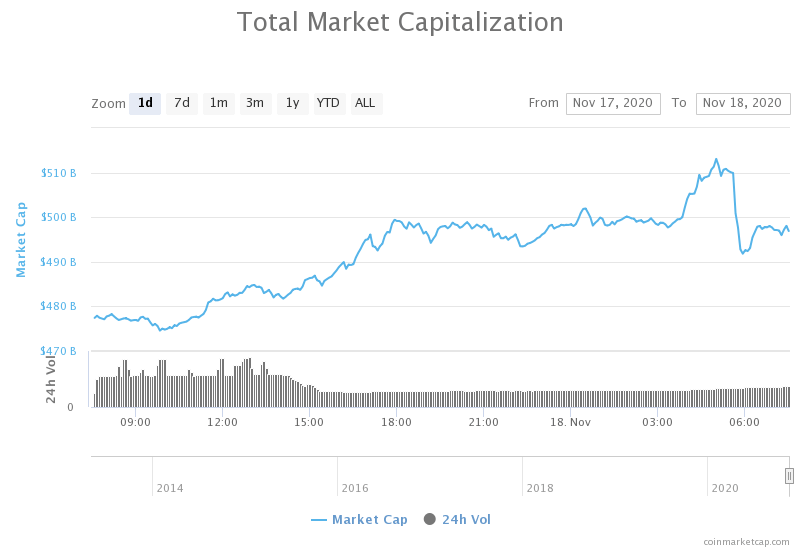
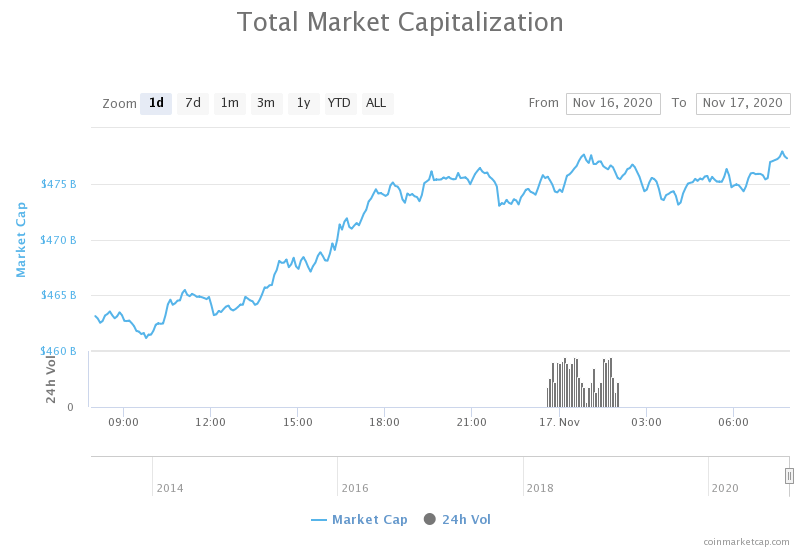
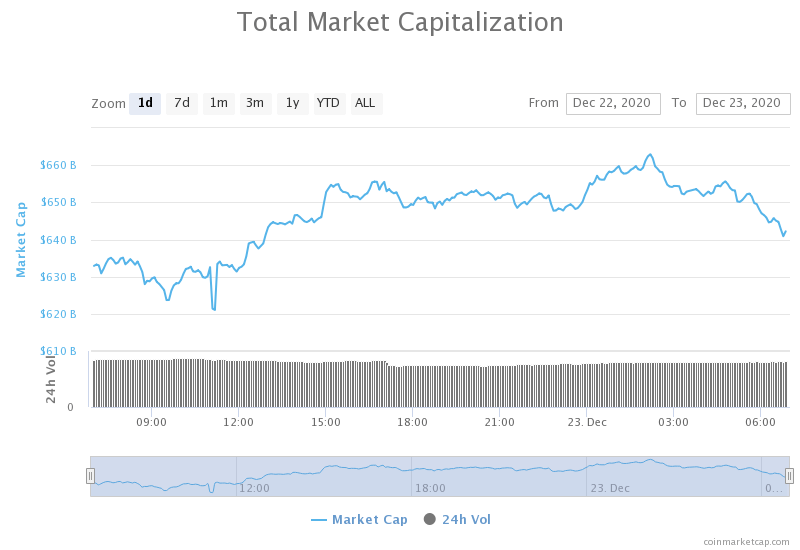
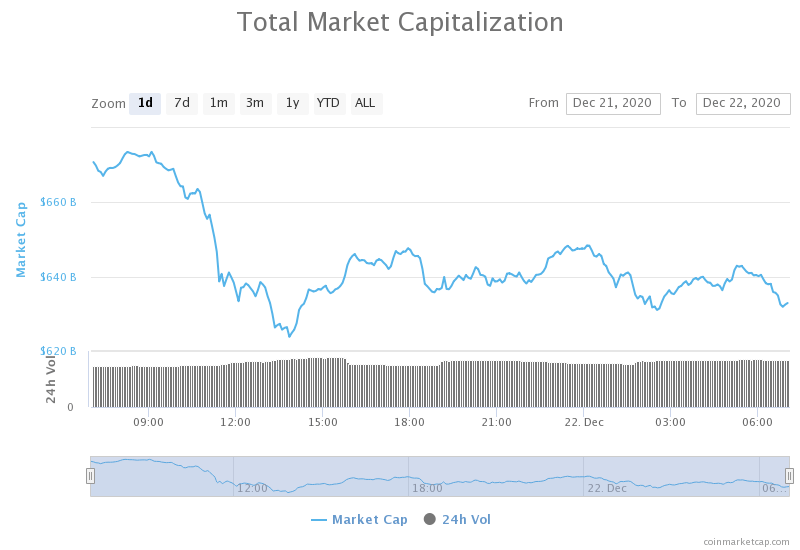
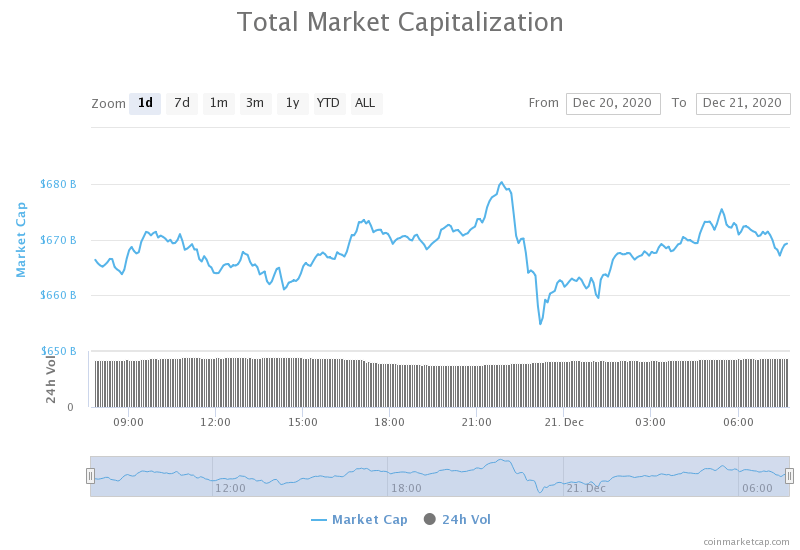
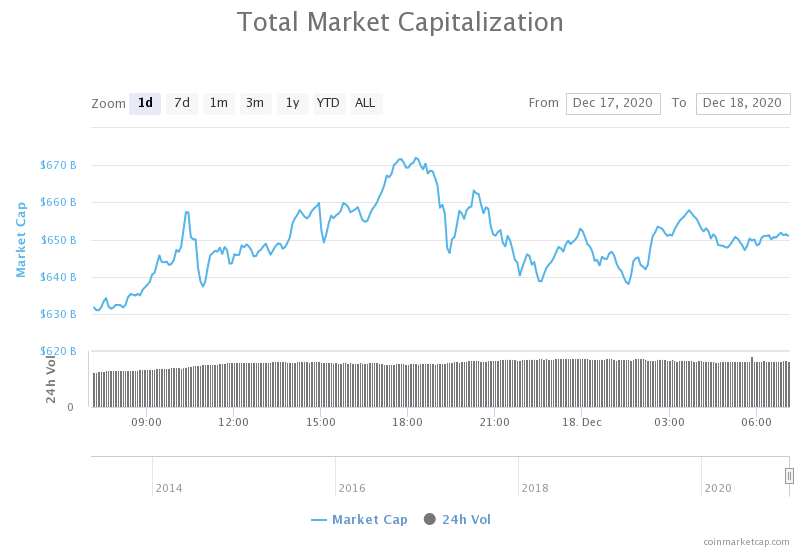
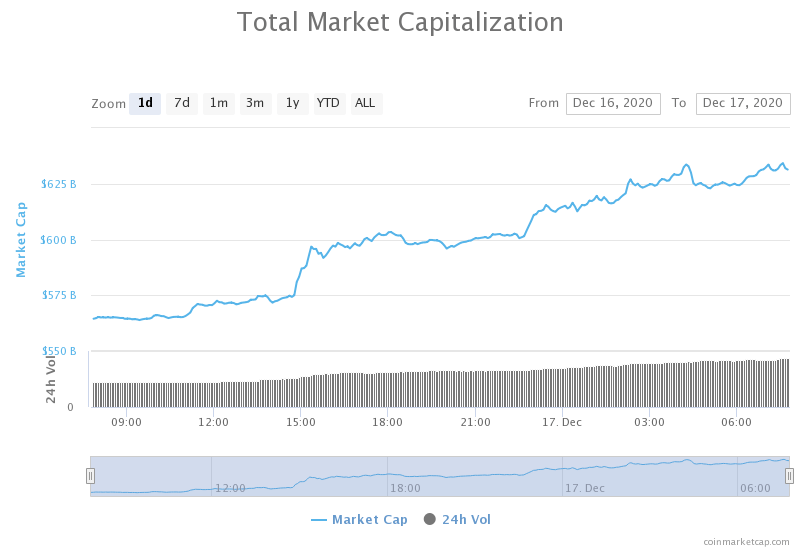
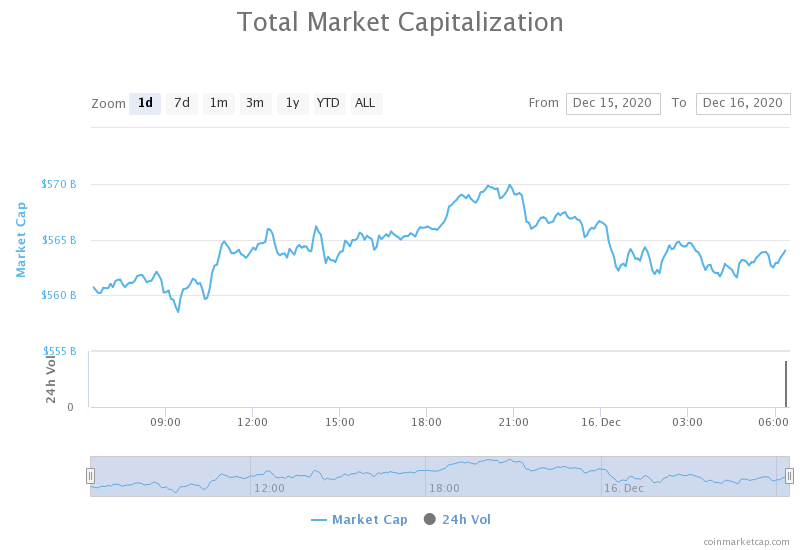
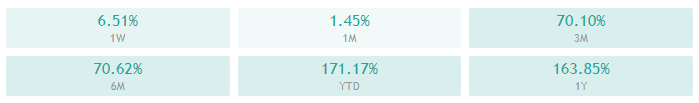
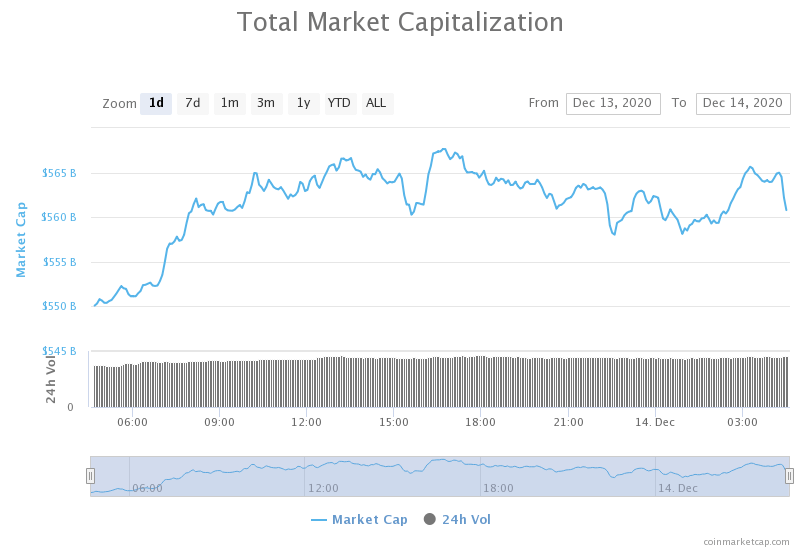
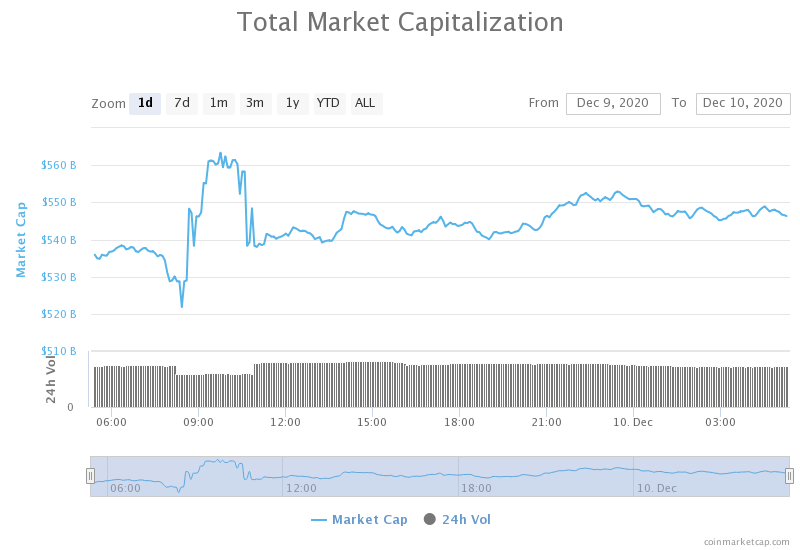
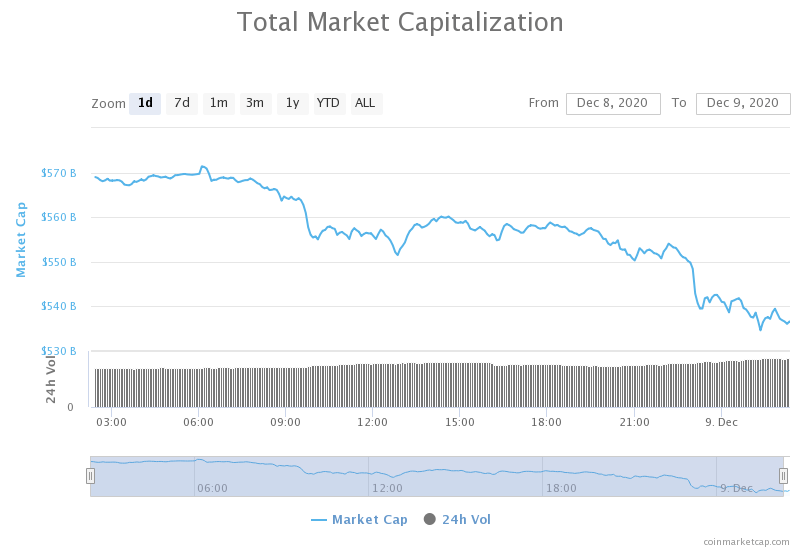
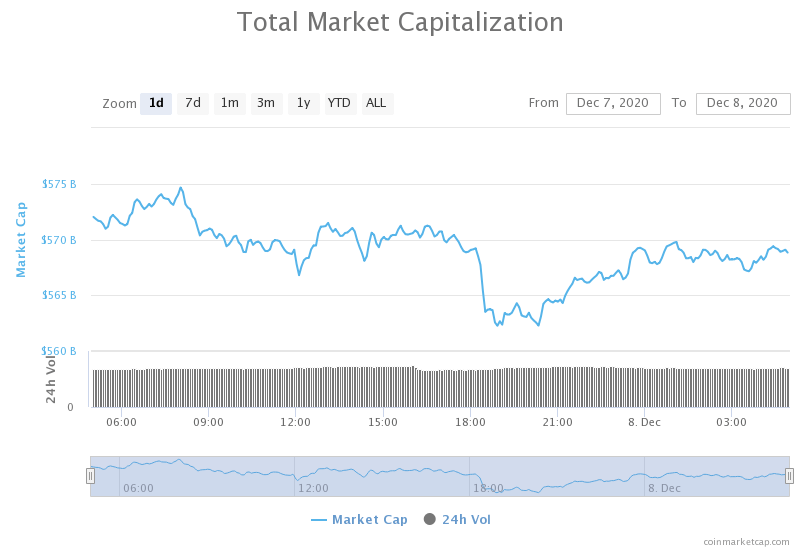
Daily Crypto Market Cap Chart
The cryptocurrency sector capitalization has decreased significantly since we last reported, with its current value being $619.31 billion. This represents a $22.90 billion decrease when compared to our previous report.
_______________________________________________________________________
What happened in the past 24 hours?
_______________________________________________________________________
- SEC chairman Jay Clayton publishes resignation letter and will step down after today (The Block)
- Simplex bars XRP transactions in wake of SEC’s Ripple lawsuit (The Block)
- White House releases stablecoin report, says regulators could consider limiting ‘multi-currency stablecoins’ (The Block)
- Former SEC Commissioner says Ripple lawsuit will cause ‘multi-billion dollar losses to innocent third parties’ (The Block)
- Bitwise Liquidates XRP Position After Ripple’s SEC Lawsuit (Cryptobriefing)
- Synthetix DeFies odds, surges 30% despite Ethereum drop from year-to-date highs (Cryptoslate)
- FinCEN’s Proposed Crypto Wallet Rule Might Hit DeFi (Coindesk)
- Survey: Almost one in five adult Australians own crypto in 2020 (Cointelegraph)
- Korean crypto investment company launches $120 million fund for blockchain projects (Cointelegraph)
- Bitmain’s ‘hard fork’ to end in $600M settlement in favor of Micree Zhan (Cointelegraph)
_______________________________________________________________________
Technical analysis
_______________________________________________________________________
Bitcoin
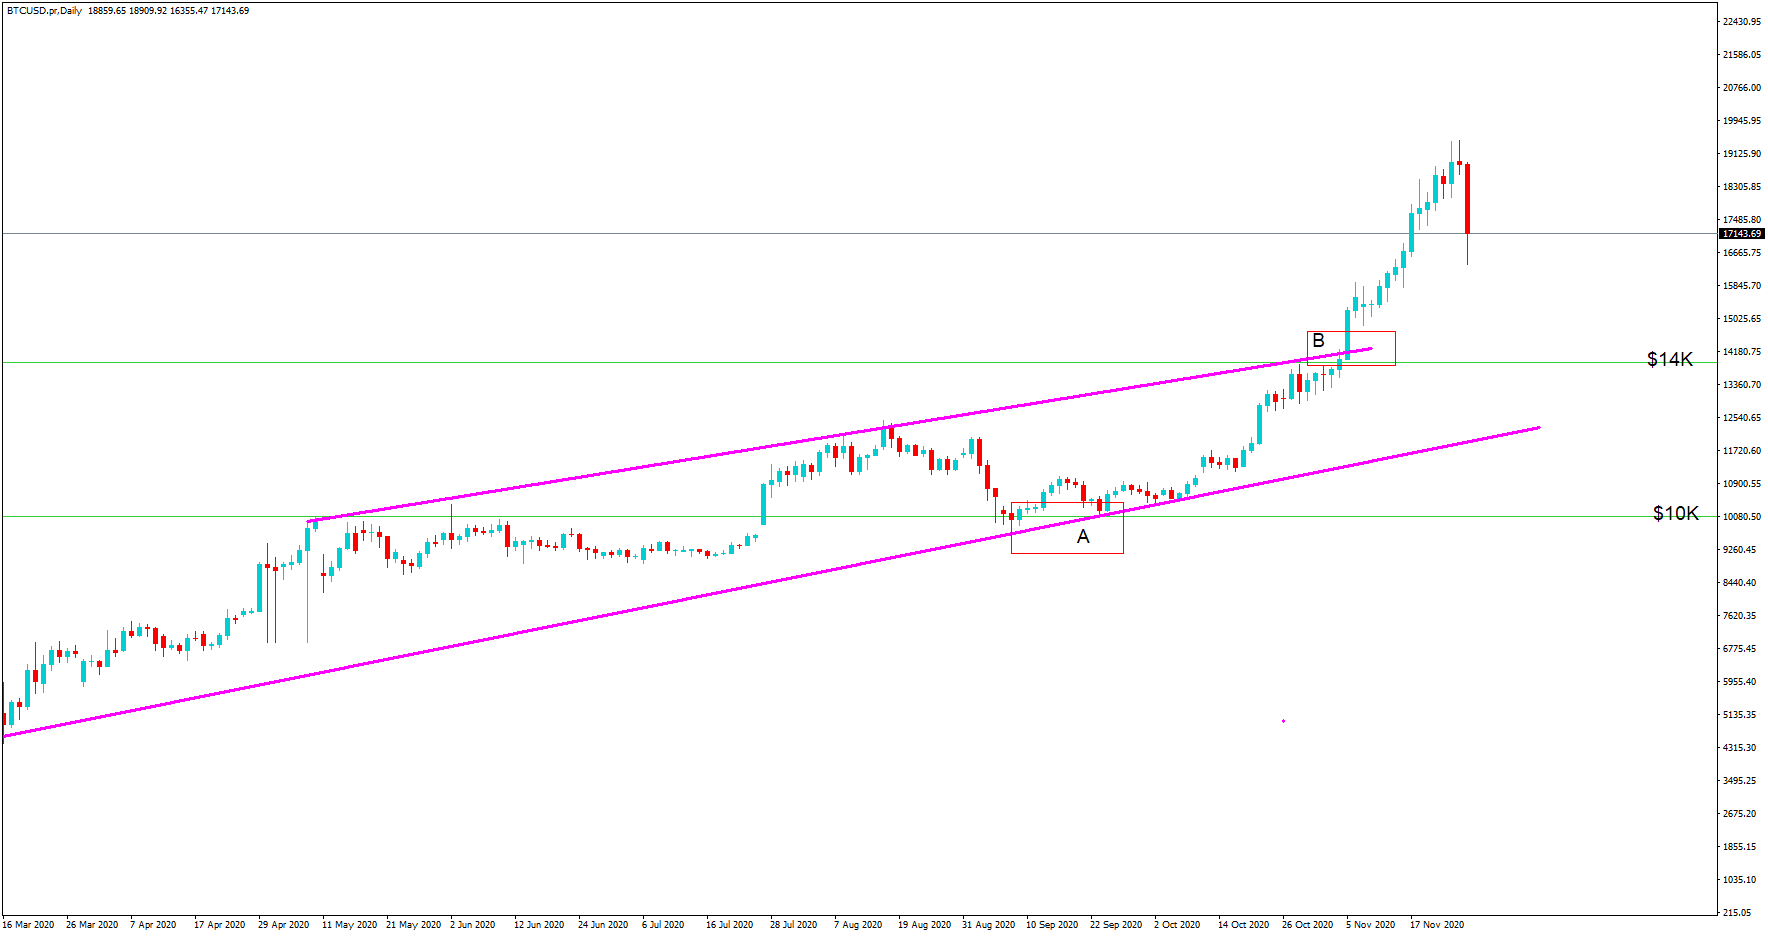
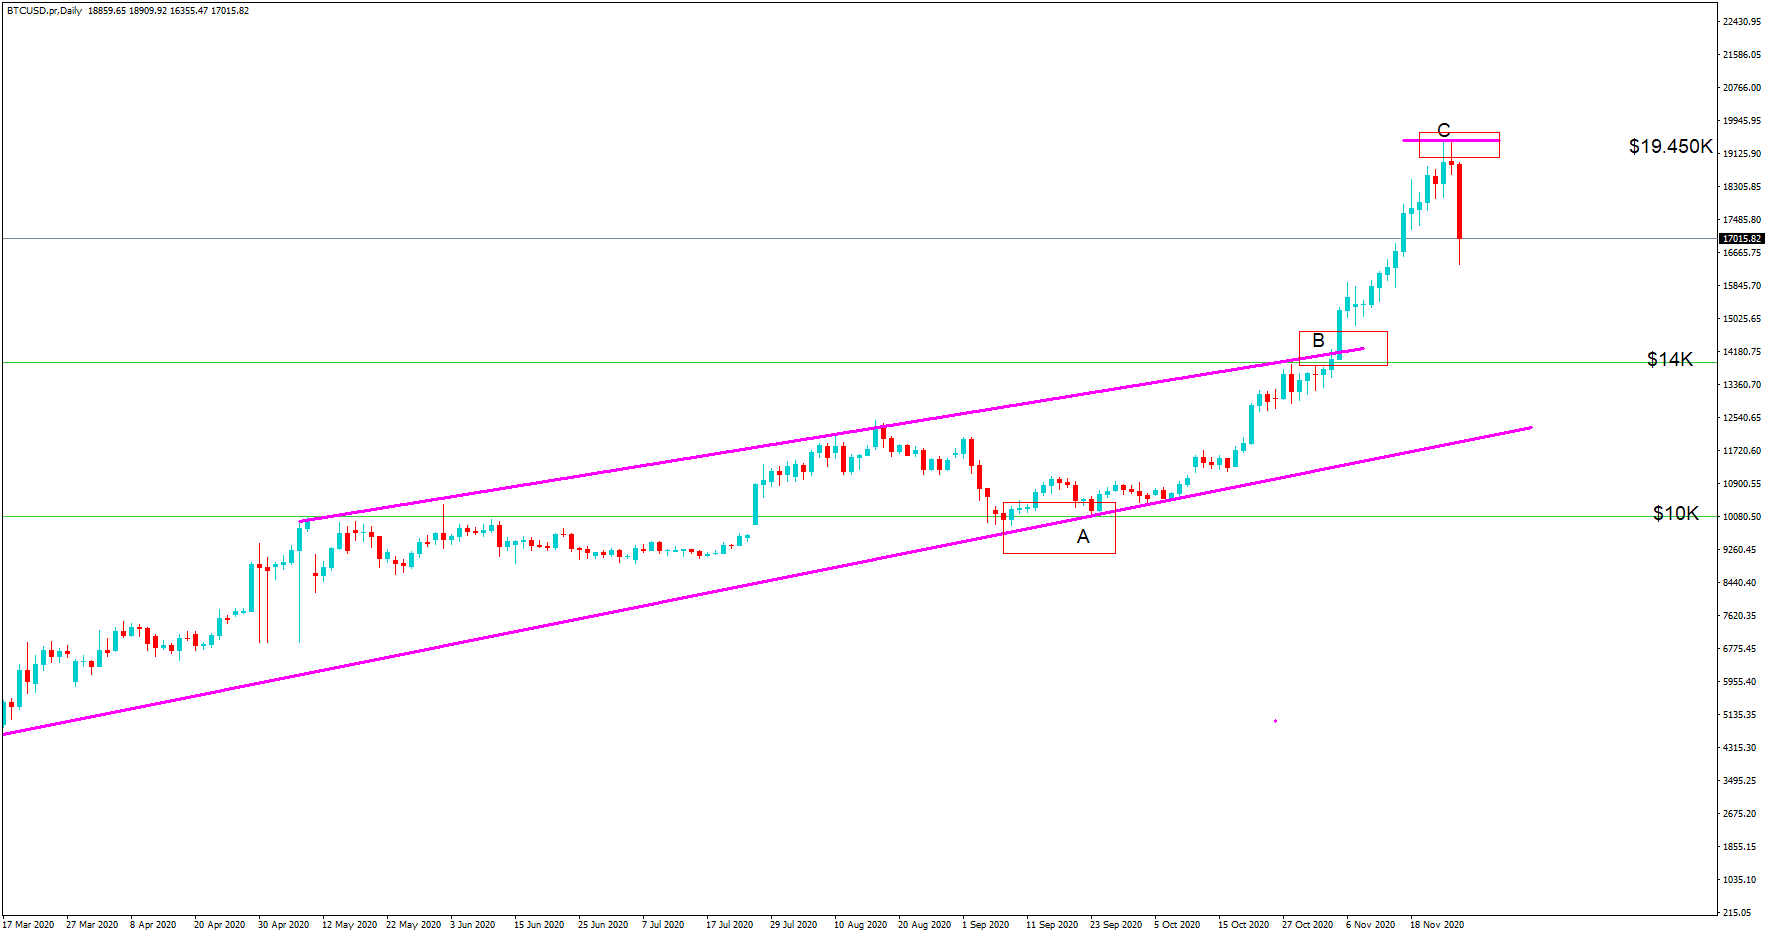
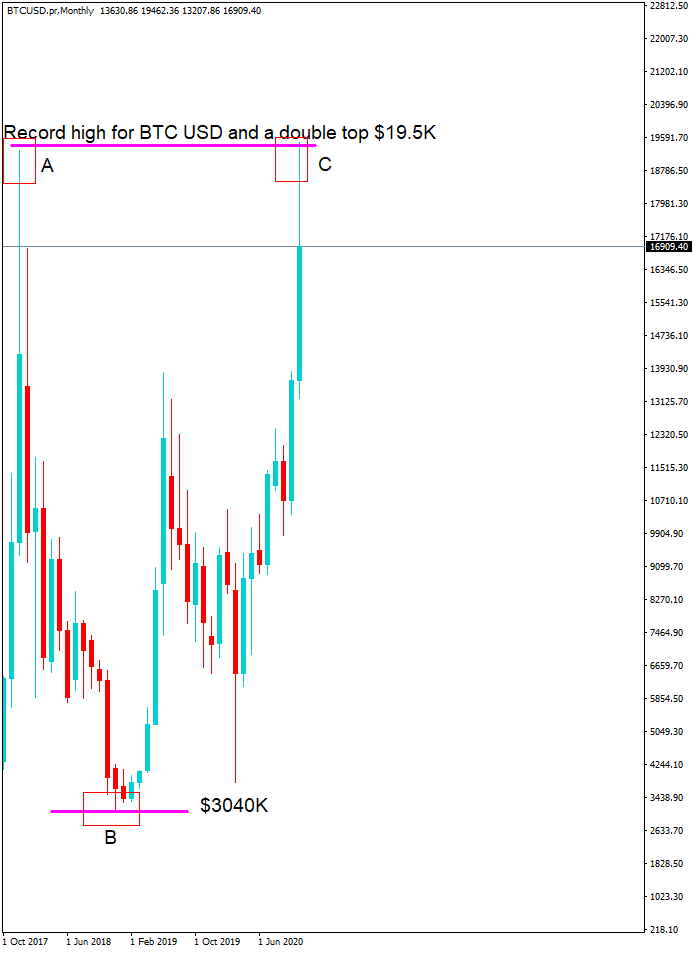
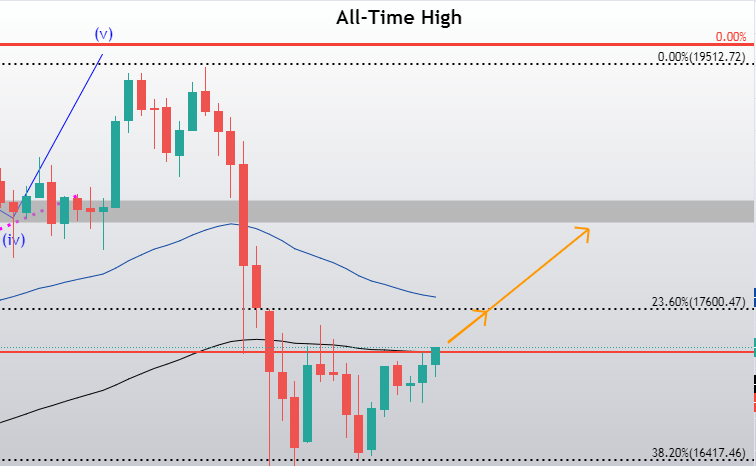
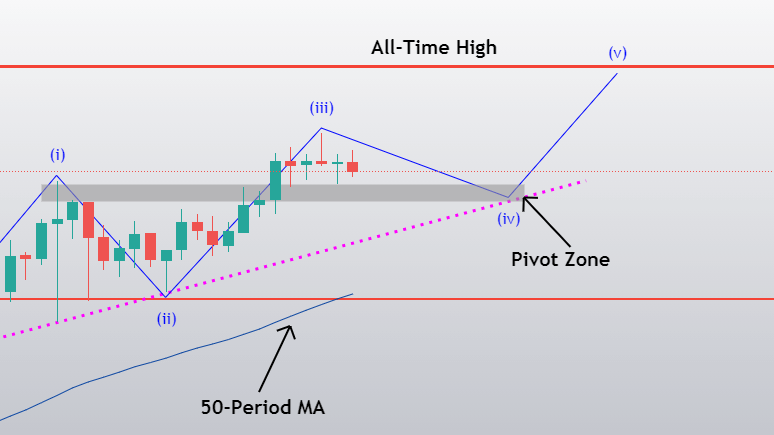
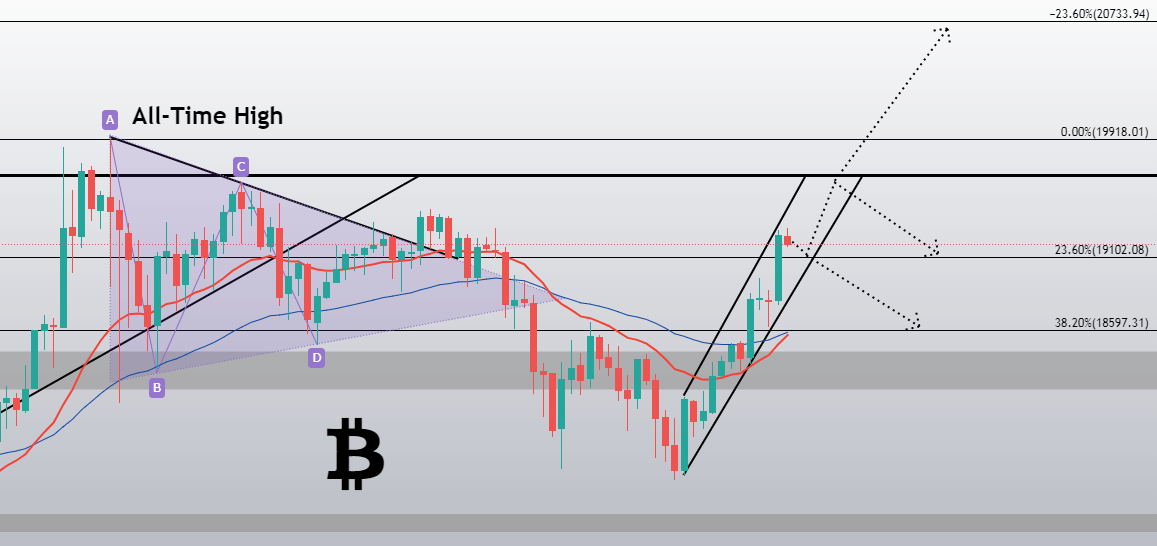
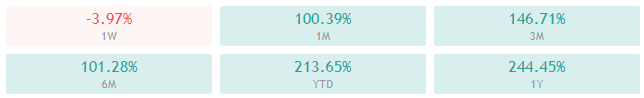
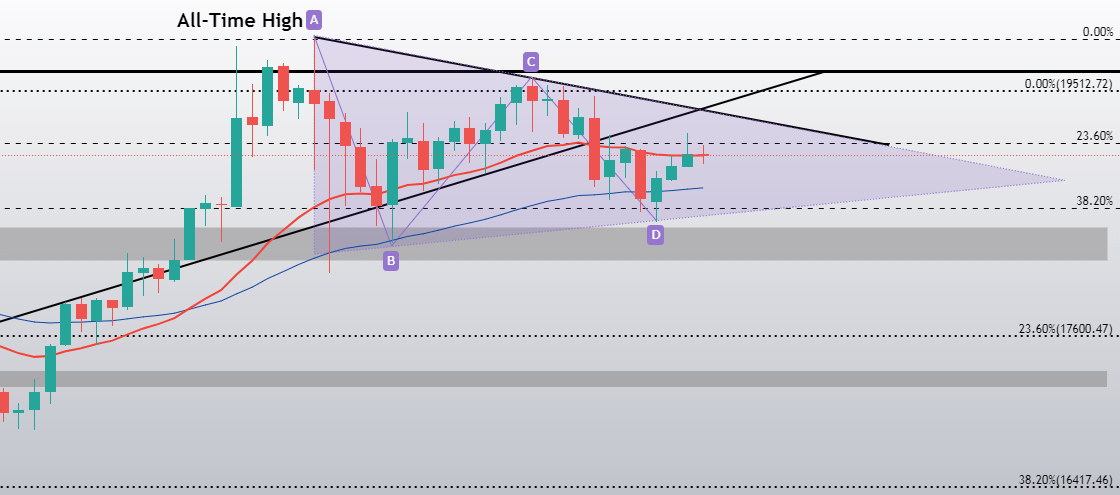
Bitcoin was one of the few cryptocurrencies not affected by the major downturn of XRP after the SEC announced a lawsuit against Ripple and its executives. The largest cryptocurrency by market cap stayed within its wide range and continued trading sideways after bouncing back from the $24,000 level.
Traders currently have the option to catch a couple of safe trades within the trading range Bitcoin is in, or wait for it to spike in volume and break the range (either to the downside or upside).
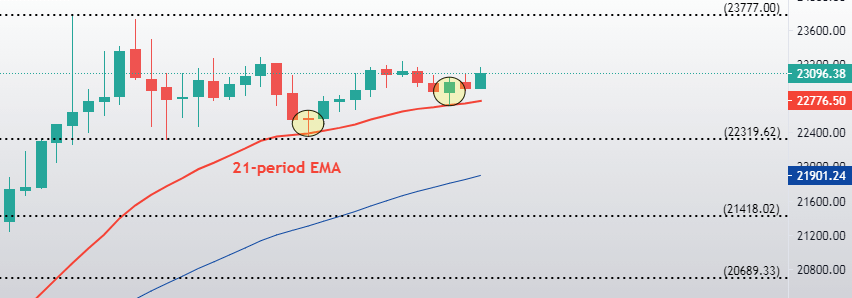
BTC/USD 4-hour chart
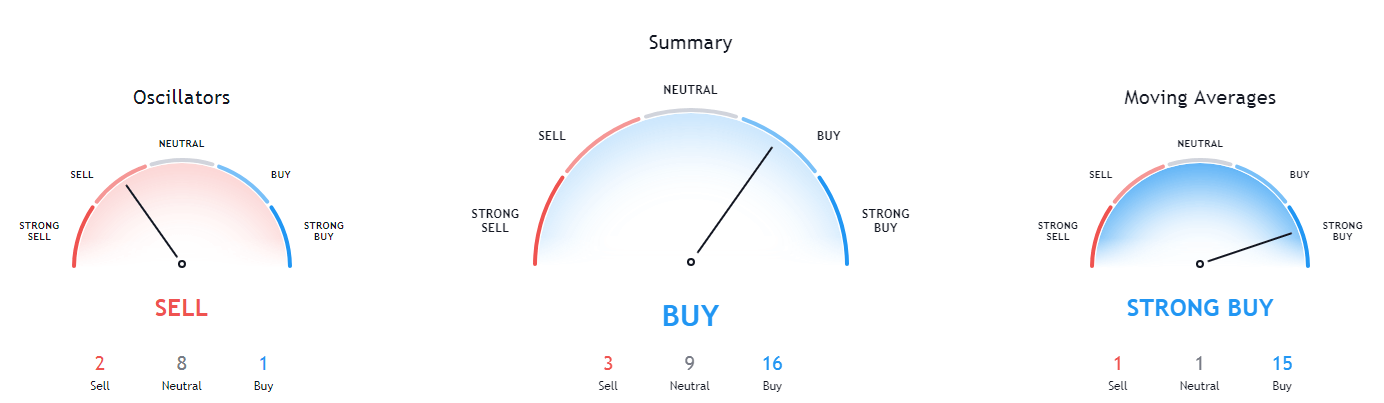
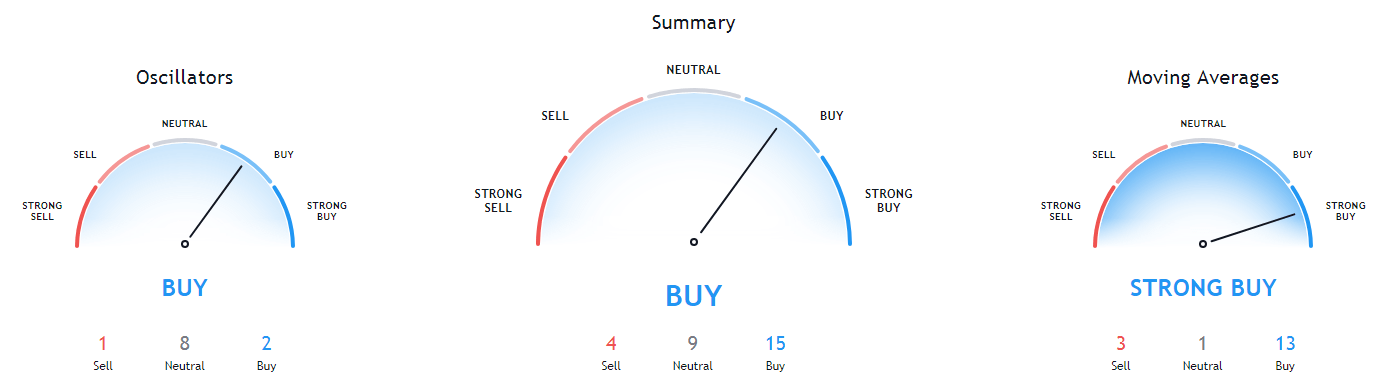
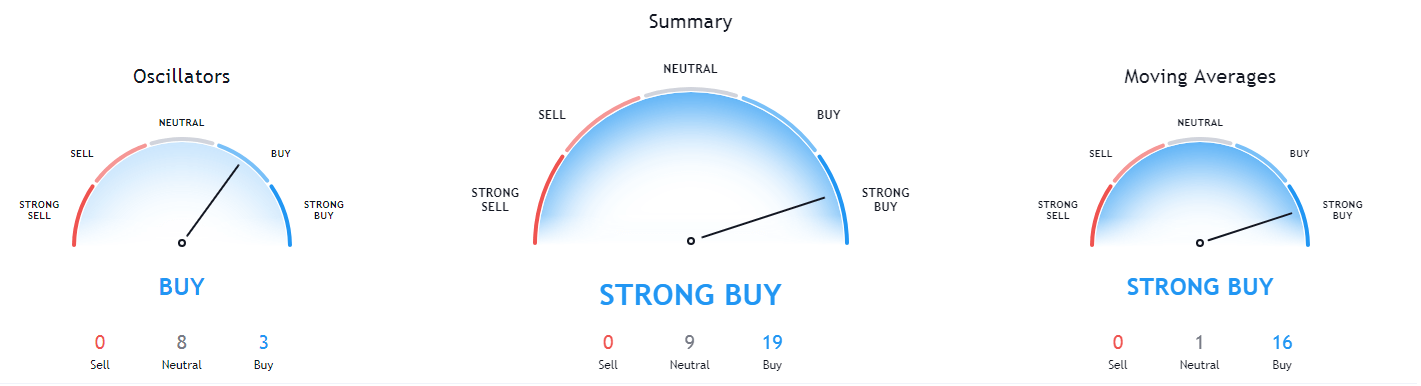
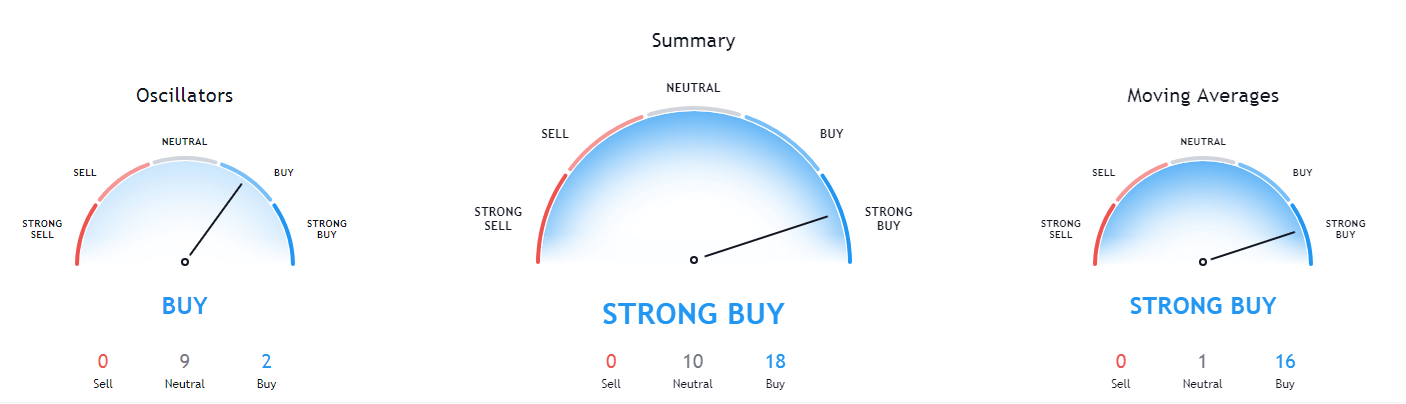
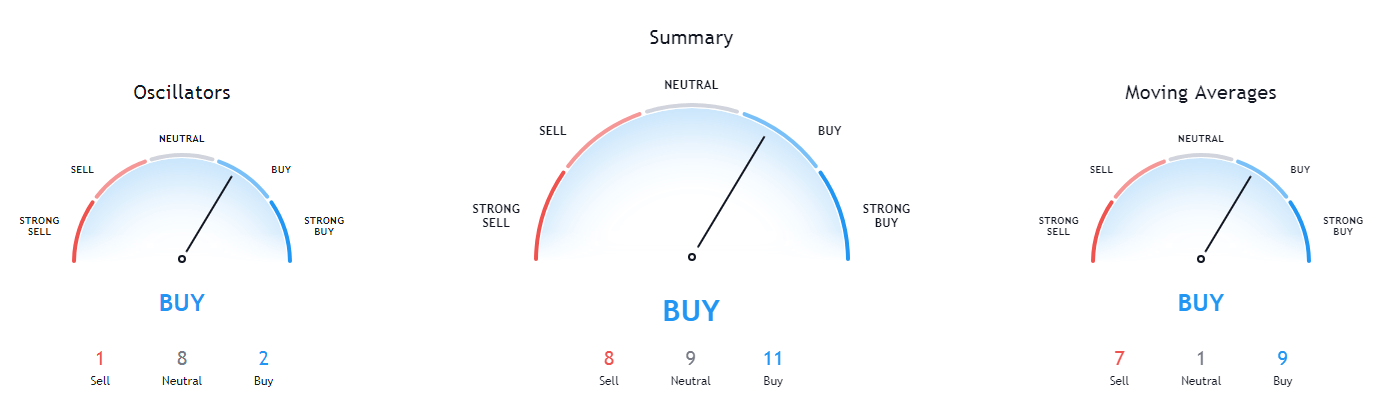
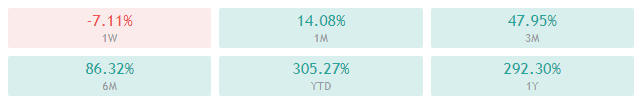
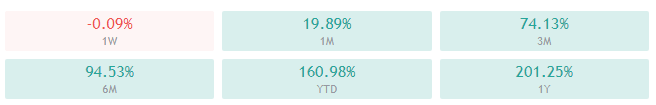
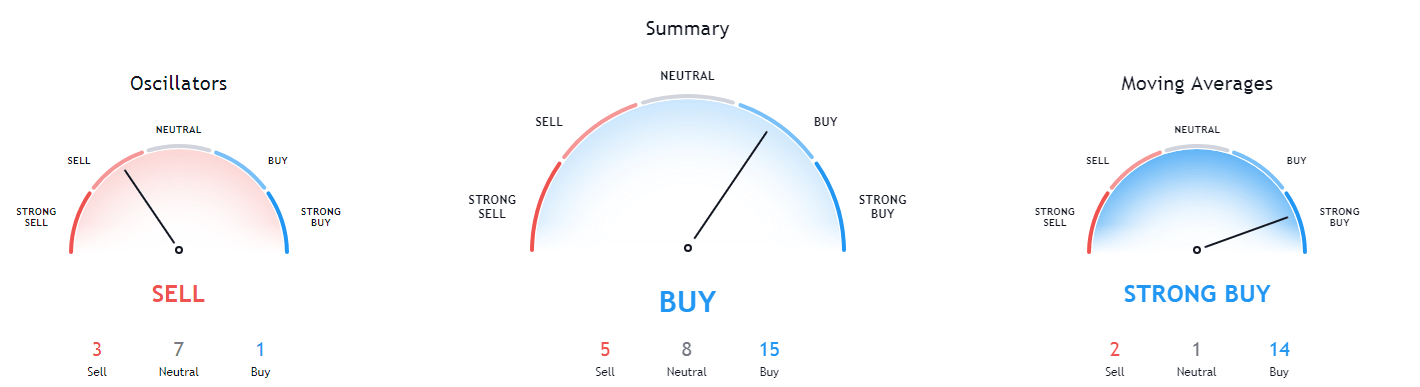
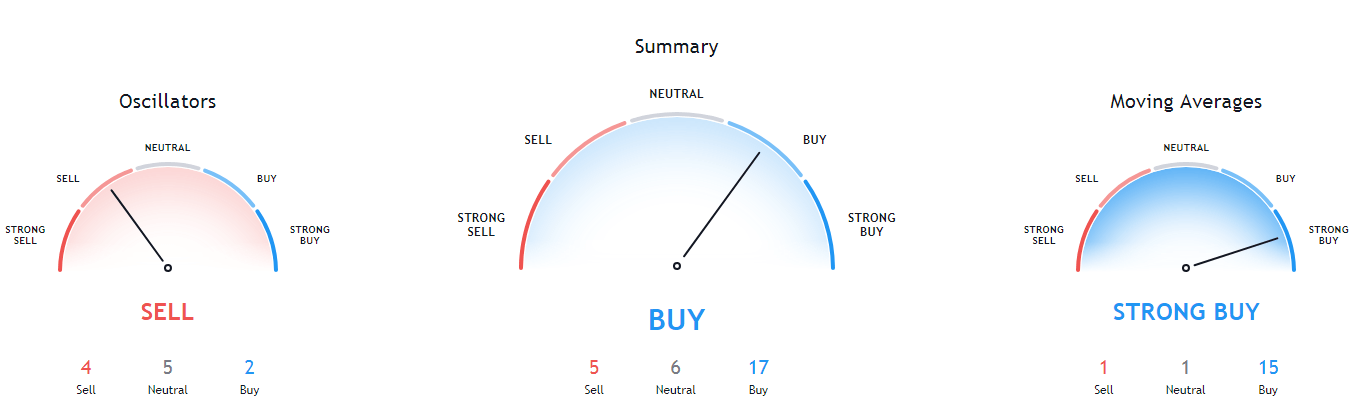
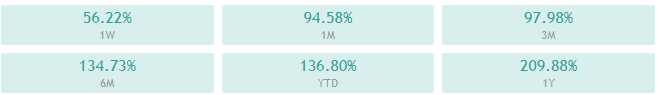
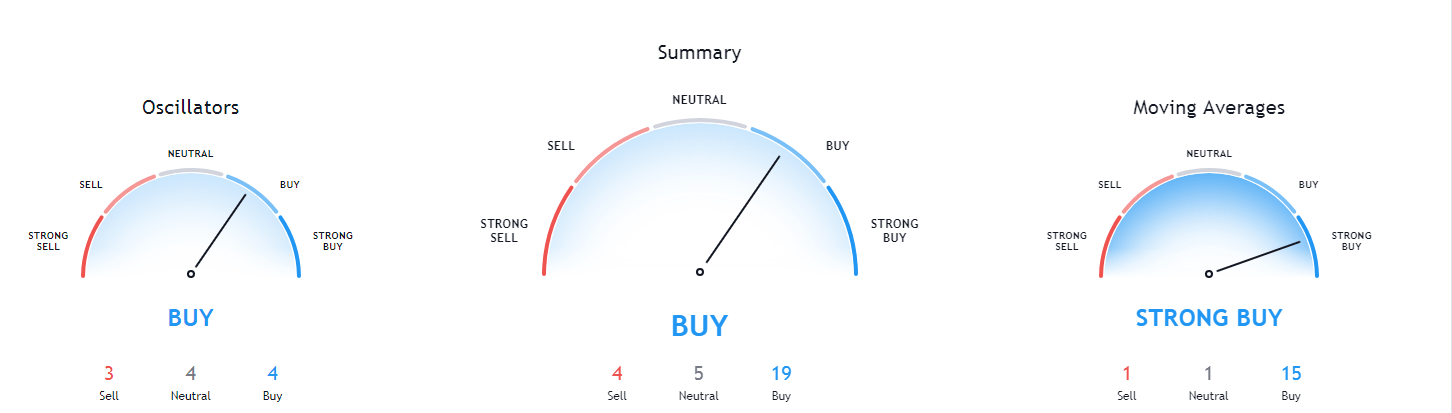
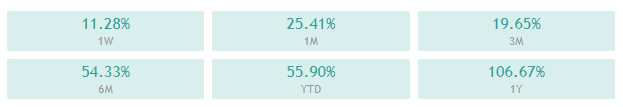
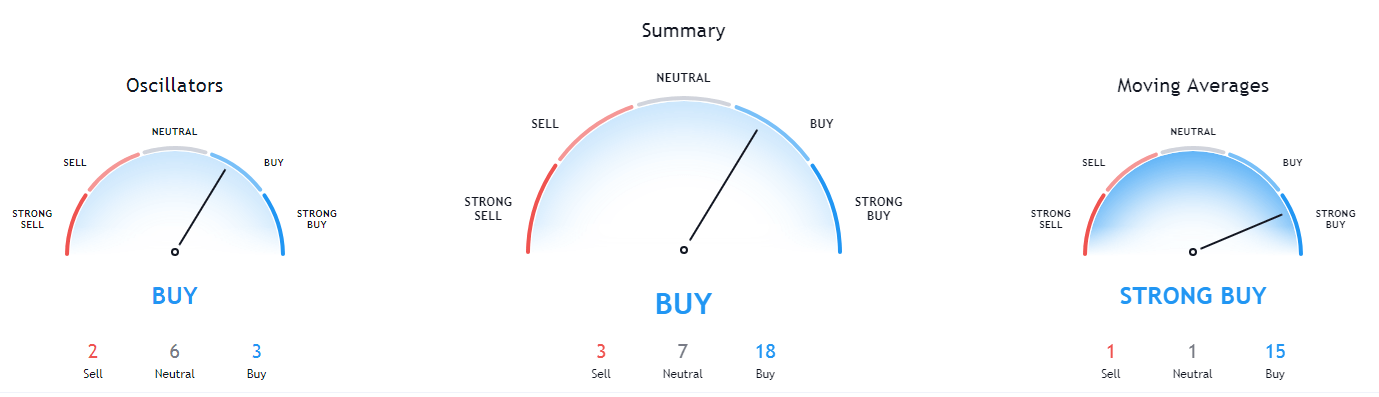
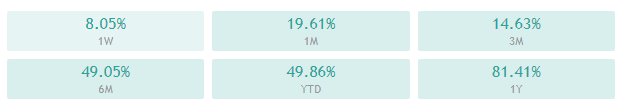
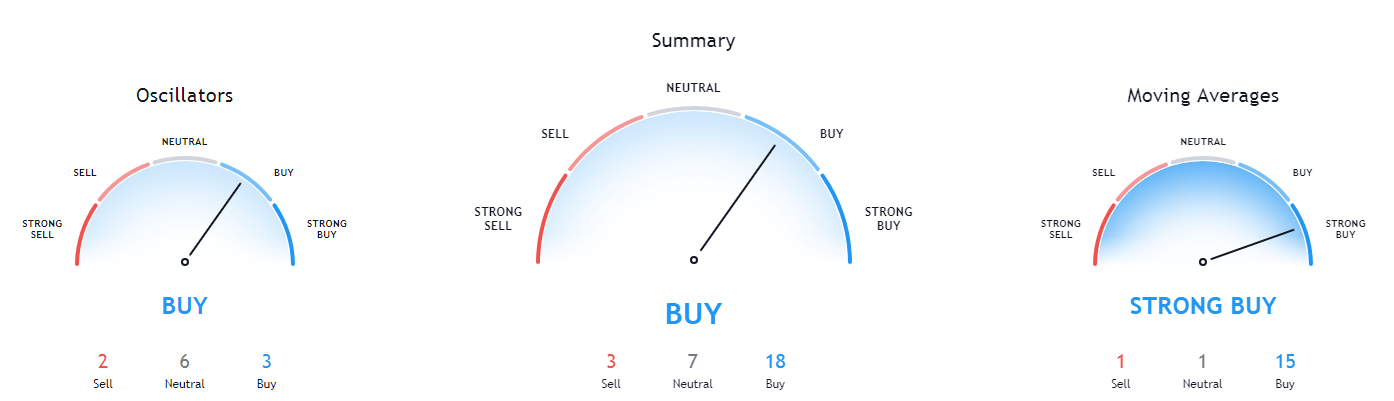
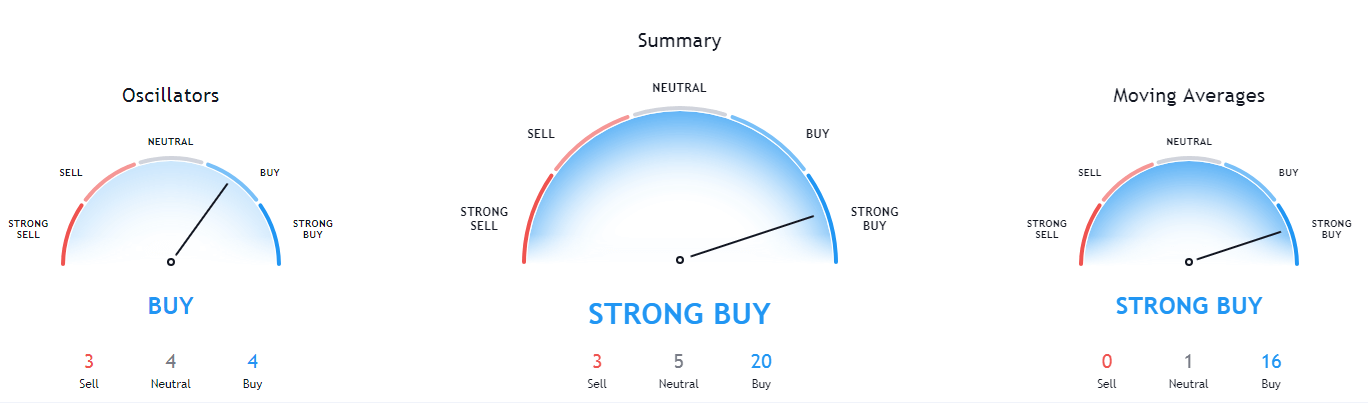
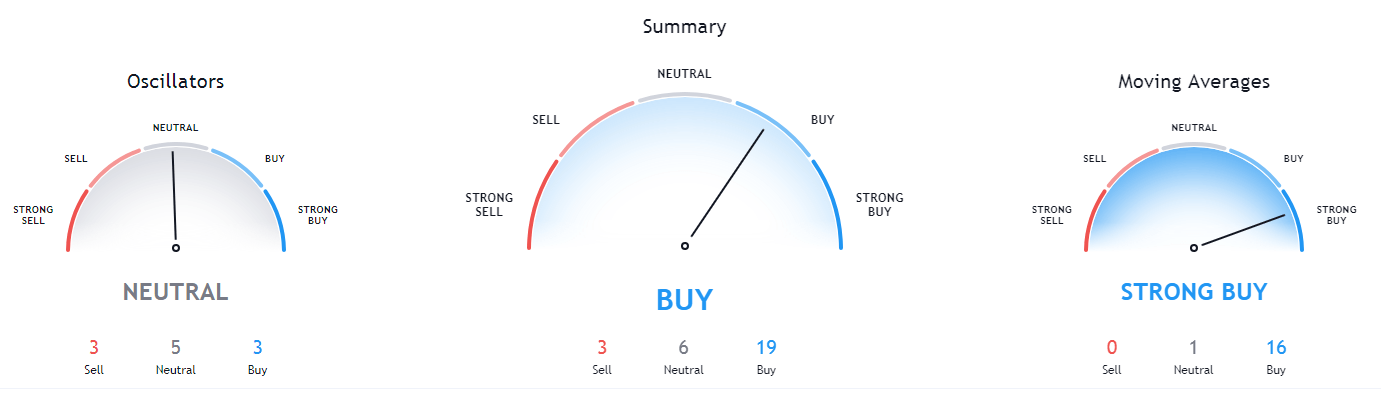
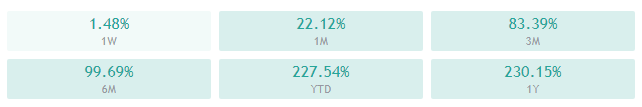
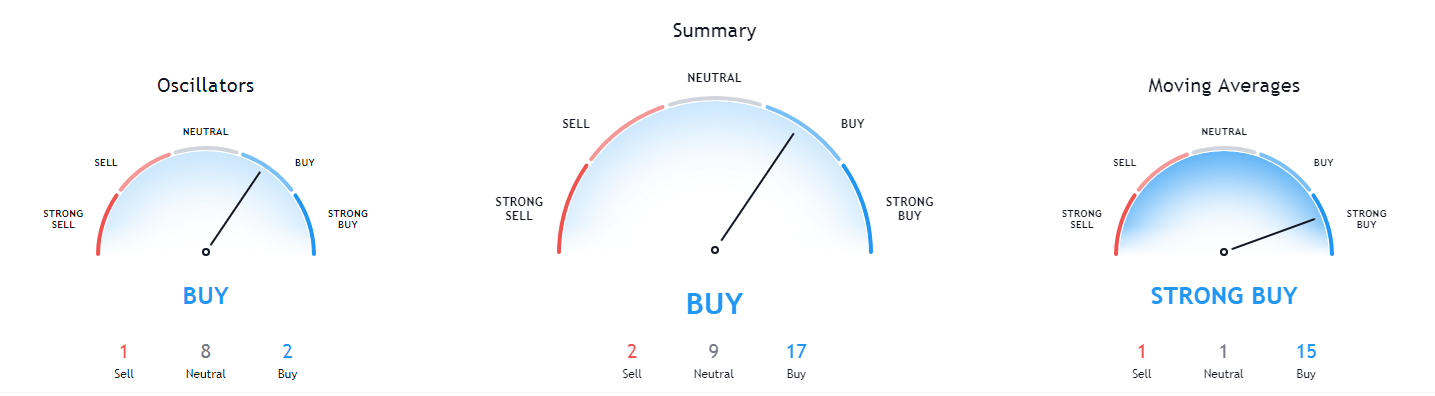
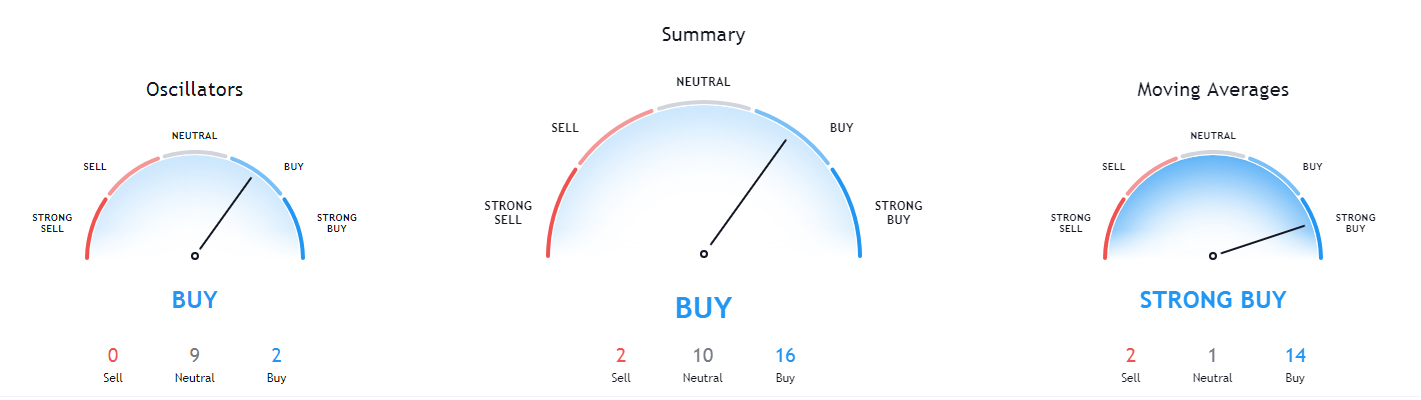
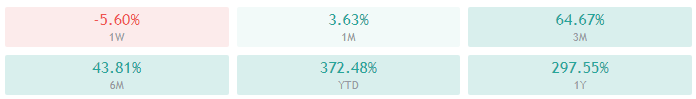
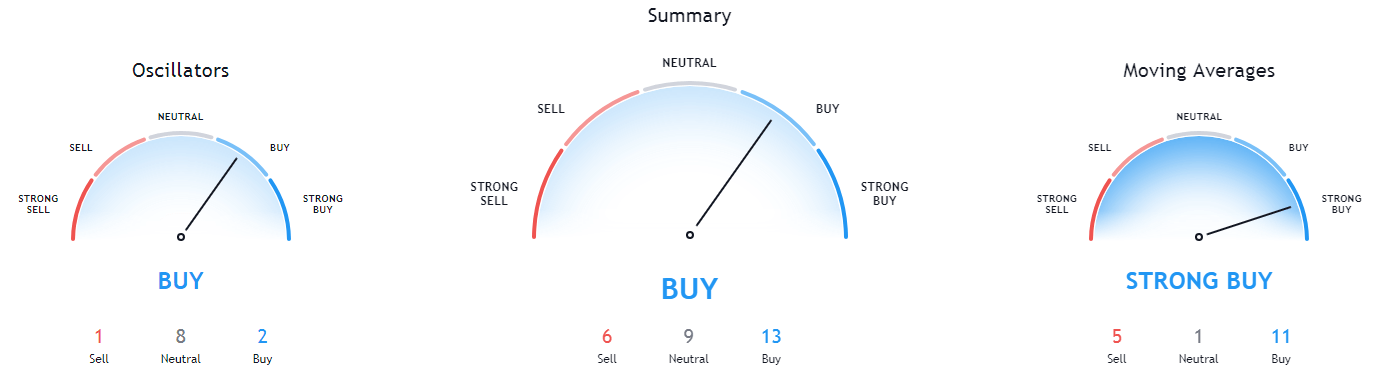
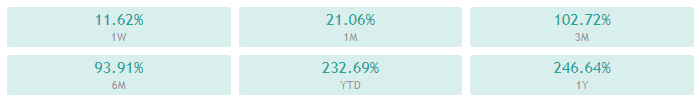
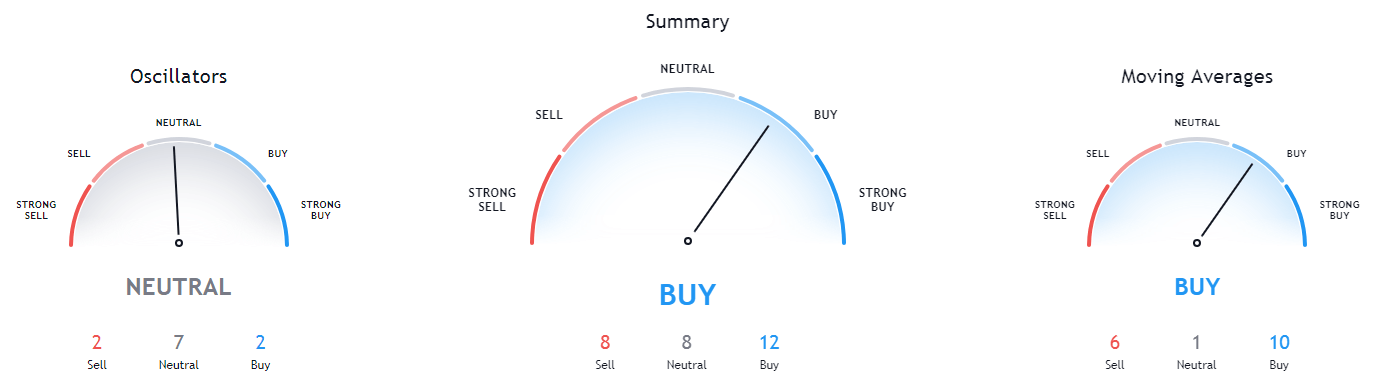
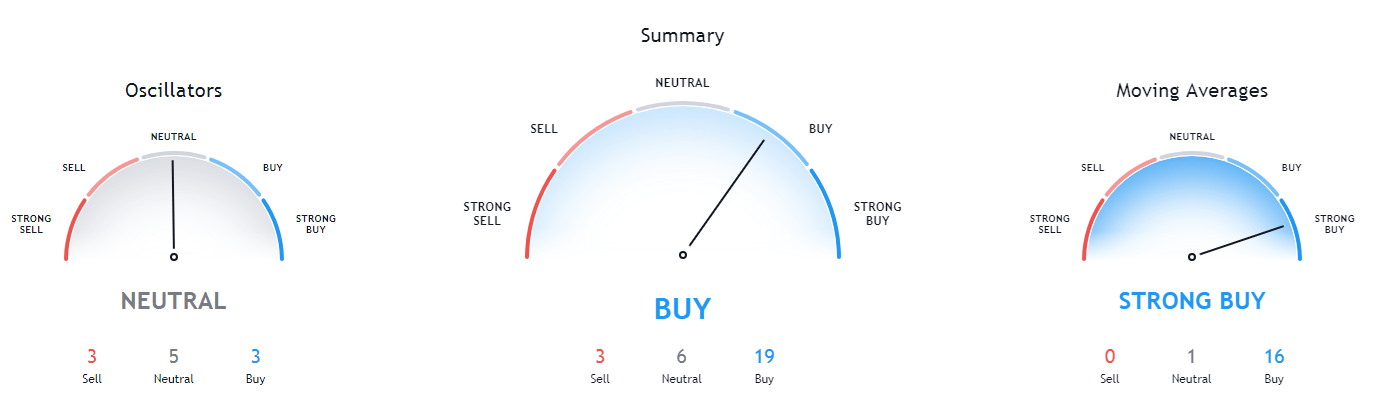
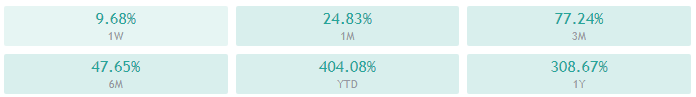
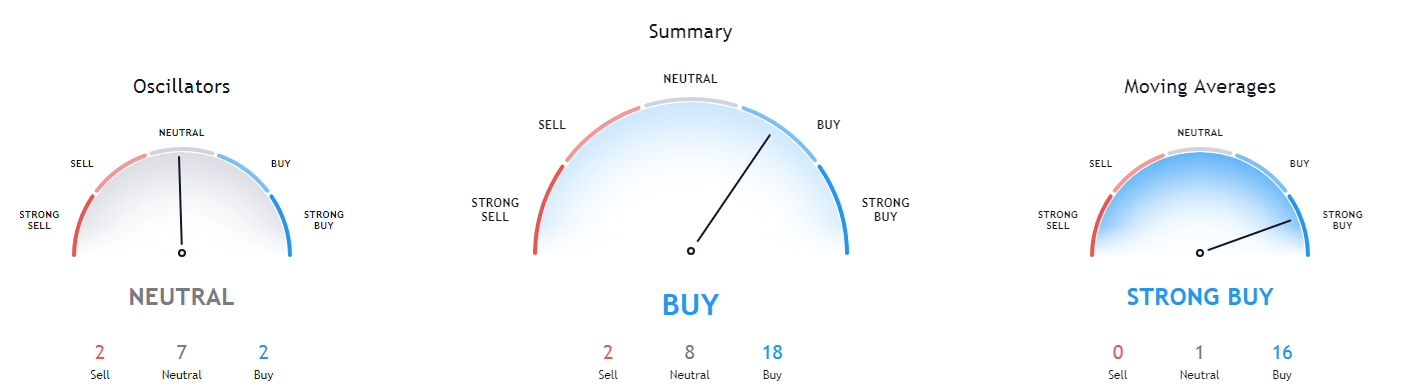
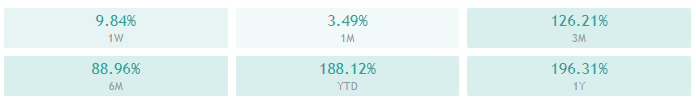
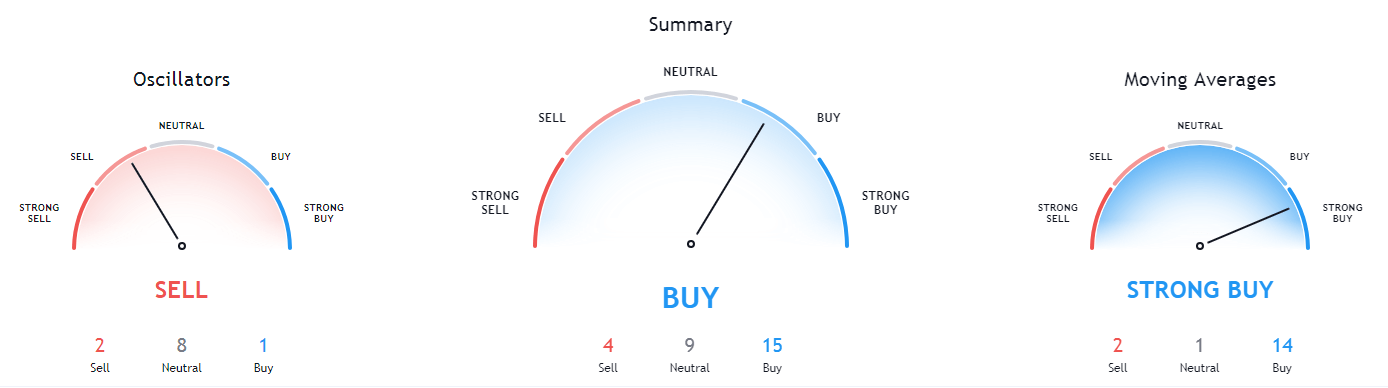
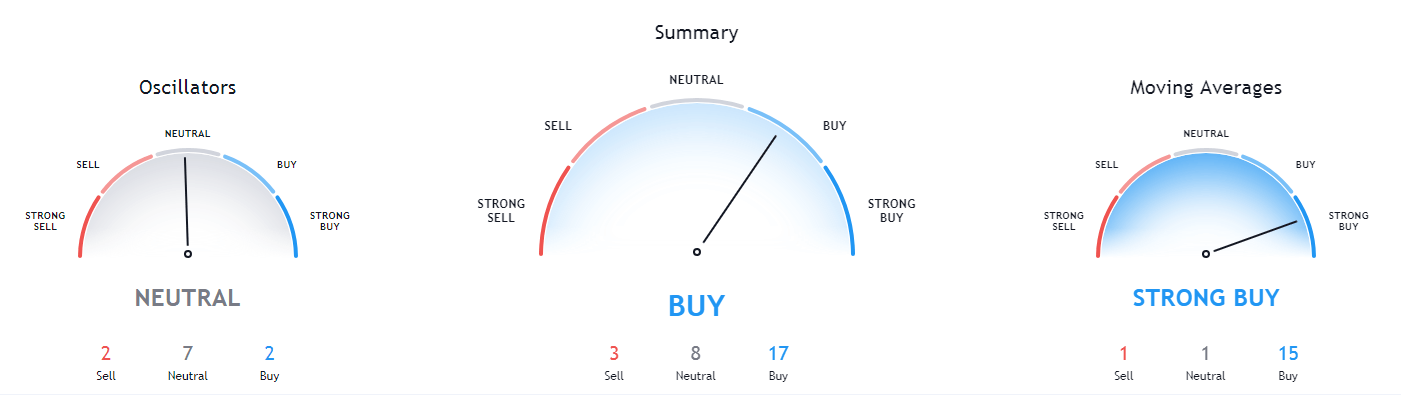
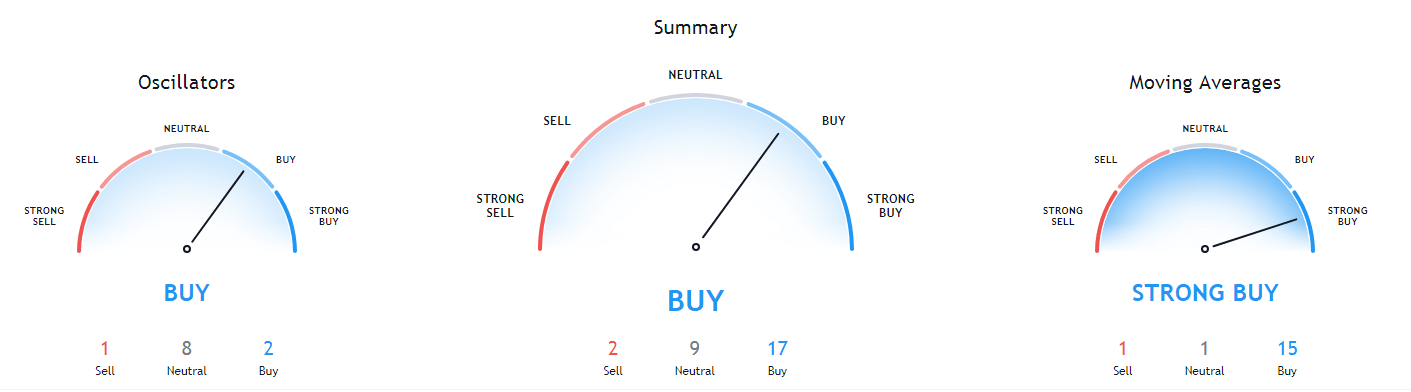
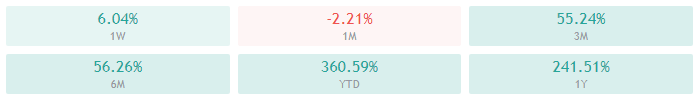
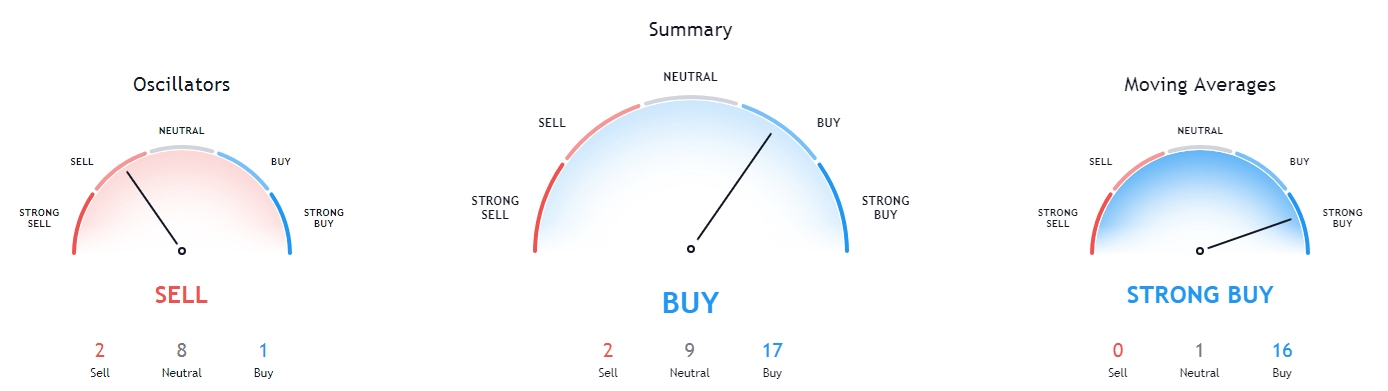
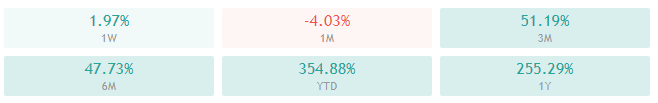
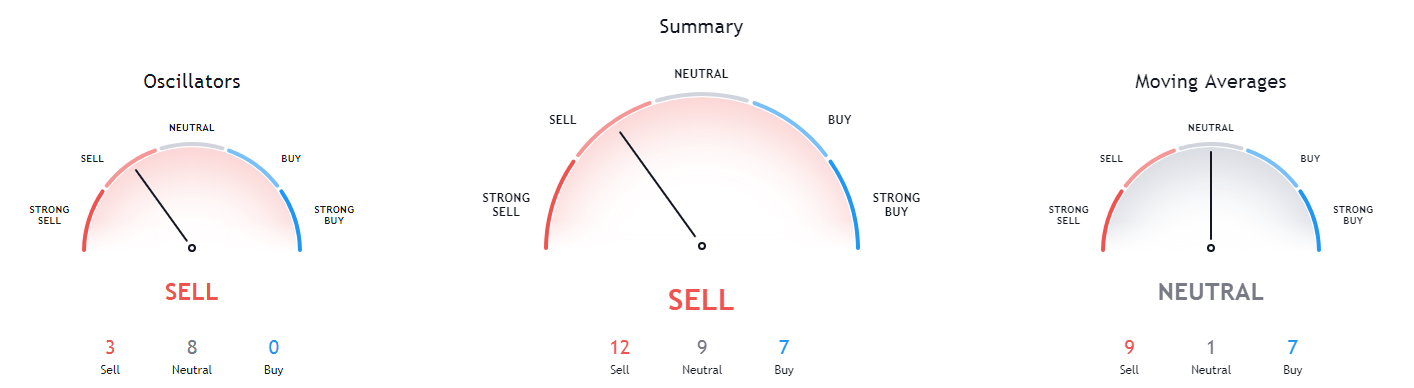
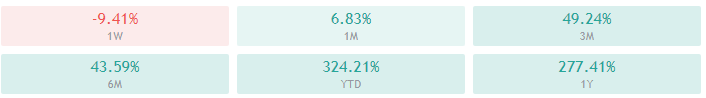
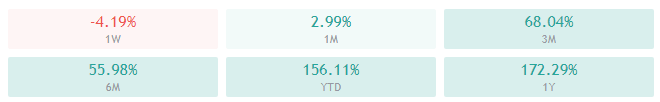
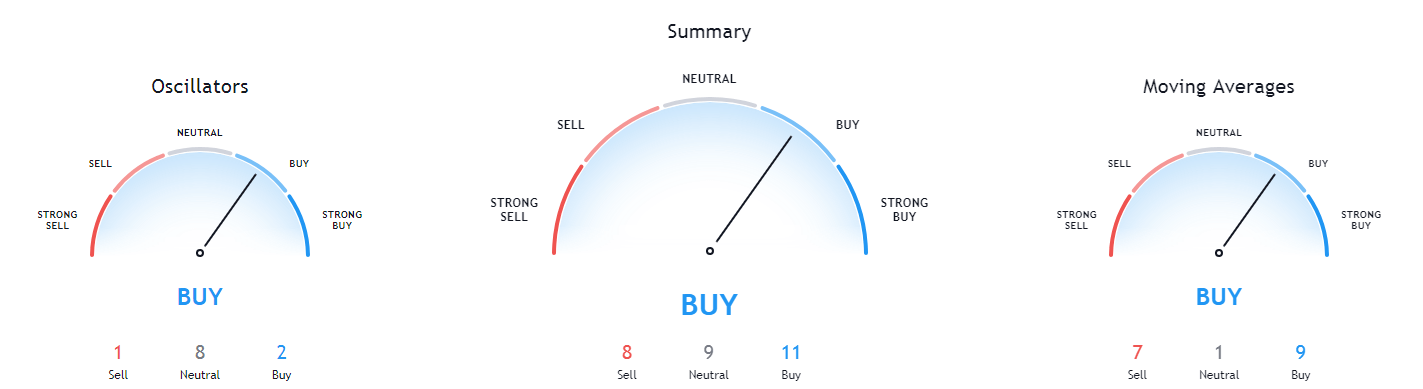
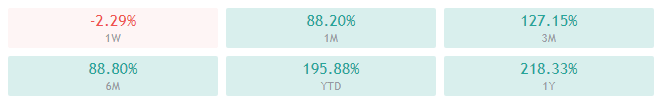
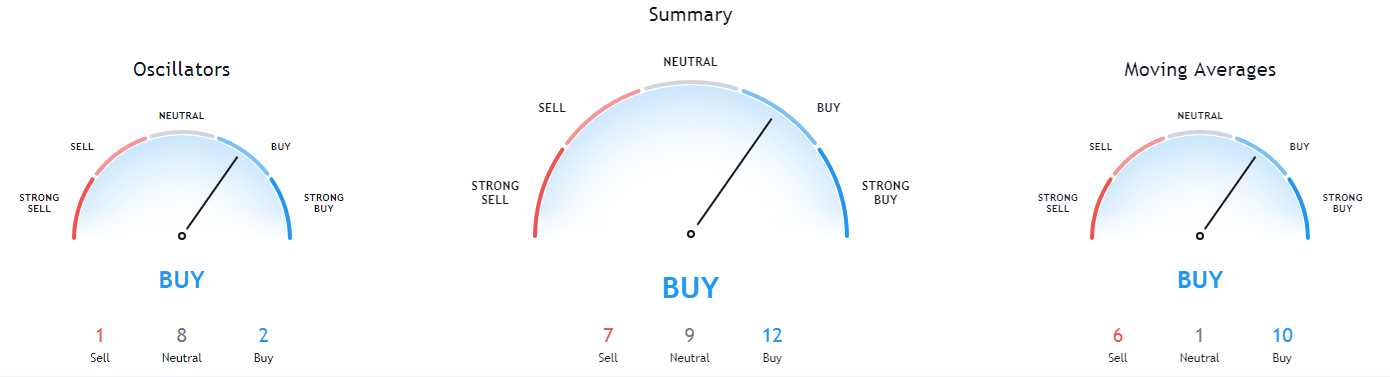
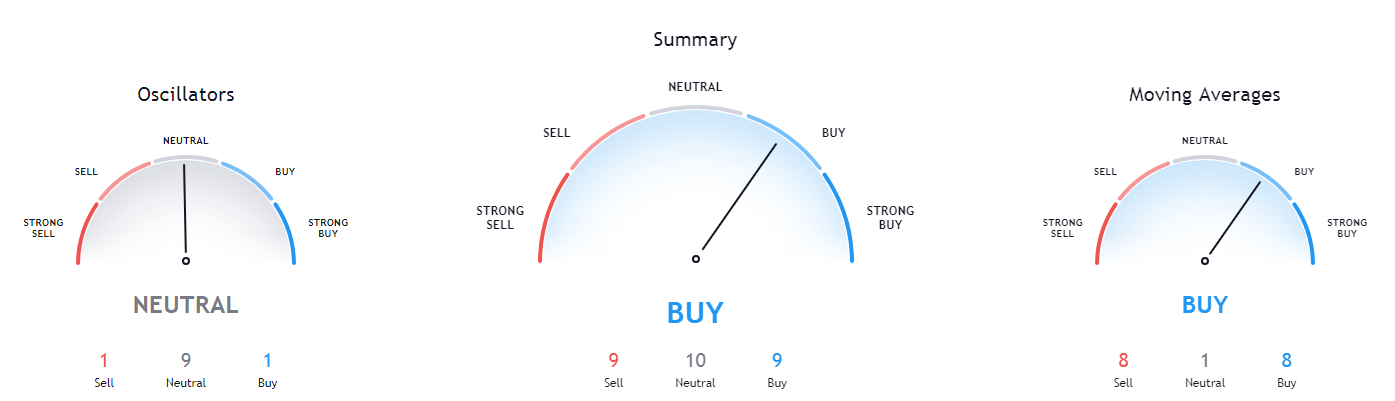
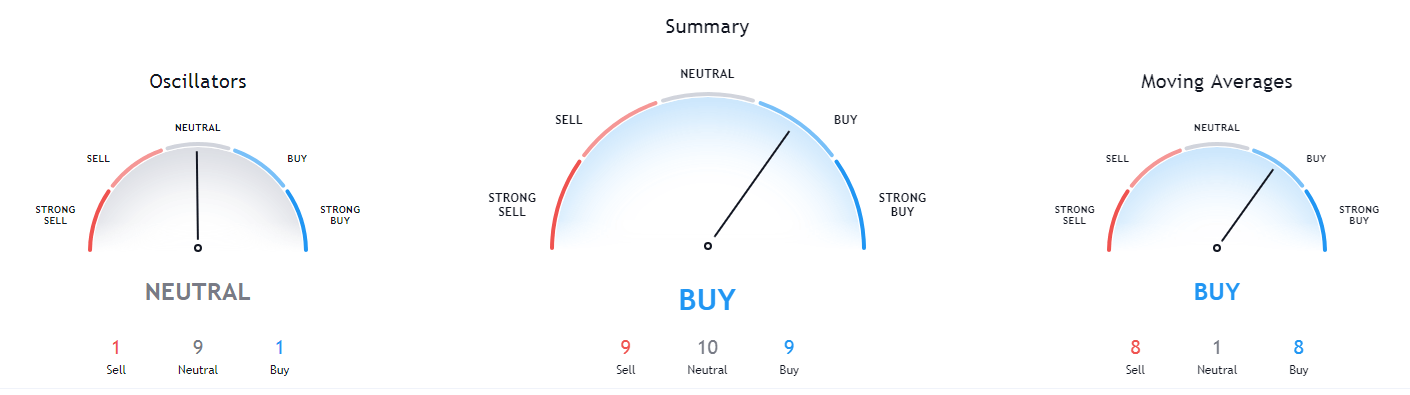
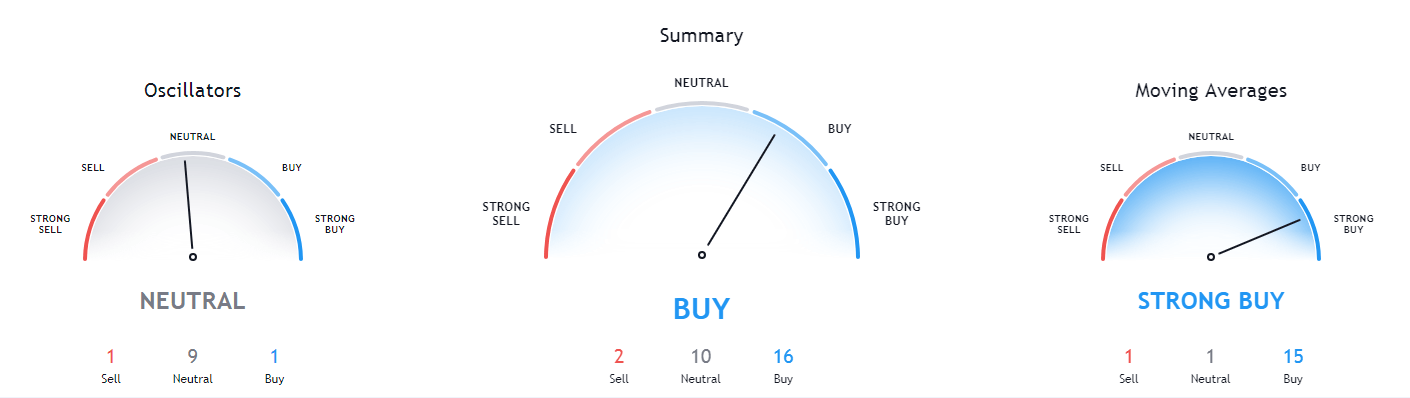
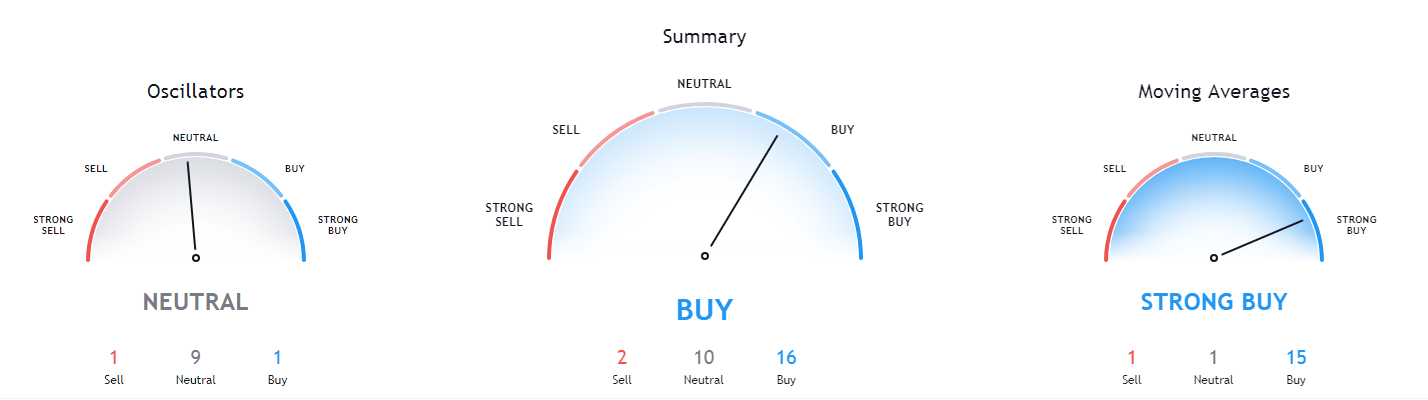
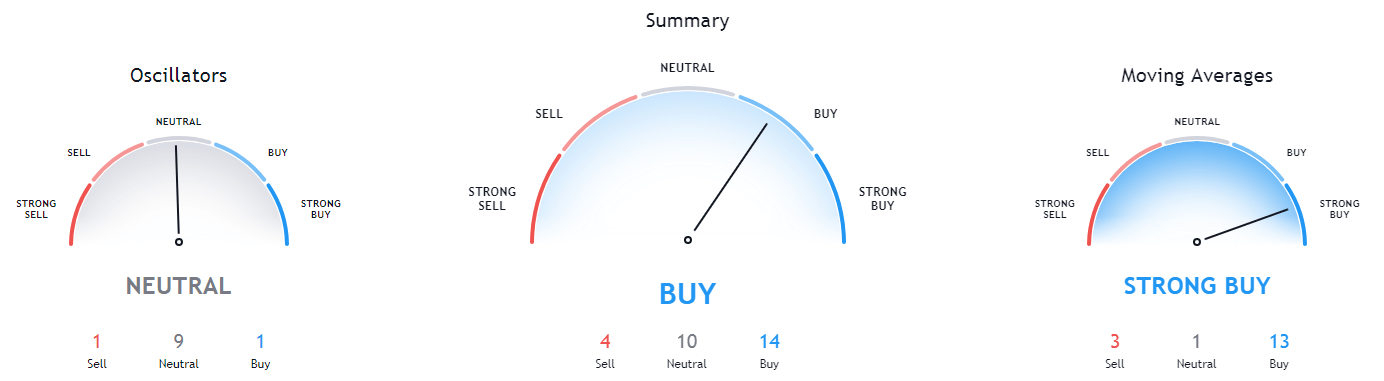
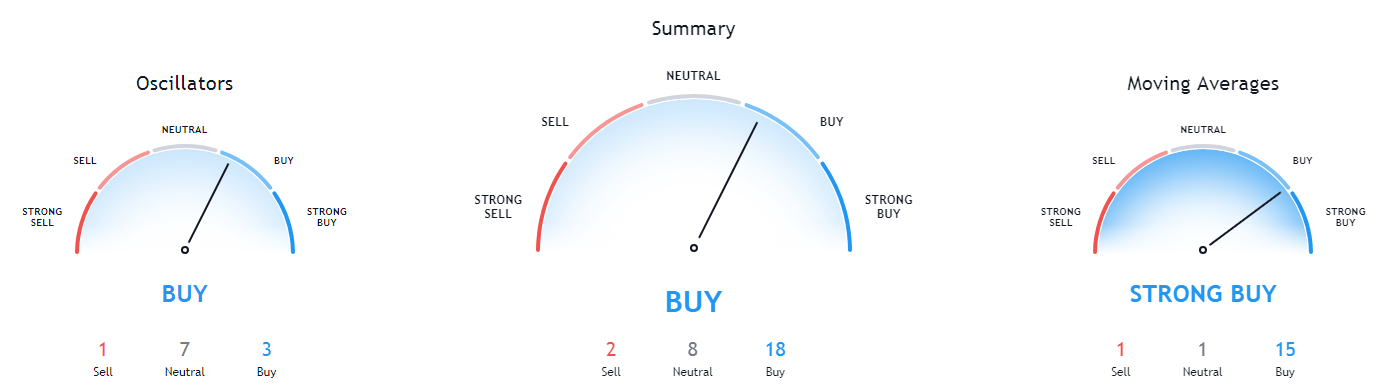
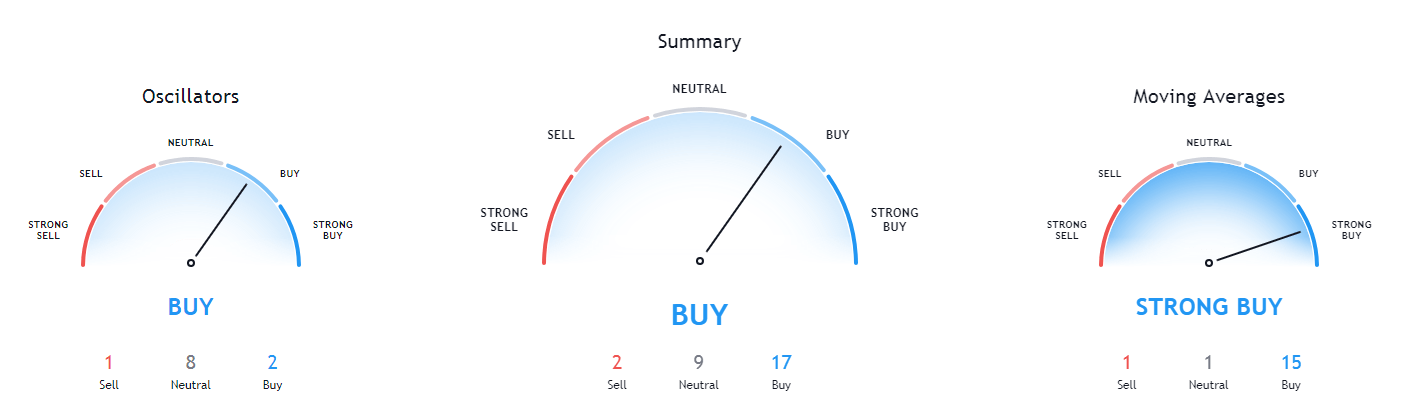
While Bitcoin’s daily and weekly technicals are slightly tilted towards the bull side, its 4-hour and monthly technicals show some hints of neutrality alongside the bullishness.

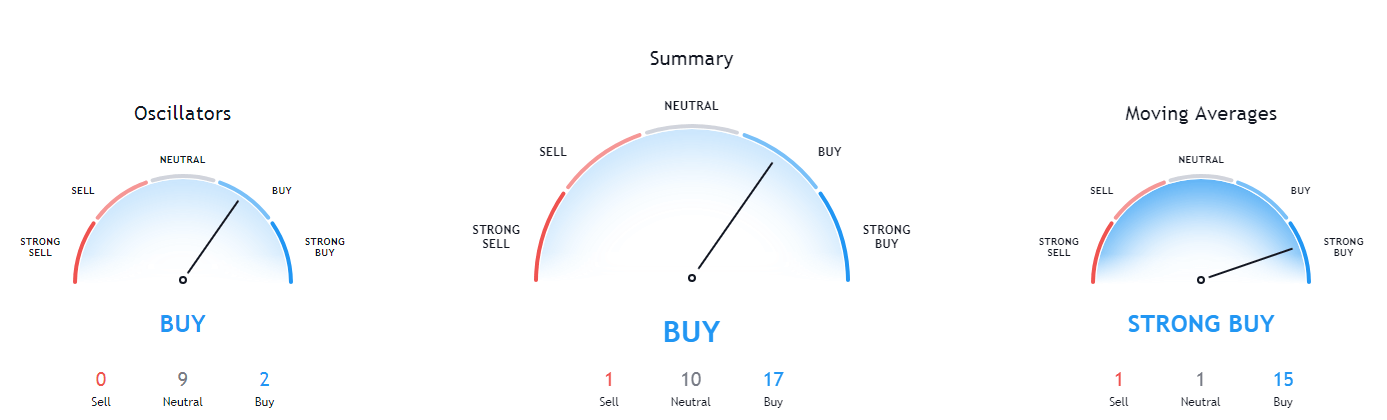
BTC/USD 1-day Technicals
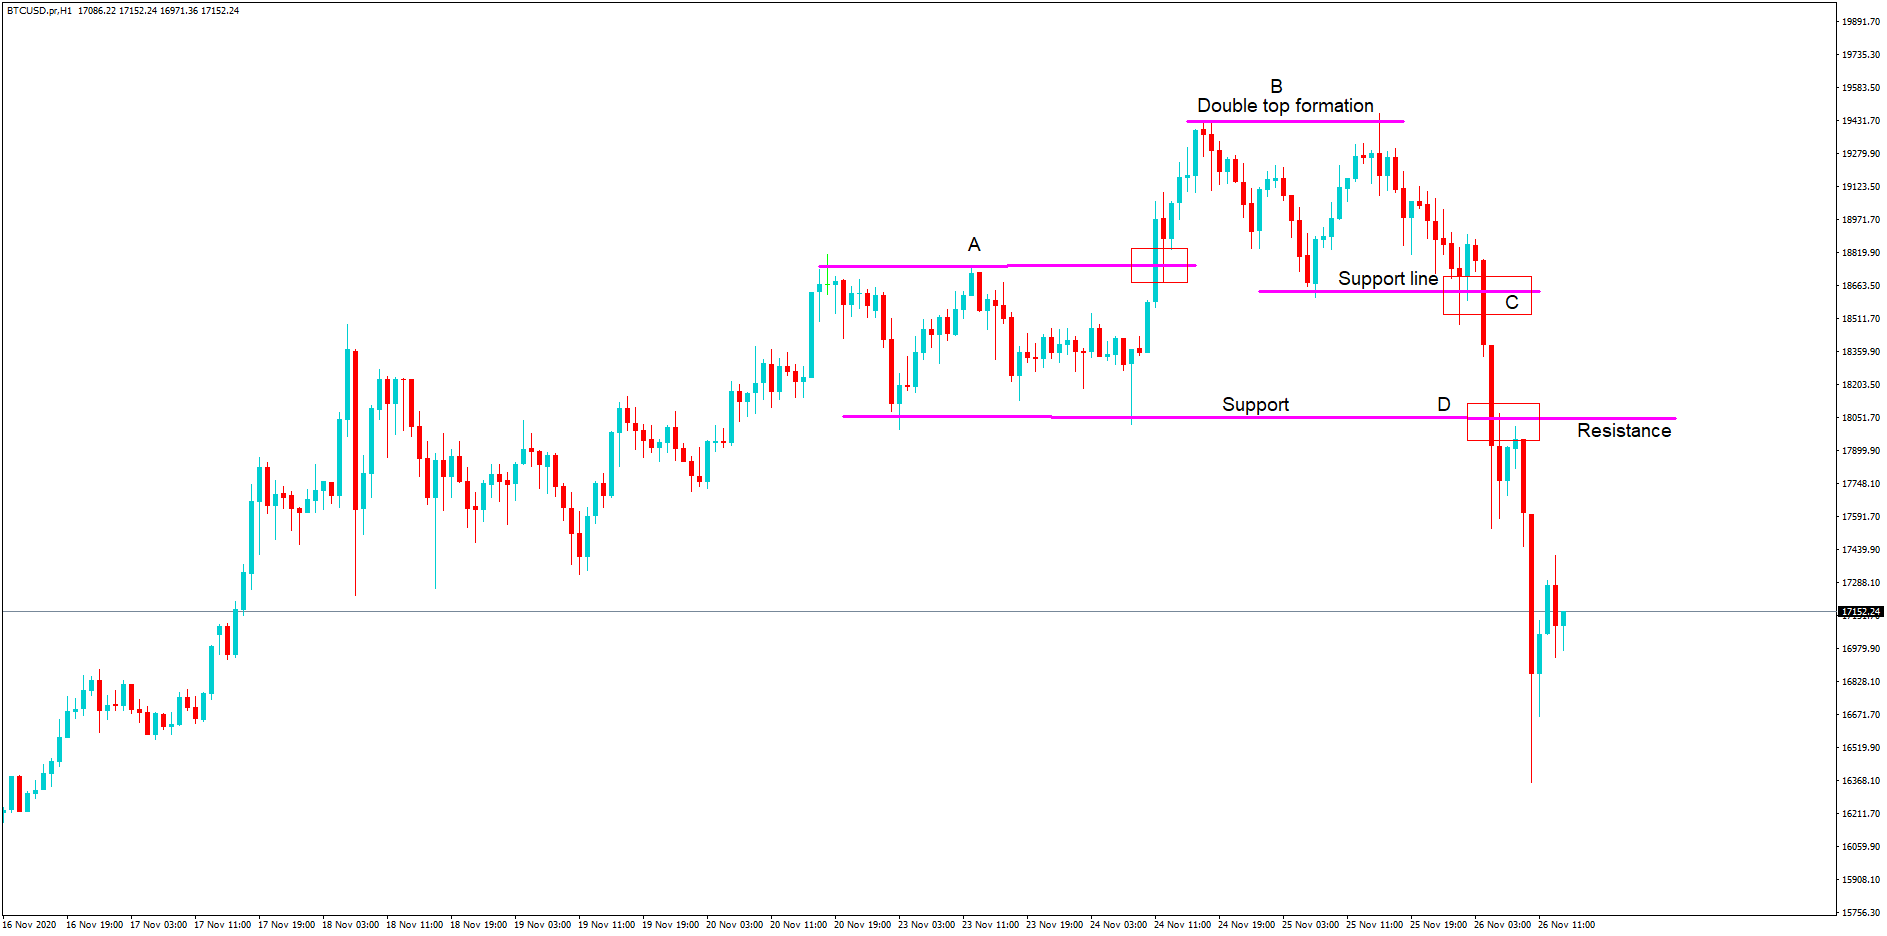
Technical factors (4-hour Chart):
- Price is above its 50-period EMA and at its 21-period EMA
- Price at its middle Bollinger band
- RSI is neutral (53.57)
- Volume is slightly above average
Key levels to the upside Key levels to the downside
1: $24,315 1: $22,054
2: $24,700 2: $21,350
3: $25,511 3: $19,918
Ethereum
Unlike Bitcoin, Ethereum got affected by XRP’s downturn, which pulled it back over 5% on the day. The second-largest cryptocurrency fell below its $600 support level, and caused a quick panic-sell which brought its price as low as $550 (though just for a moment). Ether is now fighting to stay above the $581 level, which it will most likely succeed.
Many analysts are calling for a double bottom and are expecting an upswing from Ethereum. Traders should pay close attention to Ether’s volume and (possibly) order books.
ETH/USD 4-hour Chart
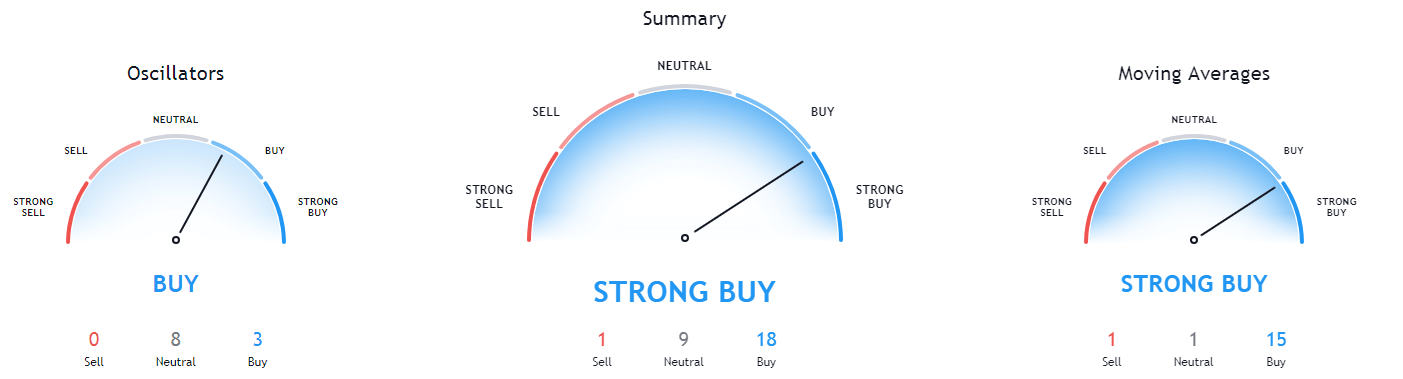
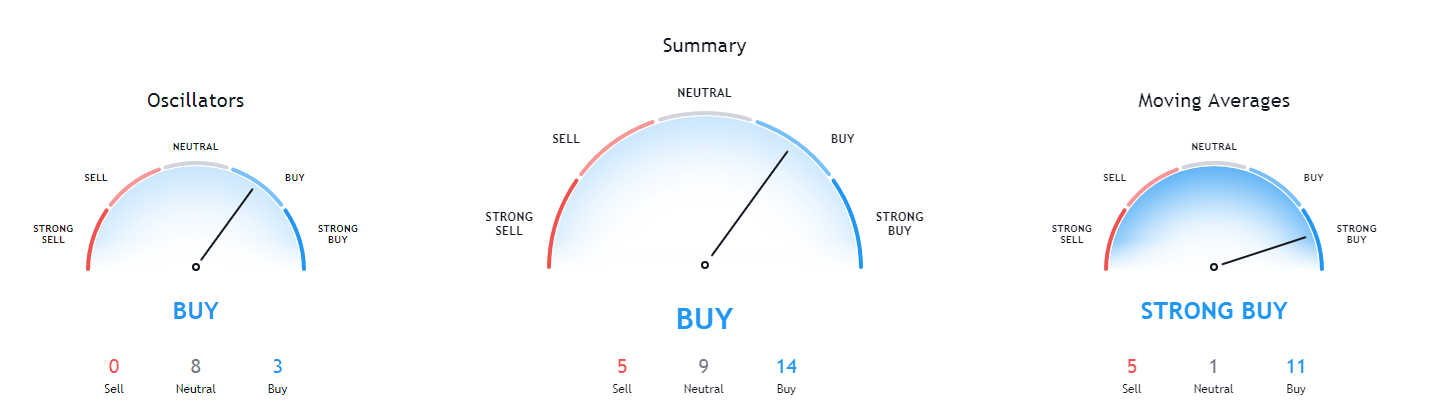
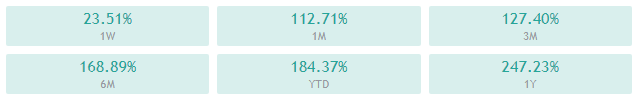
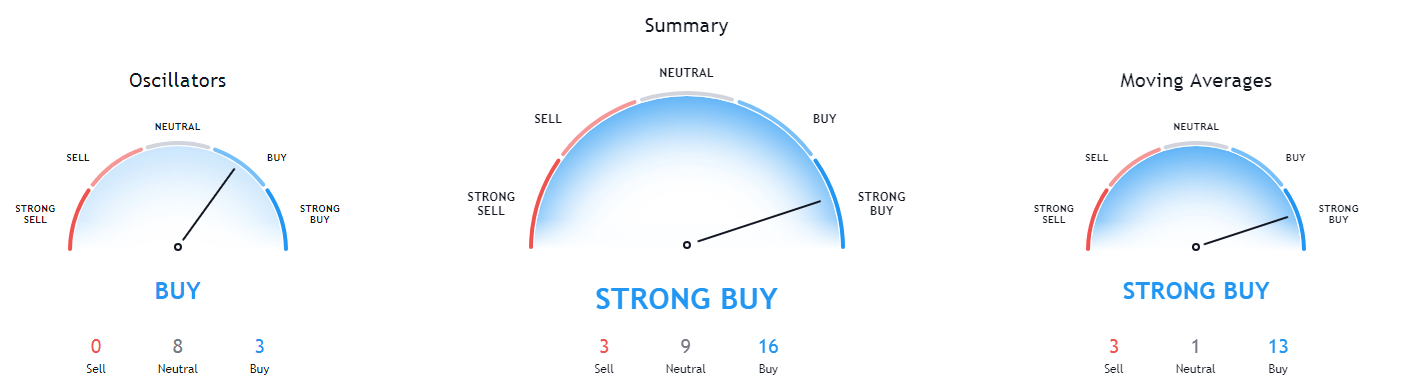
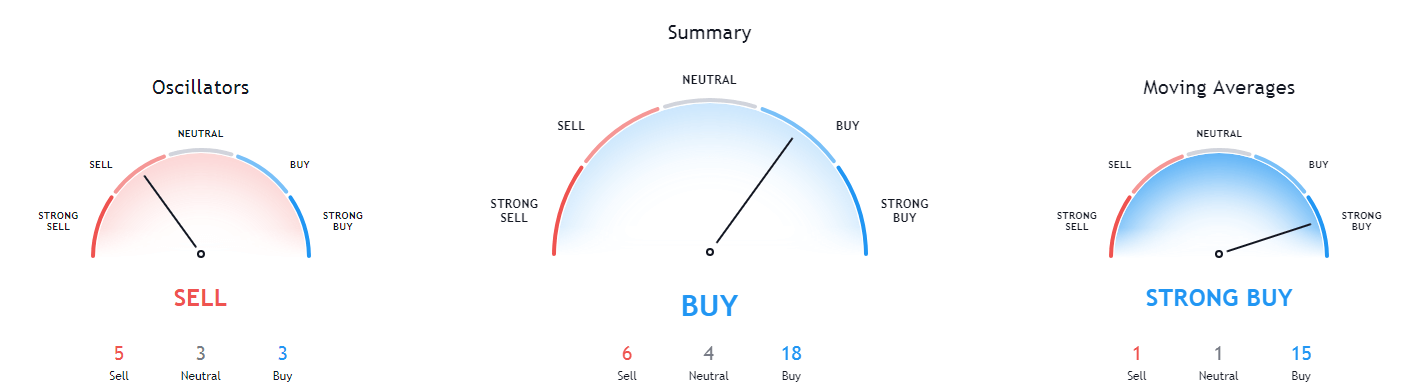
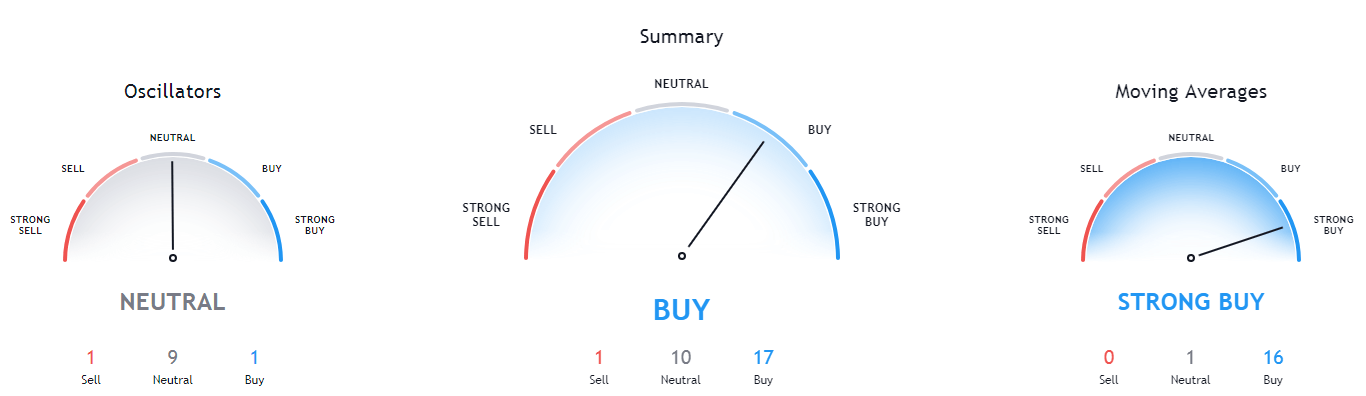
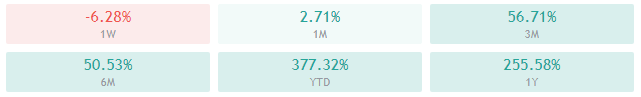
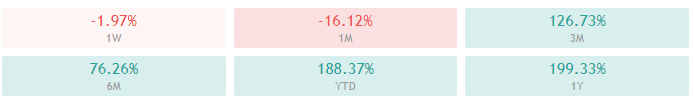
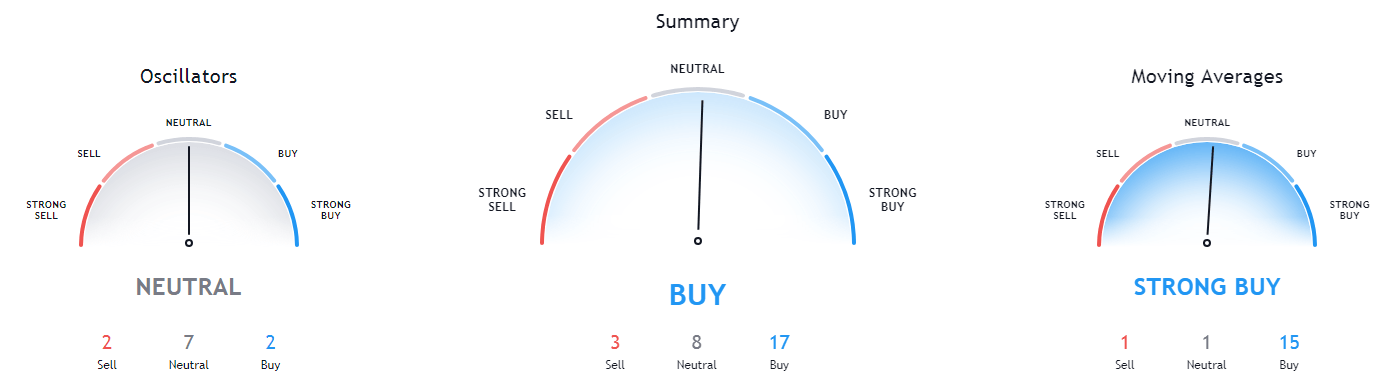
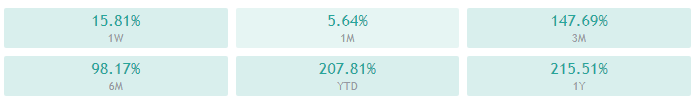
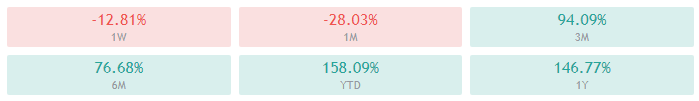
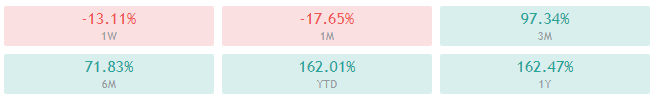
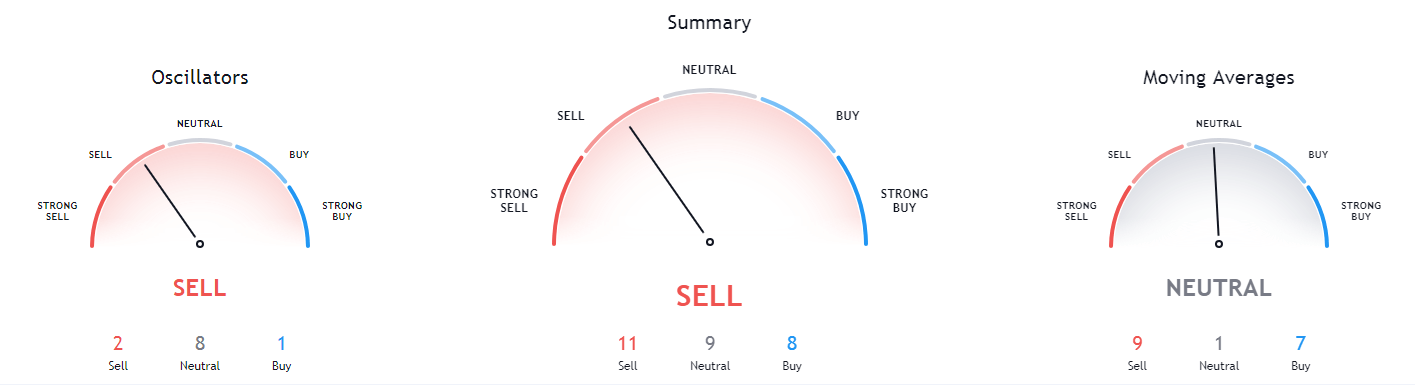
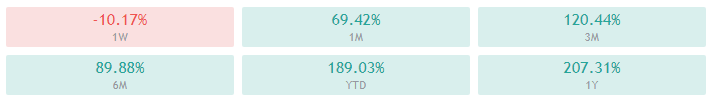
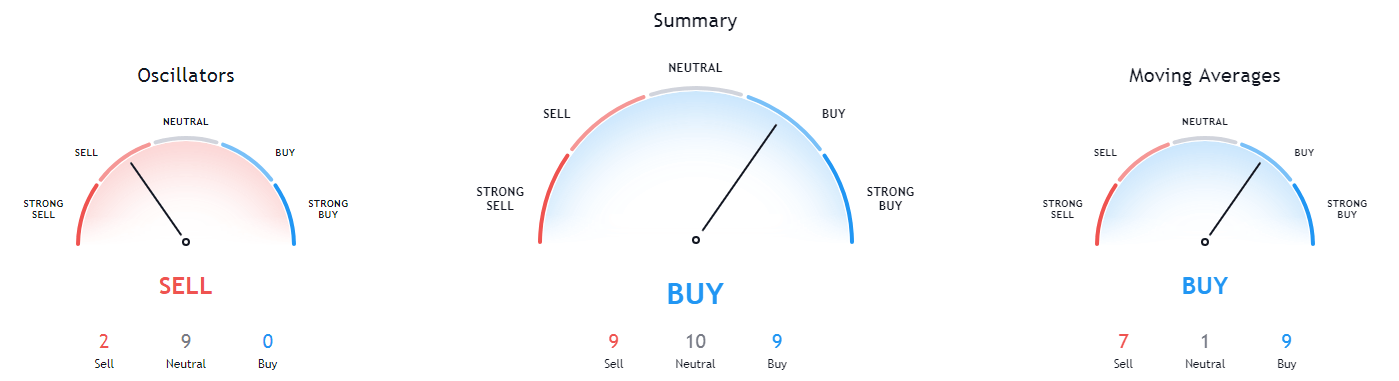
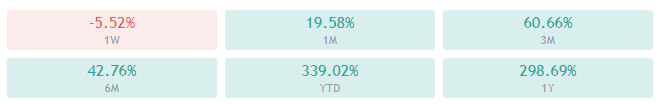
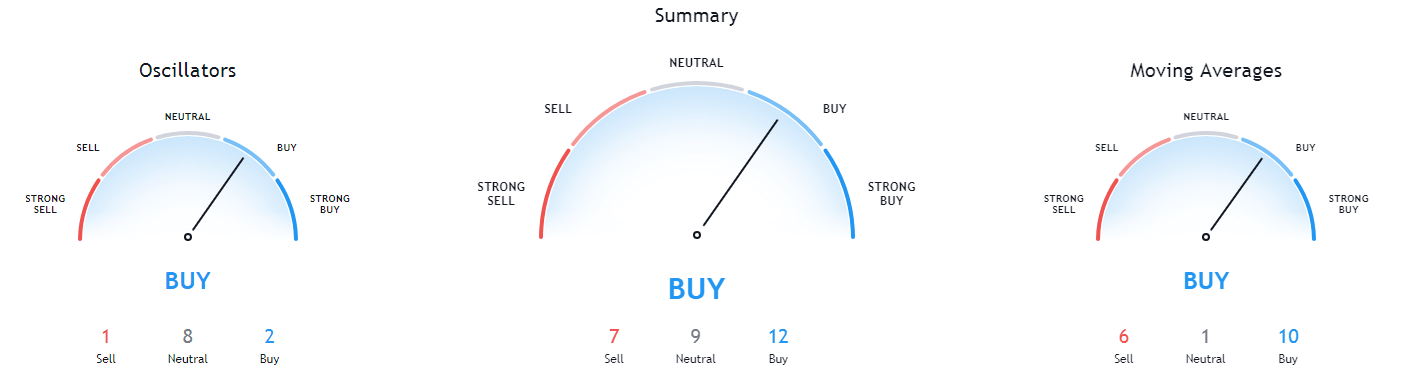
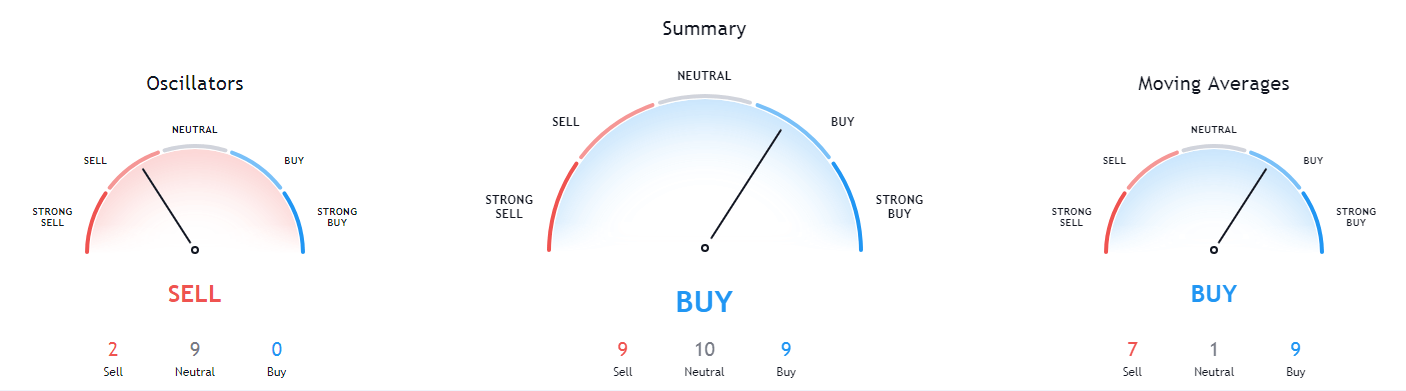
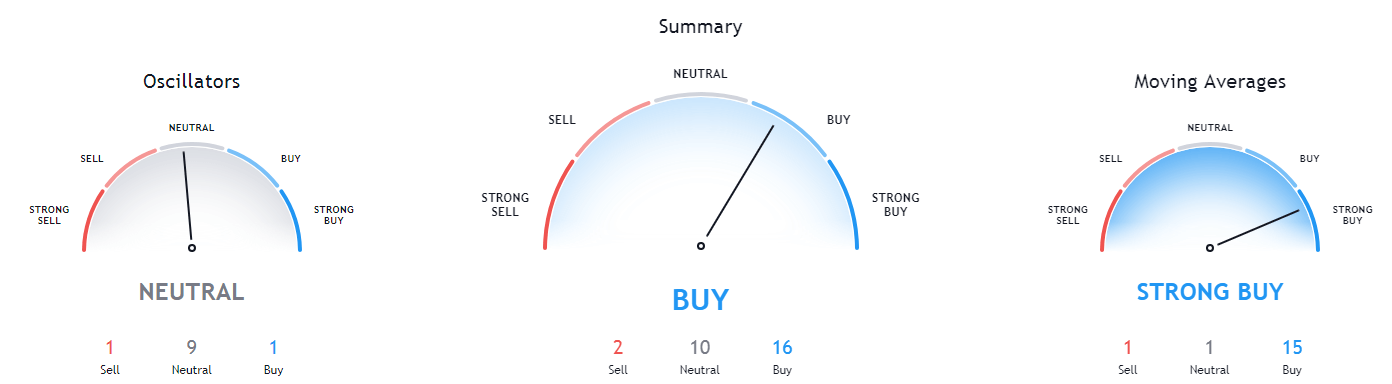
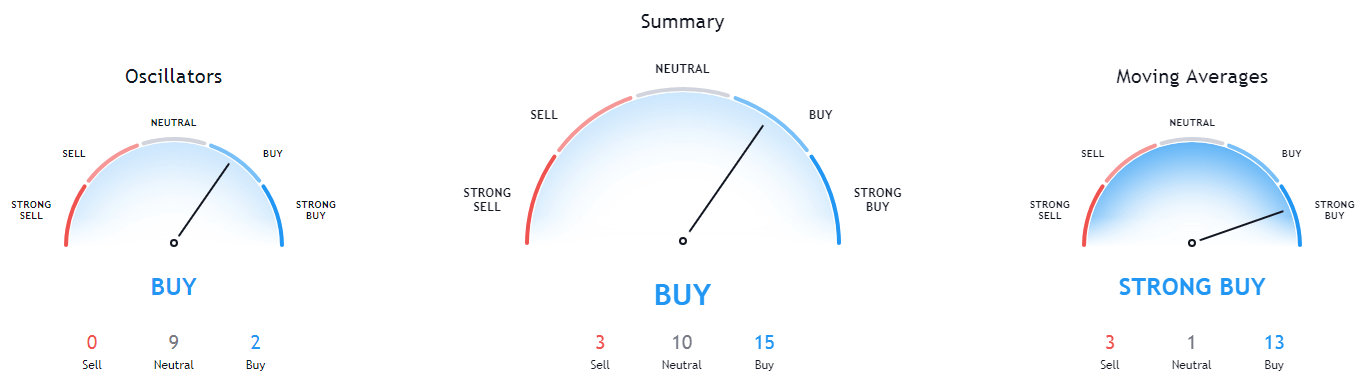
Ethereum’s weekly and monthly technicals are completely bullish, while its 4-hour and daily overview are mainly tilted towards the sell-side, but show some signs of uncertainty.

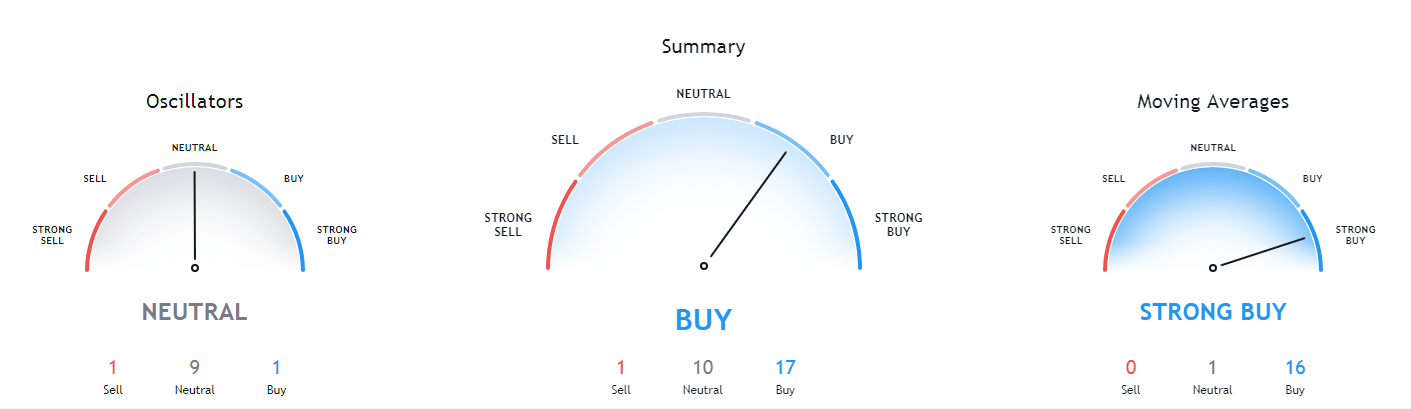
ETH/USD 1-day Technicals
Technical Factors (4-hour Chart):
- Price is below both its 50-period and its 21-period EMA
- Price is close to its bottom Bollinger band
- RSI is neutral (37.44)
- Volume is on slightly above-average levels
Key levels to the upside Key levels to the downside
1: $600 1: $581
2: $632 2: $564
3: $675 3: $545
Ripple
XRP got crushed as more bad news came. The fourth-largest cryptocurrency by market cap got dropped by various exchanges, as well as its positions fully liquidated by major funds such as Bitwise. Its price dipped over 65% in just 5 days. However, XRP seems to have found support in (first) the $0.214 and (later) $0.25 levels.
XRP will most likely try to either hold its price level or push slightly towards the upside. While its further downside potential is not very high (unless more bad news comes out), buying or longing XRP is extremely risky.
XRP/USD 4-hour Chart
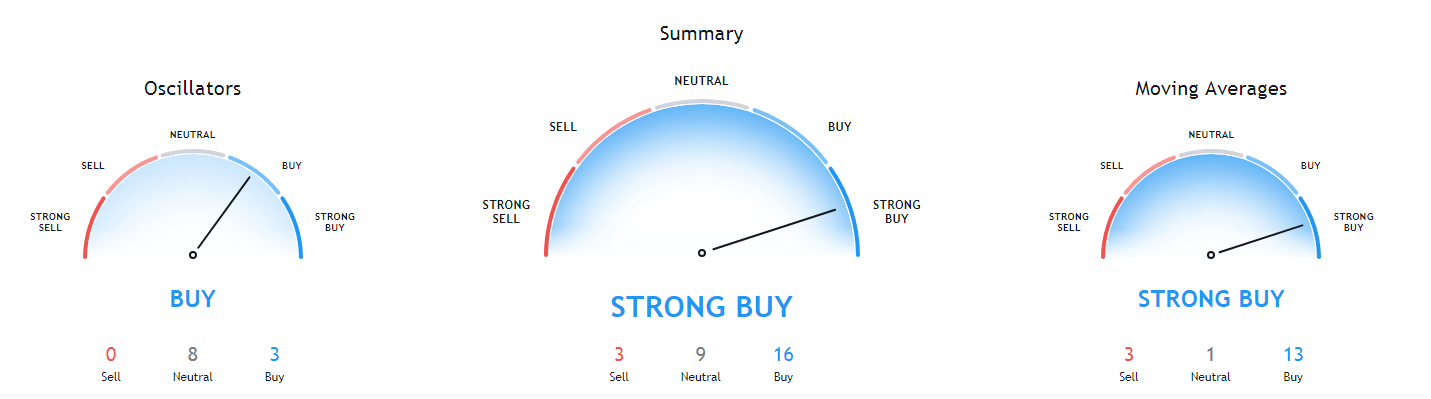
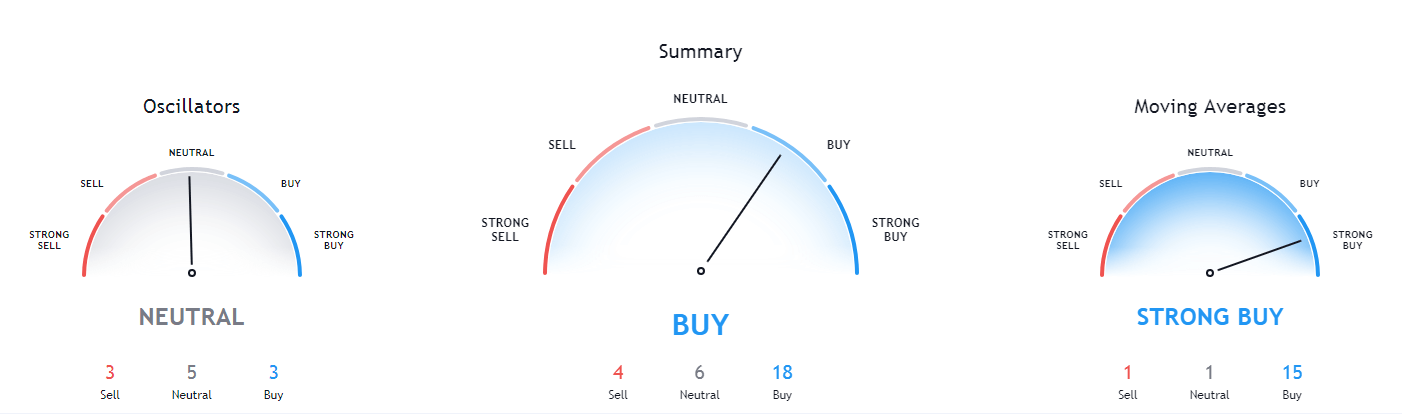
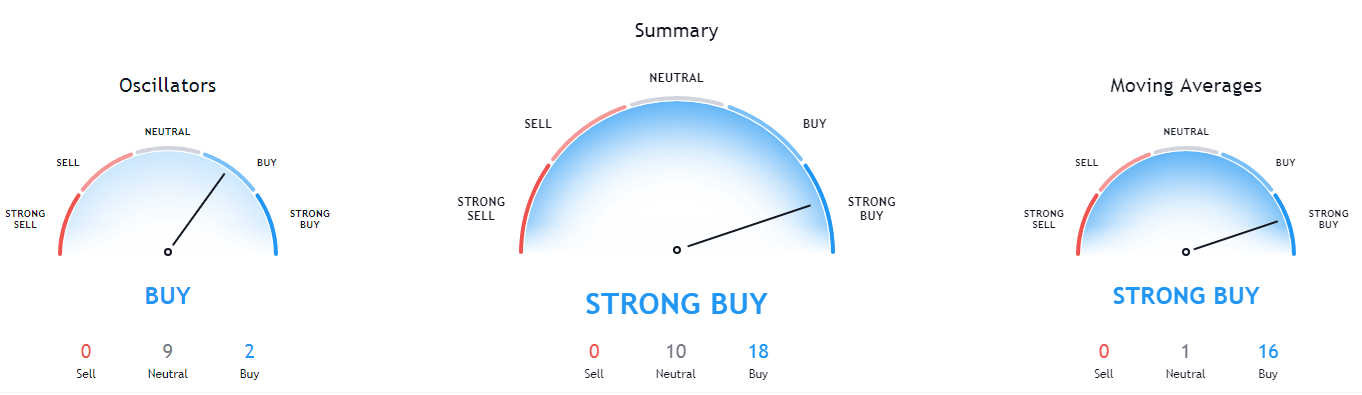
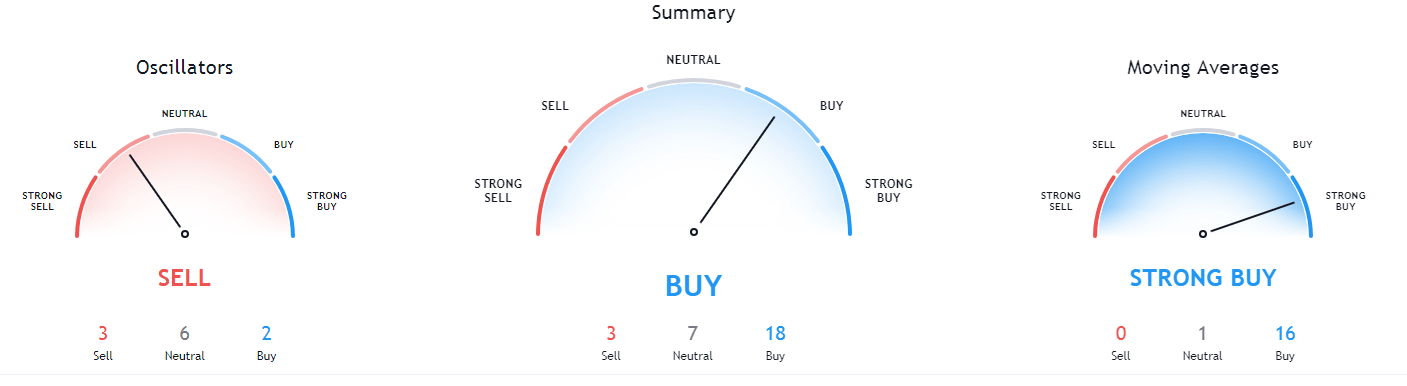
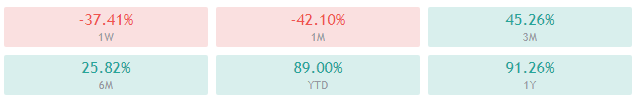
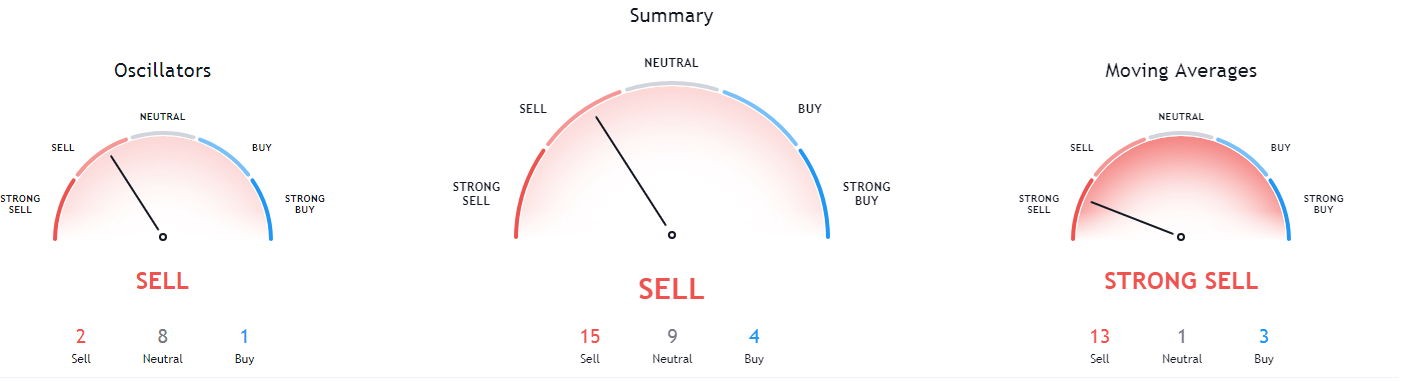
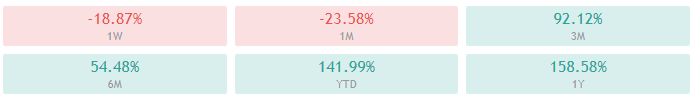
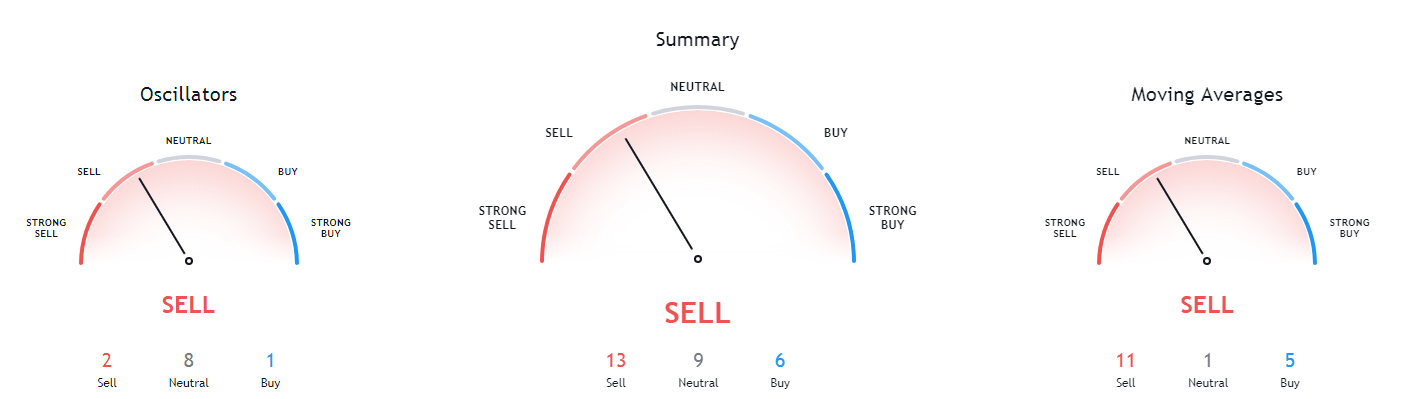
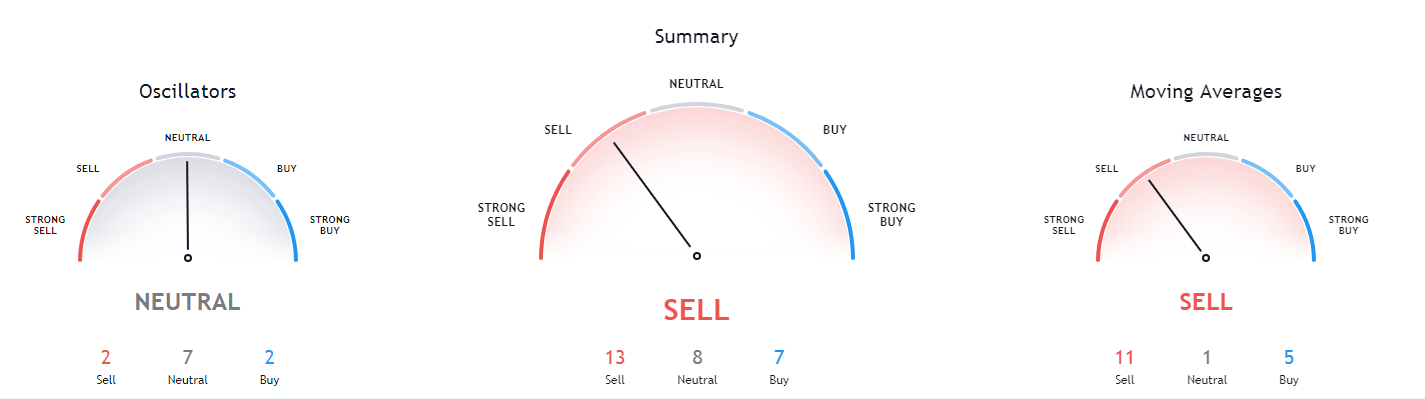
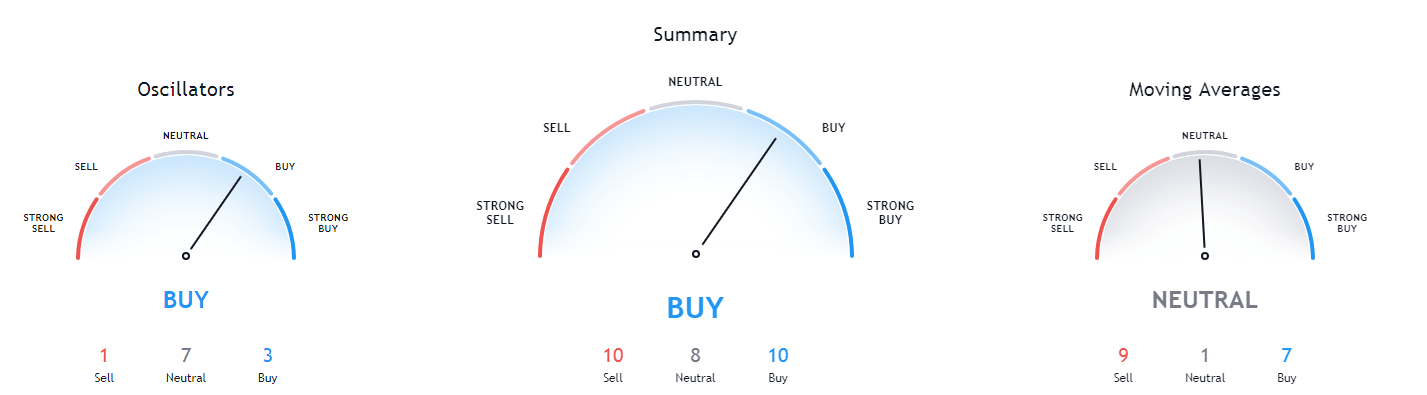
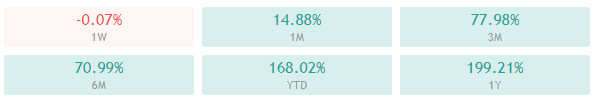
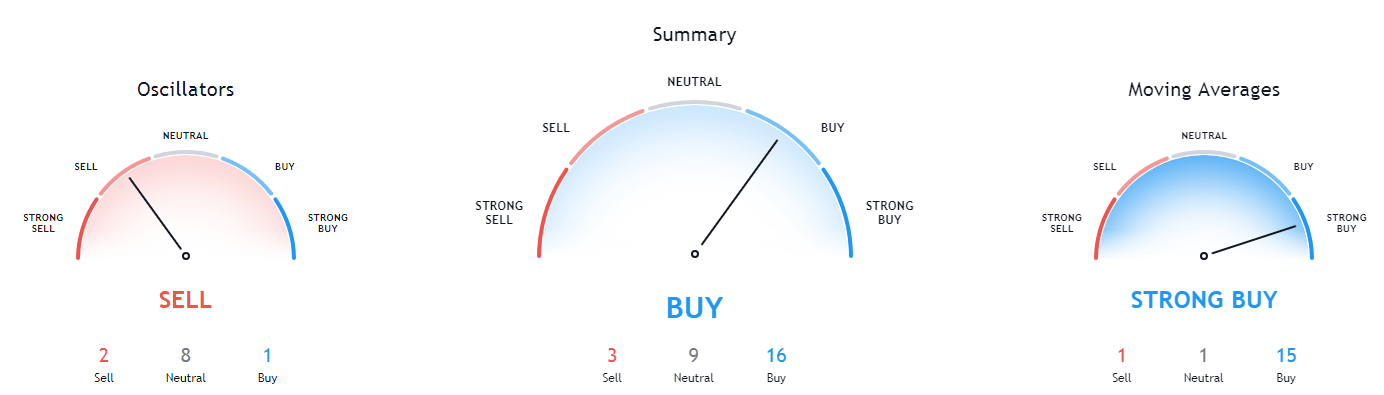
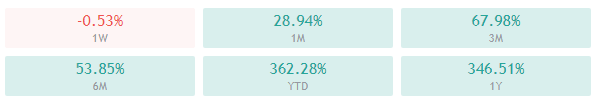
XRP’s technicals on all time-frames are completely tilted towards the sell-side.
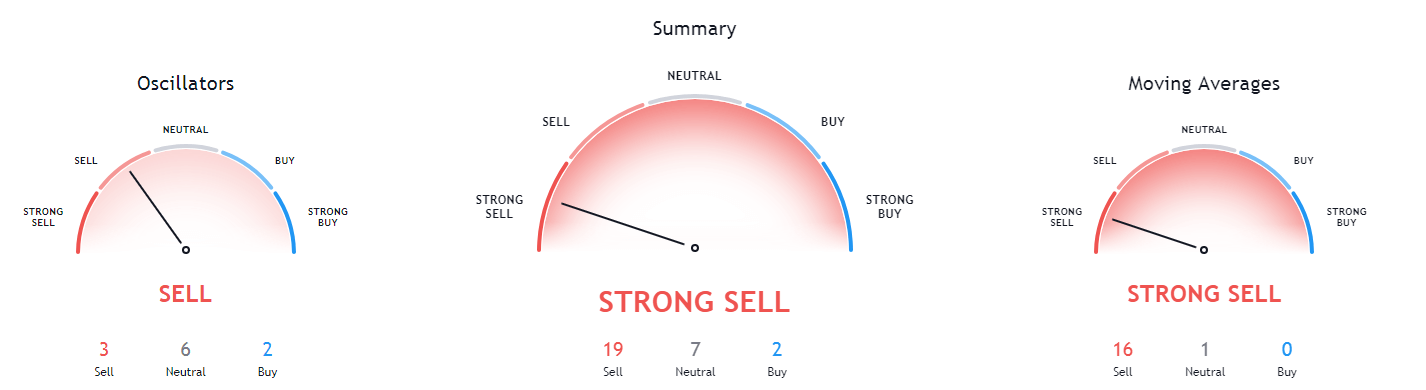
XRP/USD 1-day Technicals
Technical factors (4-hour Chart):
- Its price is currently far below both its 50-period EMA and its 21-period EMA
- Price slightly above its bottom Bollinger band
- RSI is in the oversold territory (19.40)
- Volume is on extremely high levels
Key levels to the upside Key levels to the downside
1: $0.30 1: $0.25
2: $0.358 2: $0.214
3: $0.475


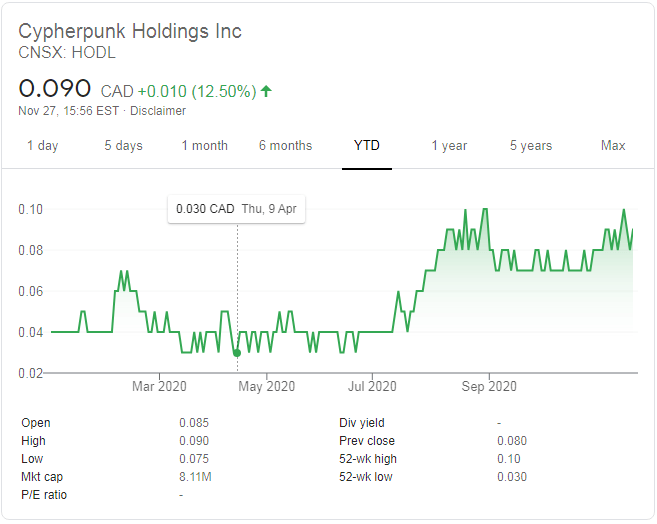
 Cypherpunk Holdings is run by Antanas Guoga, also known as Tony G, a Lithuanian businessman, politician, and former professional-level poker player. He currently serves as an elected member of the Seimas, a legislative branch of the Lithuanian government. Prior to this, he served as a member of the European Parliament for Lithuania.