
The cryptocurrency sector is stabilizing after Bitcoin’s failed push towards the upside, which in fact created a new all-time high, but just for a moment. Bitcoin is currently trading for $27,848, representing an increase of 3.41% compared to yesterday’s value. Meanwhile, Ethereum’s price has decreased by 1.22% on the day, while XRP gained 5.71% of its value.
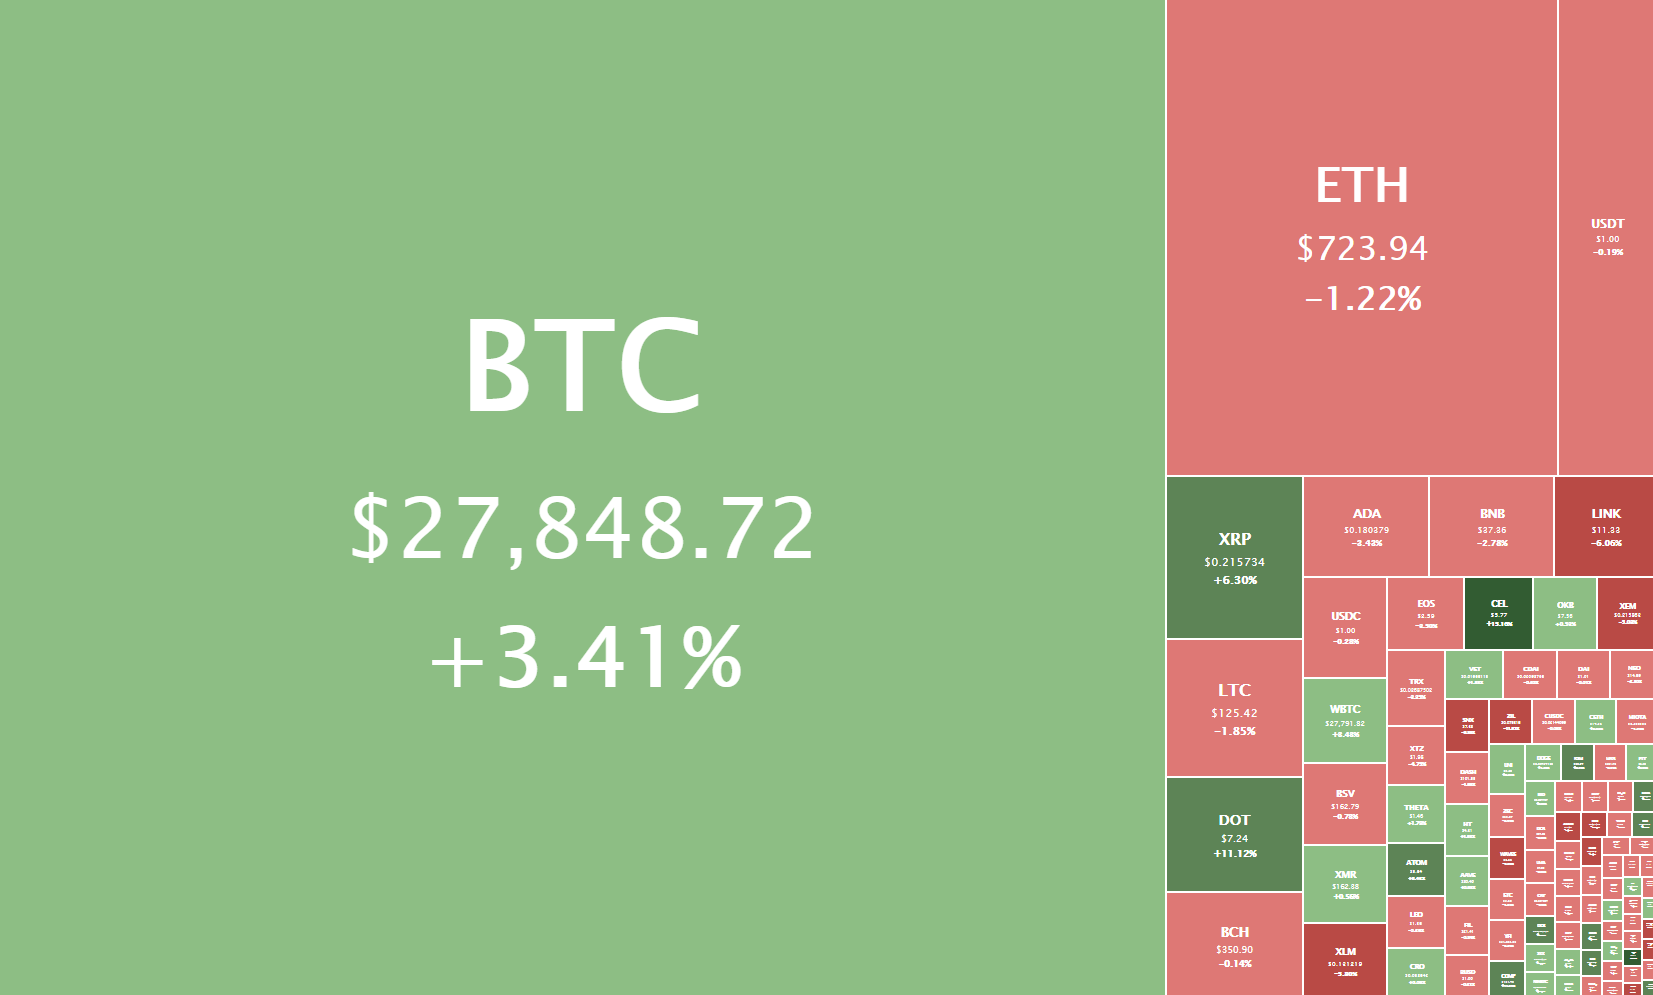
Daily Crypto Sector Heat Map
EveryCoin gained 371.17% in the past 24 hours, making it the most prominent daily crypto gainer by far. It is followed by Wownero’s 223.09% and Gala’s 167.69% gain. On the other hand, PENTA lost 98.72%, making it the most prominent daily loser. It is followed by AS Roma Fan Token’s loss of 64.83% and Reef’s loss of 64.46%.
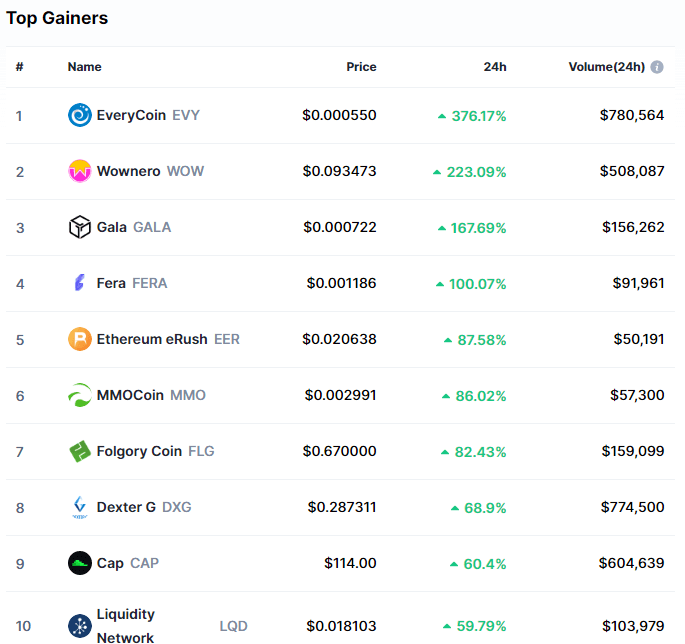
Top 10 24-hour Performers (Click to enlarge)
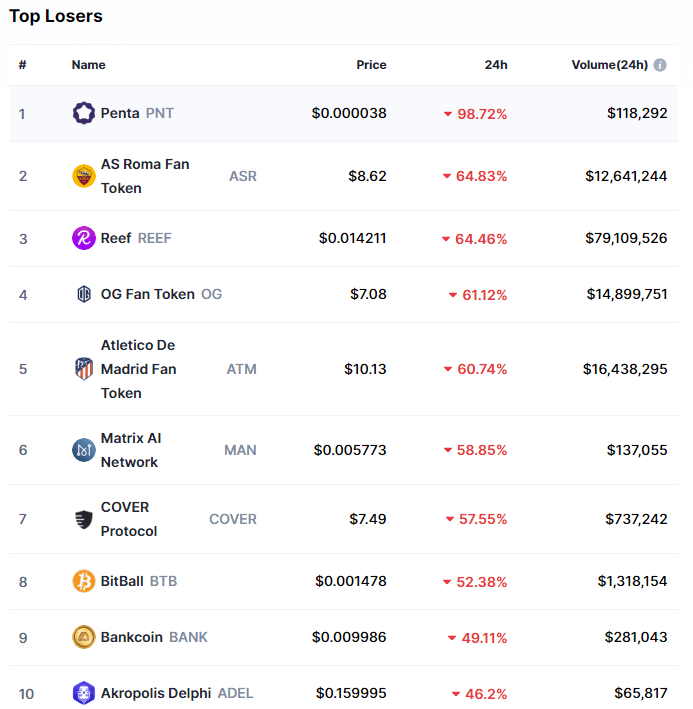
Bottom 10 24-hour Performers (Click to enlarge)
Bitcoin’s market dominance has moved up almost a whole percent since our last report, with its value currently being 70.1%. This value represents a 0.9% difference to the upside than the value it had when we last reported.
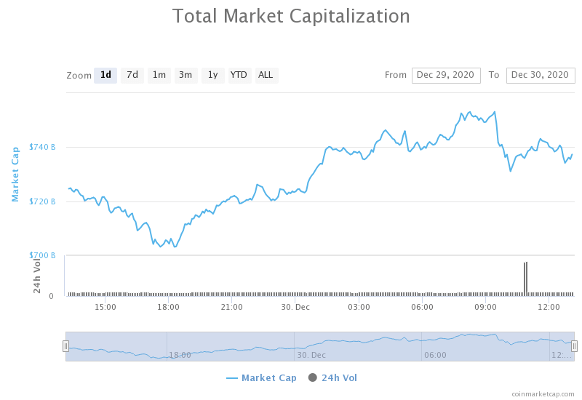
Daily Crypto Market Cap Chart
The cryptocurrency sector capitalization has increased since we last reported, with its current value being $737.31billion. This represents an $24.83 billion increase when compared to our previous report.
_______________________________________________________________________
What happened in the past 24 hours?
_______________________________________________________________________
- Anthony Scaramucci’s Skybridge has invested $182 million into bitcoin, according to deck (The Block)
- Wirex to exclude embattled XRP from US launch as fellow UK crypto firms plan their responses (The Block)
- SEC vs. Ripple case: Initial pretrial conference set for February 22 (The Block)
- Crypto Users Need to Fight U.S. Surveillance Rules (Cryptobriefing)
- eToro Could Go Public With $5 Billion IPO (Cryptobriefing)
- Tesla Founder Elon Musk Agrees to a Crypto-Based Mars Economy (Cryptobriefing)
- Two DeFi coins THORChain (RUNE) and REN break out of slumber with 10% rallies (Cryptoslate)
- Why XRP suddenly spiked 35% in 45 minutes after a massive correction (Cryptoslate)
- Panthers’ Russell Okung Becomes First NFL Player to Be Paid in Bitcoin (Coindesk)
- File comments against new crypto FinCEN rule, Coin Center leader urges (Cointelegraph)
_______________________________________________________________________
Technical analysis
_______________________________________________________________________
Bitcoin
Bitcoin has broken its slight descending consolidation phase by bouncing off of the $26,000 level and pushing towards its all-time high level. While the level got barely broken and Bitcoin set a new all-time high, the bulls were not able to push past the resistance zone with confidence due to the lack of volume and buying pressure.
As a consequence of this, Bitcoin dipped to $27,600 levels, where it is consolidating at the moment. Traders should pay attention to volume movements, as these are the best indication of whether the move will actually break a support/resistance level at the moment.
If Bitcoin fails to break the all-time high level in the short future, we can expect a retracement that could reach the $23,000 zone.
BTC/USD 1-hour chart
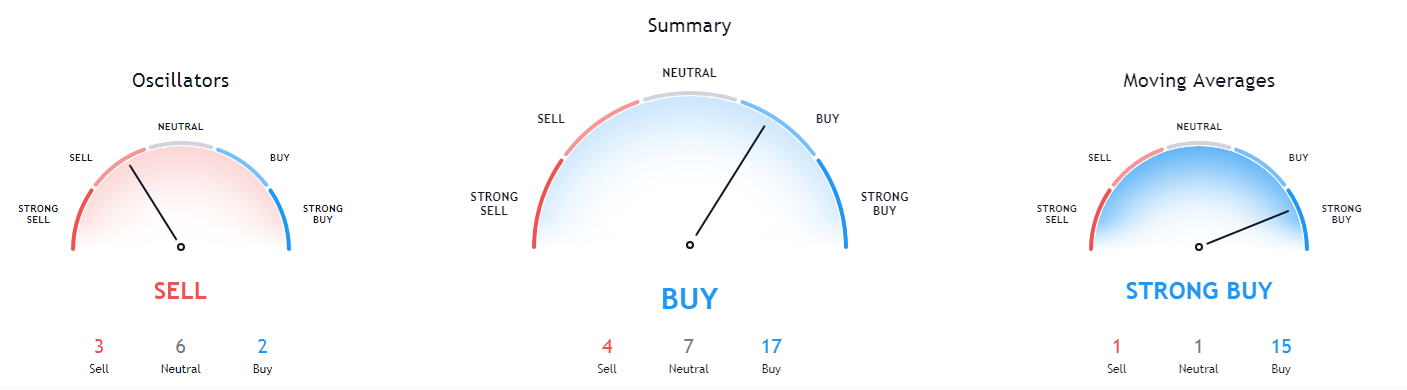
Bitcoin’s technicals on the 4-hour and weekly time-frames are completely bullish, while the daily and monthly ones still contain some form of neutrality or bearishness.
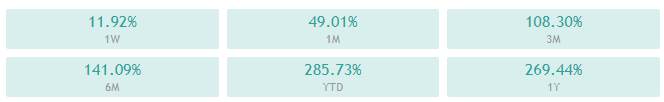
BTC/USD 1-day Technicals

Technical factors (4-hour Chart):
- Price is above its 50-period EMA and at its 21-period EMA
- Price is near its top Bollinger band
- RSI is neutral (61.24)
- Volume is slightly above average
Key levels to the upside Key levels to the downside
1: $28,391 1: $25,512
2: $29,000 2: $24,696
3: $30,000 3: $24,315
Ethereum
Ethereum has spent the whole day trading right below its immediate resistance level of $747. The second-largest cryptocurrency by market cap tried to break above it twice, but failed both times. Ether is currently descending in price as a consequence of the failed bull attempts which created a double top.
Ethereum traders have to pay attention to Bitcoin’s movements, as its movement (either up or down) will most likely cause Ether’s next move.
ETH/USD 1-hour Chart
Ethereum’s technicals on every time-frame are tilted towards the bull-side. However, they all contain slight neutrality or bearishness alongside the overall tilt towards the buy-side.

ETH/USD 1-day Technicals
Technical Factors (4-hour Chart):
- Price is above both its 50-period and its 21-period EMA
- Price is near its middle Bollinger band
- RSI is neutral (58.07)
- Volume is trading on above-average levels
Key levels to the upside Key levels to the downside
1: $747 1: $675
2: $800 2: $653
3: $900 3: $632
Ripple
XRP has spent the day trying to stabilize its price after days of constant price dips. The fourth-largest cryptocurrency by market cap bounced off of the $0.173 level, and propelled itself towards the next zone, sitting at $0.214.
XRP is currently fighting for the $0.214 level, and if no new news (positive or negative) pop out, its short-term price will most likely depend on whether it manages to stay above the $0.214 level or fall below it.
XRP/USD 1-hour Chart
XRP’s technicals on all time-frames are tilted towards the sell-side, with only the 4-hour and monthly overviews showing some form of neutrality.
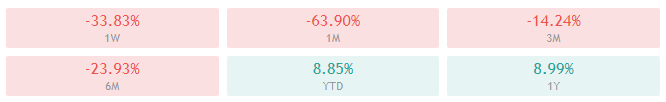
XRP/USD 1-day Technicals
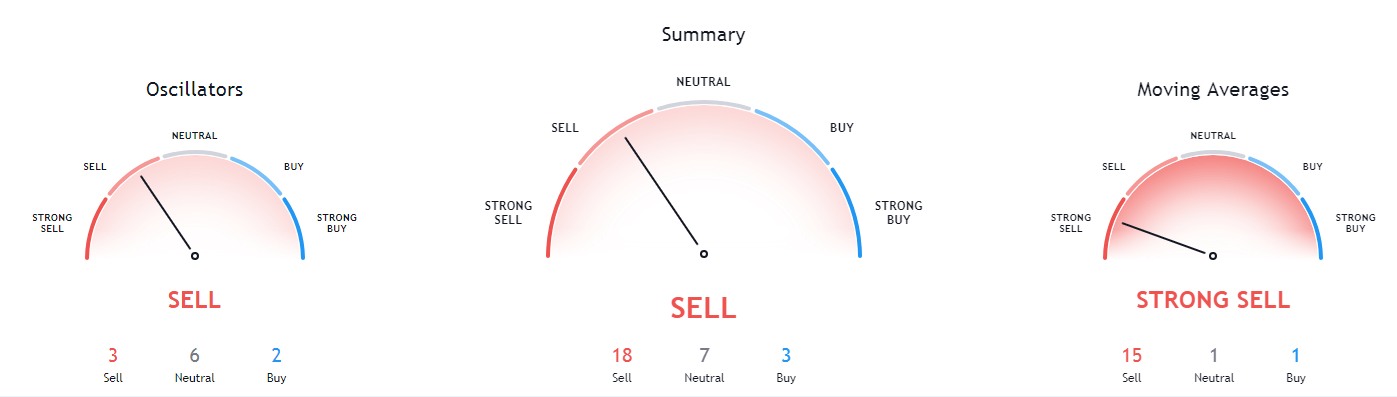
Technical factors (4-hour Chart):
- Its price is currently far below both its 50-period EMA and its 21-period EMA
- Price is between its bottom and middle Bollinger band
- RSI is in the oversold territory (37.52)
- Volume has spiked to above-average levels
Key levels to the upside Key levels to the downside
1: $0.25 1: $0.214
2: $0.30 2: $0.14
3: $0.358
Related posts
 Daily Crypto Review, Oct 28 – Cryptocurrencies surging, China’s president optimistic on blockchain technology
 Daily Crypto Review, Nov 7 – Crypto-mining in China no longer illegal
 Daily Crypto Review, Nov 11 – Cryptocurrency markets dropping, IRS chasing crypto-tax evaders
 Daily Crypto Review, Feb 3 – Cardano, the most decentralized crypto in the world? Altcoin season coming?