Impulse indicators measure the rate of change in closing prices and are used to detect weakness in trends and potential points of turn. Often not taken into account for their simplicity, but the importance of the boost in the forex market should not be overlooked. They can be a great way to make a profit by identifying a strong movement that is already underway.

In this lesson we will learn some valuable additional tips that will be useful when using impulse indicators: momentum trading can be as profitable as S/R trading (support and resistance).
What Are Impulse Indicators Used For?
Impulse indicators are useful to solve the following types of common traders dilemmas that S/R indicators cannot answer. For example:
A currency pair has broken past all previous S/R points and is making new historical highs or lows, so there are no S/R levels telling us if it is a good time to place or withdraw a position. Is it worth getting on the ride, or would it be better to get out of the way?
He didn’t place positions in time on a trend that’s been working for a while. How can you tell if there is still time to follow the trend? How can you reduce or eliminate the risk of buying at maximum or selling at the minimum? It could expect a setback, but while it waits, it risks losing even more of the movement. This is a natural human error, to assume that one is too late when in fact some of the safest benefits you can take on the market are at this time of apparent “over-buying”.
You have a winning operation open and want to keep it as long as possible, but you don’t want to risk staying too long and losing part of your winnings. Or it’s approaching the resistance and its intended point of exit. Do you take profits or leave part or all of the position in the hope of letting the profits run with a trailing stop?
If we look at what happened to gold from May 2009 to August 2011, from May 2009 to August 2011 it was making new historical highs and showed only 8 months down from a total of 27, rarely regressing to anything but very short-term levels of support.
Those who expected significant setbacks never saw them arrive and missed the biggest trend of the year, while gold consistently reached new historical highs. Expecting a setback in the upward trend here was not a good idea!
We, traders and investors, earn our living by correctly predicting what will happen in the future, even though we don’t have to be exactly right to make money – we just have to be roughly right. However, the S/R indicators we have covered so far tell us about what happened in the past. While that’s helpful in predicting the future price action, S/R indicators can only tell us about the strength of S/R levels. The other half of the image is lost as they cannot tell us if a trend is strong enough to break beyond a certain level of S/R. In addition, cannot tell us anything about future price movements when a currency pair or other assets have broken beyond all levels of S/R to new historical highs or lows. Fortunately, there is a way around this, apparently, very difficult problem.
What should traders do? Employ a style of impulse trading using impulse indicators.

The Advantages of Impulse Indicators
These indicators can give us a better idea of future price movements because:
- Show whether a trend is strengthening or weakening.
- They can tell you if an asset is overbought or oversold according to the price range for a certain prior period.
That helps us decide whether the trend is likely to continue or change direction. Knowing this can help us predict changes and have greater profitability. In short, impulse trading with impulse indicators can offer additional clues to assess the odds of hitting even more in your favor.
There are many indicators of momentum, but at the moment we will present you with only a few of the most effective and easiest to use indicators:
- Double Bollinger Bands.
- Mobile Stocking Crosses (MA).
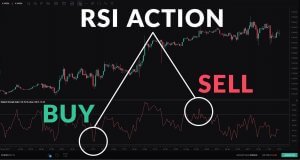
- Three types of basic oscillators: Convergence/Divergence of Moving Mean (MACD), Relative Force Index (RSI), and Stochastics.
Why the Gold Chart? Brief Introduction to Market Relations
Are you wondering why we use a gold chart in a foreign exchange article? The reason for this is that, for a number of reasons, currencies and raw materials are often related to each other and are therefore sometimes traded as substitutes for each other.
For example, because Canada is a major oil producer, the DAC often moves with the price of oil. Under certain conditions, it’s more sensible to negotiate a DAC currency pair than oil and vice versa.
Although different types of goods, such as stocks, commodities, and currencies have some notable differences in their behaviour – for example, Forex currency pairs tend to fluctuate in value in relatively small amounts compared to commodities, that tend to be more volatile – can illustrate truths about successful trading methods by using them all interchangeably.
Gold is a special case because it is considered the main hedge against currency devaluation. When investors are concerned about the decline in the value of one of the most widely held currencies (especially the USD and the EUR), gold can rise.
Therefore, at a time when the fundamentals for both the EUR and the USD are not good, but it is not clear whether to go long or short with the USD, the traders play it safe and just have to go long with the gold. We will see that happen at a time when there is a great deal of anxiety about the stability of large parts of the global financial system. For example, gold has tended to rise during episodes of great concern over the EU’s sovereign and bank debt crisis. At times like these, traders often buy gold en masse because:
- It seems that the EUR might not even survive.
- The Fed may be printing massive dollars in order to help Europe and steer the US economy away from the possible consequences of an economic crisis in the EU.
In fact, if you compare a timeline of the EU crisis and a weekly gold chart covering those years, you will notice that gold often rose to new highs. Later we will cover this and other relationships between markets and know how to use them.
How Do Impulse Indicators Work?
As its name indicates, the impulse indicators focus on the price exchange rate, that is, if the price goes up or down by more than it used to. While exact mathematical calculations and emphasis vary between different impulse indicators, they all attempt to provide some perspective on:
- If the price is changing at a faster or slower pace
- If the exchange rate indicates the strength or weakness of the trend
For example:
- A steady increase in the speed at which price goes up or down suggests trend strength
- However, too rapid acceleration is often interpreted as a sign of “trend exhaustion” or a maximum turn (or minimum turn in bearish trends) suggesting a final drastic increase in optimism (or pessimism in bearish tendencies) that drains the remaining buyers (or sellers in the downward trends) and prepares the end of a trend and turn of it.
When this happens, you will hear analysts saying that the pair is:
- “Overdrawn”, if the price has gone up too fast or for too long, and therefore is expected to turn and start to fall.
- “Overwritten” if the price has fallen too fast or for too long, so it is expected to rise.
It is important to be careful, however, because sometimes these terms are used too easily. ” Over-buying” and “over-buying” are sometimes used when the price has just gone up or down a lot, when it is really the speed with which the movement has occurred that is the crucial factor.