Litecoin is progressing slightly upward within a complex structural series, which leads to foresee two possible scenarios.
The cryptocurrency Litecoin against the US Dollar (LTC/USD), in its 8-hour chart, shows the plummet that led it to lose more than 70% of its value since February 13th when the price topped at level 84.193.
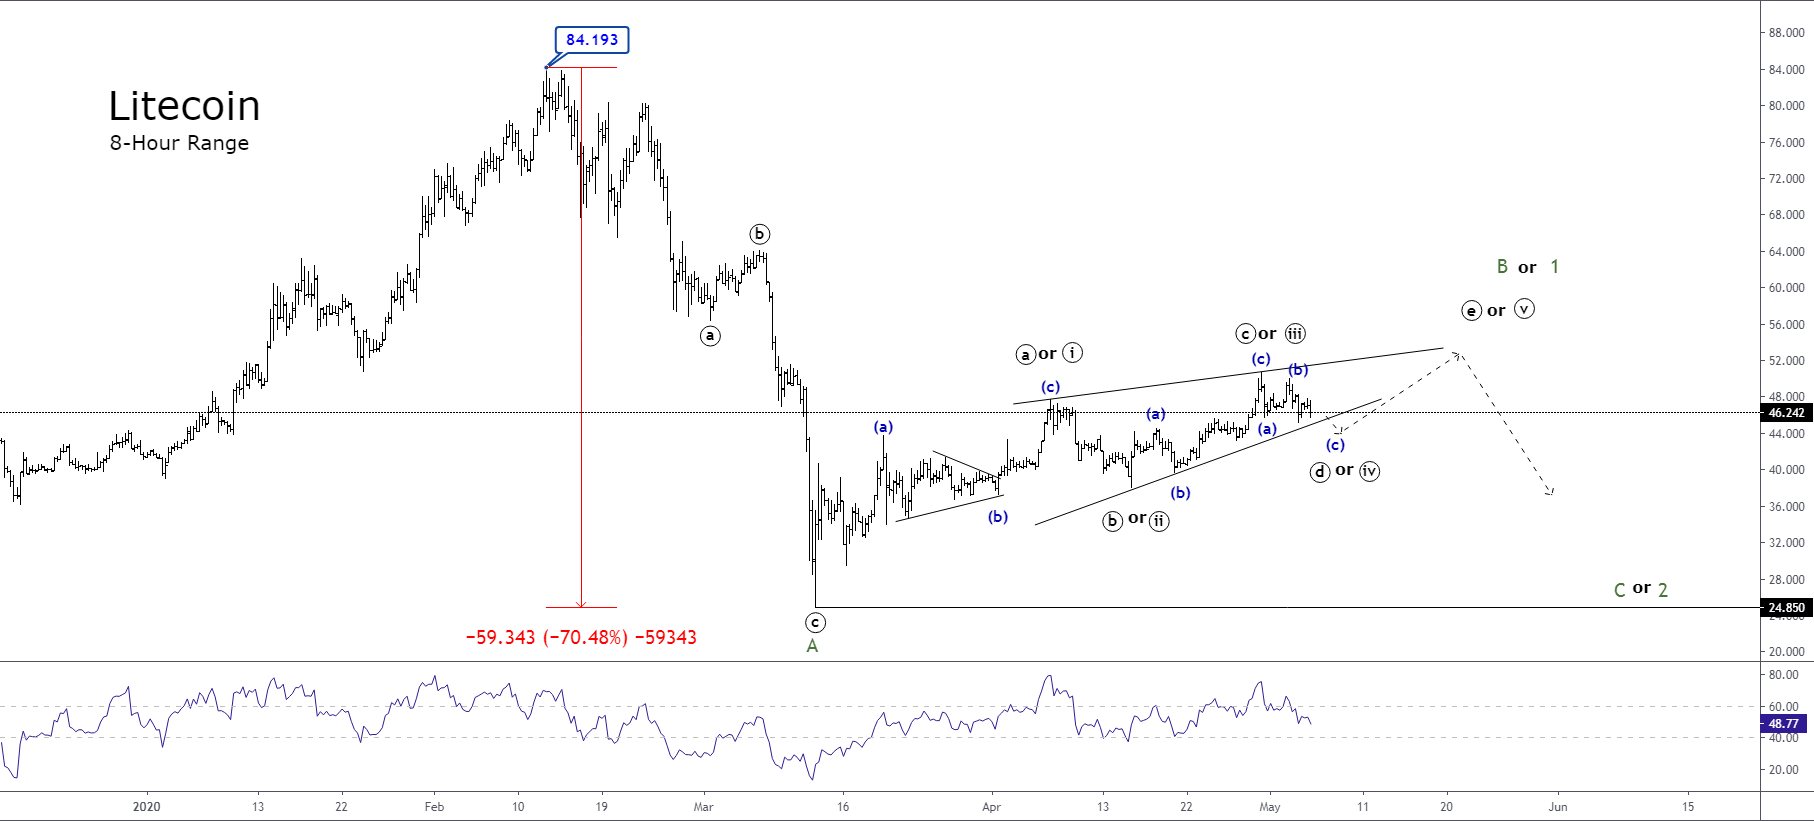
Once Litecoin hit the top at 84.193, the price made a three-wave bearish sequence, which ended on March 13th when the price found fresh buyers at level 24.850. In the previous chart, we distinguish this structural series identified in the waves ((a)-((b))-((c)) of Minute degree in black.
After LTC/USD completed the wave ((c)), the price action began to advance in a complex structural series with its internal movements composed of three waves. This sideways movement with a slightly upward bias leads us to foresee two potential scenarios for currency crypto.
Scenario 1 – Triangle Pattern in Progress
The first scenario considers the possibility that Litecoin advances in a triangular formation belonging to a wave B of Minor degree labeled in green.
According to the Elliott wave theory, a triangle pattern is composed of a series of five internal segments, which is subdivided into three waves following the 3-3-3-3 structure. Likewise, within a price cycle, this pattern tends to appear in waves 4 and B.
Scenario 2 – Developing a Leading Diagonal
The second scenario presents the option that the price action develops an ending diagonal pattern.
This type of pattern is composed of five internal waves overlapped one each other and follows a 3-3-3-3-3 sequence.
If the price action develops this scenario, the next movement should correspond to a wave 2 of Minor degree, and it should be composed of a three-wave structural series.
The main consequence of this scenario would be that, once the wave 2 completion, Litecoin should perform a bullish wave 3.
At the same time, considering the alternation principle of the wave theory, this third wave should have greater upward momentum than that momentum observed in the current wave in progress.
In conclusion, our short term preferred positioning is on the neutral side until the completion of the current formation.