Categories
Crypto Market Analysis

Daily Crypto Update 06.06.2018 – Prices Hovering Around The Same Levels May Trigger Selling

General Overview


Market Cap: $343,665,292,792

24h Vol: $15,166,854,450

BTC Dominance: 37.9%

From yesterday’s open at $341B, the crypto market cap fell to 330,636,000,000$ to yesterday’s low from where the evaluation has been rising. It had experienced an overall increase of 3 million dollars.

 The market is dominantly in green with an average increase of 2% amongst the top 100 coins. Biggest gainers are Nexus by 15%, Binance coin 12.54%, and the biggest loser is Huobi Token who dropped by 11% today.


News


Overall, news that came out in the last 24 hours is mostly positive, however, there are some significant negative items. Out of those that are positive, we can put them into two categories – blockchain tech adoption and positive relation to cryptocurrencies.

Regarding blockchain adoption these are the stories that stand out:

Samsung SDS is launching its own blockchain platform called “Nexfinance”, according to the official press release.

Nexfinance is a digital banking platform, applying artificial intelligence, blockchains, big data analytics and advanced IT technologies, such as intelligent process automation (IPA).

U.S. government telecoms agency seeks feedback on blockchain technology for its international agenda

In an announcement, the National Telecommunications and Information Administration (NTIA), which is part of the U.S. Department of Commerce, said that it wanted stakeholders’ input in “shaping its international agenda.”

As the tech evolves and is showing the benefits, many are jumping aboard to seize the opportunity and have the first mover advantage. There are two major news items regarding banks utilisation of the tech as well, as the traditional finance industry fear its decentralised competition.

South Africa’s Central Bank Pilots Tokenised Fiat Interbank Payment System

South Africa’s Central Bank (SARB) has successfully piloted a Proof-of-Concept (PoC) for an interbank payment system that tokenises fiat using Quorum, according to an SARB press release published June 5th. Quorum is an Ethereum-based private blockchain.

Chinese Central Bank Develops Blockchain System to Digitise Paper Checks (Cheques)

The People’s Bank of China (PBoC) has revealed a blockchain-powered system to digitise paper checks (cheques), local media Financial News reports June 5. The system aims combat financial fraud as well as reduce expenses for printing them.

Even though what was previously stated is evident, representatives from multiple central banks discussed in Amsterdam on Money20/20 conference whether or not cryptocurrency are posing a threat to the fiat system.

During a panel talk titled “Cryptocurrency, the Central (Bank) Question”, representatives from the Swiss National Bank, the Bank of Lithuania, the Bank of England, and the Bank of Canada took turns responding to the question “Can cryptocurrencies spell the end of fiat currencies?”.

Source: cointelegraph.com

They have concluded that cryptos are not yet a threat to the fiat system, as long as central banks are doing a good job. As a matter of fact, central banks are doing a fantastic job, but for themselves – which is why Bitcoin was invented in the first place.

As the dollar devaluates throughout the years, through fractional reserve banking and insane money printing, the purchasing power diminishes and national debt is rising insanely. A Keynesian economic model proves it to be unsustainable which is why people are looking for better alternatives. That’s why people are enthusiastic about cryptocurrencies.

Adena Friedman, president, and CEO of Nasdaq Inc,. recognizes this trend as he stated in an interview on Bloomberg Businessweek on June 5., that cryptocurrencies are at “the height of a hype cycle” and can become a “financial element of the Internet.”

On the other side, some like Jim Chanos, hedge fund manager, who said last year, that he “didn’t understand” Bitcoin or blockchain technology, now said speaking at Institute for New Economic Thinking that:

“This is simply a security speculation game masquerading as a technological breakthrough in monetary policy.”

According to him, in the event of a global crisis, it would be “better” to own food or a government-backed (fiat) currency.

Even though cryptos are “not there yet” would it really be better to hold fiat currency in a global crisis that was probably induced by those same central banks?


Analysis


BTC/USD

From yesterday’s open at 7471$ the price of Bitcoin has increased by 1.65%, coming to 7595$ where it is currently sitting.


Looking at the hourly chart we can see that the price is yet again below the support baseline and form a cluster but this time there’s now higher high which is the sign of weakness. I am expecting the price to drop from here like it did three times previously, and the first support would be at yesterday’s open of 7470$ levels.


Market sentiment

Hourly chart technicals are on buy, but it looks more like neutral as we have 8 indicators signalling a buy, 9 are neutral, and 9 sell.


Pivot points

S3 6950.3 
S2 7253.3 
S1 7437.6 
P 7556.3 
R1 7740.6
R2 7859.3 
R3 8162.3

LTC/USD

From yesterday’s low at 116.115$ the price of Litecoin has increased by 4.16% coming to 121.140$ where it is currently.


Looking at the hourly chart we can see that the price is still in the retracement zone, and currently in a triangle which can be interpreted as a bull flag. If the price breaks out from above, I would expect to see the interaction with the retracement zone resistance at 124,7$, but from the degrees of the triangles trendlines, we can see that sellers are more aggressive and that the price is likely heading down afterwards.


Market sentiment

Litecoin is in the buy zone, as indicated from hourly chart technicals.

Oscillators are on sell (8), and moving averages are signalling a buy (9).


Pivot points

S3 105.807 
S2 113.097 
S1 117.743 
P 120.387 
R1 125.033 
R2 127.677 
R3 134.967

ETH/USD

From yesterday’s low at 576.13$ the price of Ethereum has increased by 4.62% rising to 602.8$ where it is currently sitting.


On the hourly chart, we can see that the price is yet again above the down channels resistance line and 0.382 Fibonacci level. As the price action is showing signs of topping as indicated by the cluster which resembles the previous one, I am expecting it to go down from here probably to this last uptrend support line (blue line) and down channels resistance line intersection to retest for support.


Market sentiment

Hourly chart technicals signal a buy, however, it more looks like neutral as 7 indicators are on sell, 10 on neutral and 9 on buy.


Pivot points

S3 522.99 
S2 561.21 
S1 584.96 
P 599.44 
R1 623.18 
R2 637.66
R3 675.88

XMR/USD

In the last 24 hours, the price of Monero has been rising. From yesterday’s low to yesterday’s high, the price increased by 7.8%. However, from yesterday’s open until now, Monero has increased overall only 1.65% – from 160.9$ to 163.420$ where it is now.


Looking at the hourly chart we can see that the price action is between the triangle support line (black line) and wedge support line (blue line) which I’ve declared a dominant pattern in the charting section previous week. Currently, we see another triangle forming and the price bounced off its resistance line. I would expect a few more bounces before a breakout, but I wouldn’t recommend trading it because if the proximity of the triangle and wedge support which would surely repeal the price in either way, so the trade would be short-lived.


Market sentiment

Monero is in the sell zone, as indicated by the hourly chart technicals.

Oscillators are on neutral, and moving averages on a strong sell.


Pivot points

S3 137.857 
S2 151.127 
S1 159.123 
P 164.397 
R1 172.393 
R2 177.667 
R3 190.937

Conclusion


As the prices have shown a lot of sideways movement in the last few days, unable to create significant highs and are not falling further below, we are soon going to see a triggered action. As the prices are hovering at around the same levels for days I would expect people to get anxious and start selling as they would fear not to lose money, because the prices aren’t going higher. In that case, we may see a retest of prior lows or even lower lows which would in the case of Bitcoin mean a drop to 7000-6500$ levels.

Categories
Crypto Market Analysis

Weekly Crypto Update 04.06.2018 – Sideways Movement Expected (Video)

From Monday 28th May, the total cryptocurrency market cap evaluation has been rising overall, but it experienced a lot of choppy movement, as for every new high it made, a sharp downward movement occurred. That means the market sentiment is still bearish as sellers are waiting anxiously for the right price in order to sell.

In this weekly video, I am going to provide my Elliott Wave forecast and explain as to why I think we are in for more sideways movement before another large drop.


Categories
Crypto Market Analysis

Weekly Crypto Update 04.06.2018 – Sideways Movement Expected


General Overview


Market Cap: $344,628,122,166

24h Vol: $16,760,046,234

BTC Dominance: 37.8%

From Monday 28th May, the cryptocurrency market cap evaluation has been rising overall, but it experienced a lot of choppy movement, as for every new high it made, a sharp downward movement occurred. That means the market sentiment is still bearish as sellers are waiting anxiously for the right price in order to sell.

The resistance line at around 342 billion dollars has been crossed and it is now being retested for support.


News


This weeks top headlines are the following:

South Korea is in the process of lifting the ICO ban 

The National Assembly has officially made a proposal to allow domestic initial coin offerings (ICOs). As the administration is sitting on its hands after imposing a total ban on ICOs in September last year, the National Assembly has come forward with an official recommendation.

Source: http://www.businesskorea.co.kr

Major vulnerability found in the EOS blockchain days before the mainnet launch. 

China’s largest Internet security company, Qihoo 360, has found several high-risk security vulnerabilities in EOS’s blockchain platform. These vulnerabilities would enable remote attacks on all EOS nodes, Qihoo 360 claimed on Weibo Tuesday, May 29.

Crypto exchange Binance plans to create 1 billion dollar fund.

Binance, currently the world’s largest cryptocurrency exchange by trade volume, plans to create a $1 bln cryptocurrency-based fund, an executive confirmed June 1. Using only Binance’s BNB tokens as an investment vehicle, the fund will be administered through the exchange’s incubator spin-off Binance Labs.

Source: cointelegraph.com


Analysis


BTC/USD

From Mondays open, the price of Bitcoin has increased by 4.2% coming from 7294$ to 7608$ where it is currently. The rise was in the form of an upward channel/wedge.


On the daily chart, we can see that the price was at its lowest last Monday and below the baseline support (bold black line). Since then the price went above the baseline support with strong momentum, as those lows triggered buyers who have pushed the price higher. The price is currently inside the triangle again and was repealed by the triangle resistance line and 0.236 Fibonacci retracement level, so the price fell back to the baseline support again.


Market sentiment

Bitcoin daily chart technicals signal a sell.

Oscillators are on buy, but moving average signal a strong sell.


Pivot points

S3 6141.4 
S2 6800.2 
S1 7219.1
P 7459.0 
R1 7877.9
R2 8117.8 
R3 8776.6

ETH/USD

From Monday, May 28. Ethereum’s price increased by staggering 22.27% from 494$ which was the week’s low, to 605$ where it is currently sitting.


Looking at the daily chart, we can see that the price found support at the 0.236 Fibonacci retracement level and the unconfirmed support, and is currently repealed by the downward channel resistance line and is heading down to the 0.382 Fibo level. Overall last week was bullish for Ethereum, but judging by how much has the price increased and the interaction with the significant trendlines, this week may not be the same.


Market sentiment

Ethereum is in the sell zone.

Oscillators are signalling a buy, but with 8 on neutral, and moving averages are signalling a strong sell.


Pivot points

S3 343.61 
S2 452.53 
S1 521.49 
P 561.45
R1 630.41 
R2 670.37 
R3 779.29

XRP/USD

In the last 7 days, the price of Ripple has been increasing steadily from 0.544$ to 0.656$ which is a 19.54% increase overall.


On the daily chart, we can see that Monday’s opening was the weeks low. From there the price went above the 0.573 with a strong momentum as indicated by the big green candle on Tuesday. Since then the price has been steadily increasing but it was now stopped out by prior range support, which now serves as resistance at 0.699$ levels.


Market sentiment

Daily chart technicals are signalling a sell.

Oscillators are on buy, and moving averages are signalling a sell.


Pivot point

S3 0.39577 
S2 0.50453 
S1 0.57380
P 0.61329
R1 0.68256 
R2 0.72205 
R3 0.83081

LTC/USD

From last Monday’s open, the price of Litecoin has increased by 9.73% from the weeks low on Monday at 110.2$ to 121$ where it is currently.


Looking at the daily chart we can see that the price of Litecoin fell below the retracement zone which is at the 111$ level on last Monday which triggered some buying. That buying pressure was short lived as the price failed to stay above the retracement zone level at 124$ and is now back in it again.


Market sentiment

Litcoin is in the sell zone.

Oscillators are on buy but with 8 on neutral, and moving averages are signalling a strong sell.


Pivot points

S3 88.590 
S2 103.930 
S1 113.810 
P 119.270 
R1 129.150 
R2 134.610
R3 149.950

Conclusion


The market conditions are now similar to that of Jun 2014. After a strong runup, we are seeing a triangle being formed on the global chart.

Market cap chart back in 2014.

As you can see after the evaluation broke out from the triangle it halved in evaluation from the first high that was formed outside of the triangle.

So if the similar thing happens again this would be something that I would expect – a downfall to around $178B which would bring the price of Bitcoin to around 4500$ which would correlate perfectly with my Elliot Wave correction count which can be seen on the weekly update video.

In any way, I would be expecting a lot of sideways movement in the following weeks as the evaluation is clearly in a range.

Categories
Crypto Market Analysis

Litecoin Holding The Minor Gains


Litecoin (LTC)


Market Cap: $6.71B

Circulating Supply: 56.79M LTC

Max Supply: 84M LTC

Volume (24h) $297.53M


Technical Analysis


Litecoin was into another correction phase on the short term as the crypto market has turned to the downside again. The price increased aggressively on Tuesday and has shown an oversold signal. However, it is still premature to talk about a significant increase after one strong bullish candle. I’ve seen a lot of analysts that are sustaining that the major cryptocurrencies will start to increase again and that the correction is completed. Personally, I need a confirmation before I’ll go long again because the major cryptocurrencies are still trapped below some very important and strong resistance levels.


You can see that Litecoin has developed a major triangle on the Daily chart, so only a breakout from this pattern will bring a clear direction for the upcoming period. Price has retested the downside line of the chart pattern and failed to reach and retest the 106.52 static support.

LTC/USD failed to reach and retest the upside 50% Fibonacci line of the descending pitchfork in the last two attempts signaling that the sellers are exhausted after last week’s drop.

We’ll see what will really happen when the rate will reach the fourth warning line (wl4) of the former ascending pitchfork. You should know that a valid breakdown below this dynamic support will signal a further drop. You can see that I’ve drawn a minor ascending pitchfork, so it could come to test and retest the lower median line (lml) in the upcoming days.

Conclusion

You can buy it only if the rate stays within the minor ascending pitchfork’s body, and if it stays above the triangle’s downside line. The first upside target it will be at the UML of the descending pitchfork and the second one at the upside line of the chart pattern. The Stop Loss can be placed below the 106.52 level.

Categories
Crypto Market Analysis

LTCUSD Target of 125 From Current Value Area


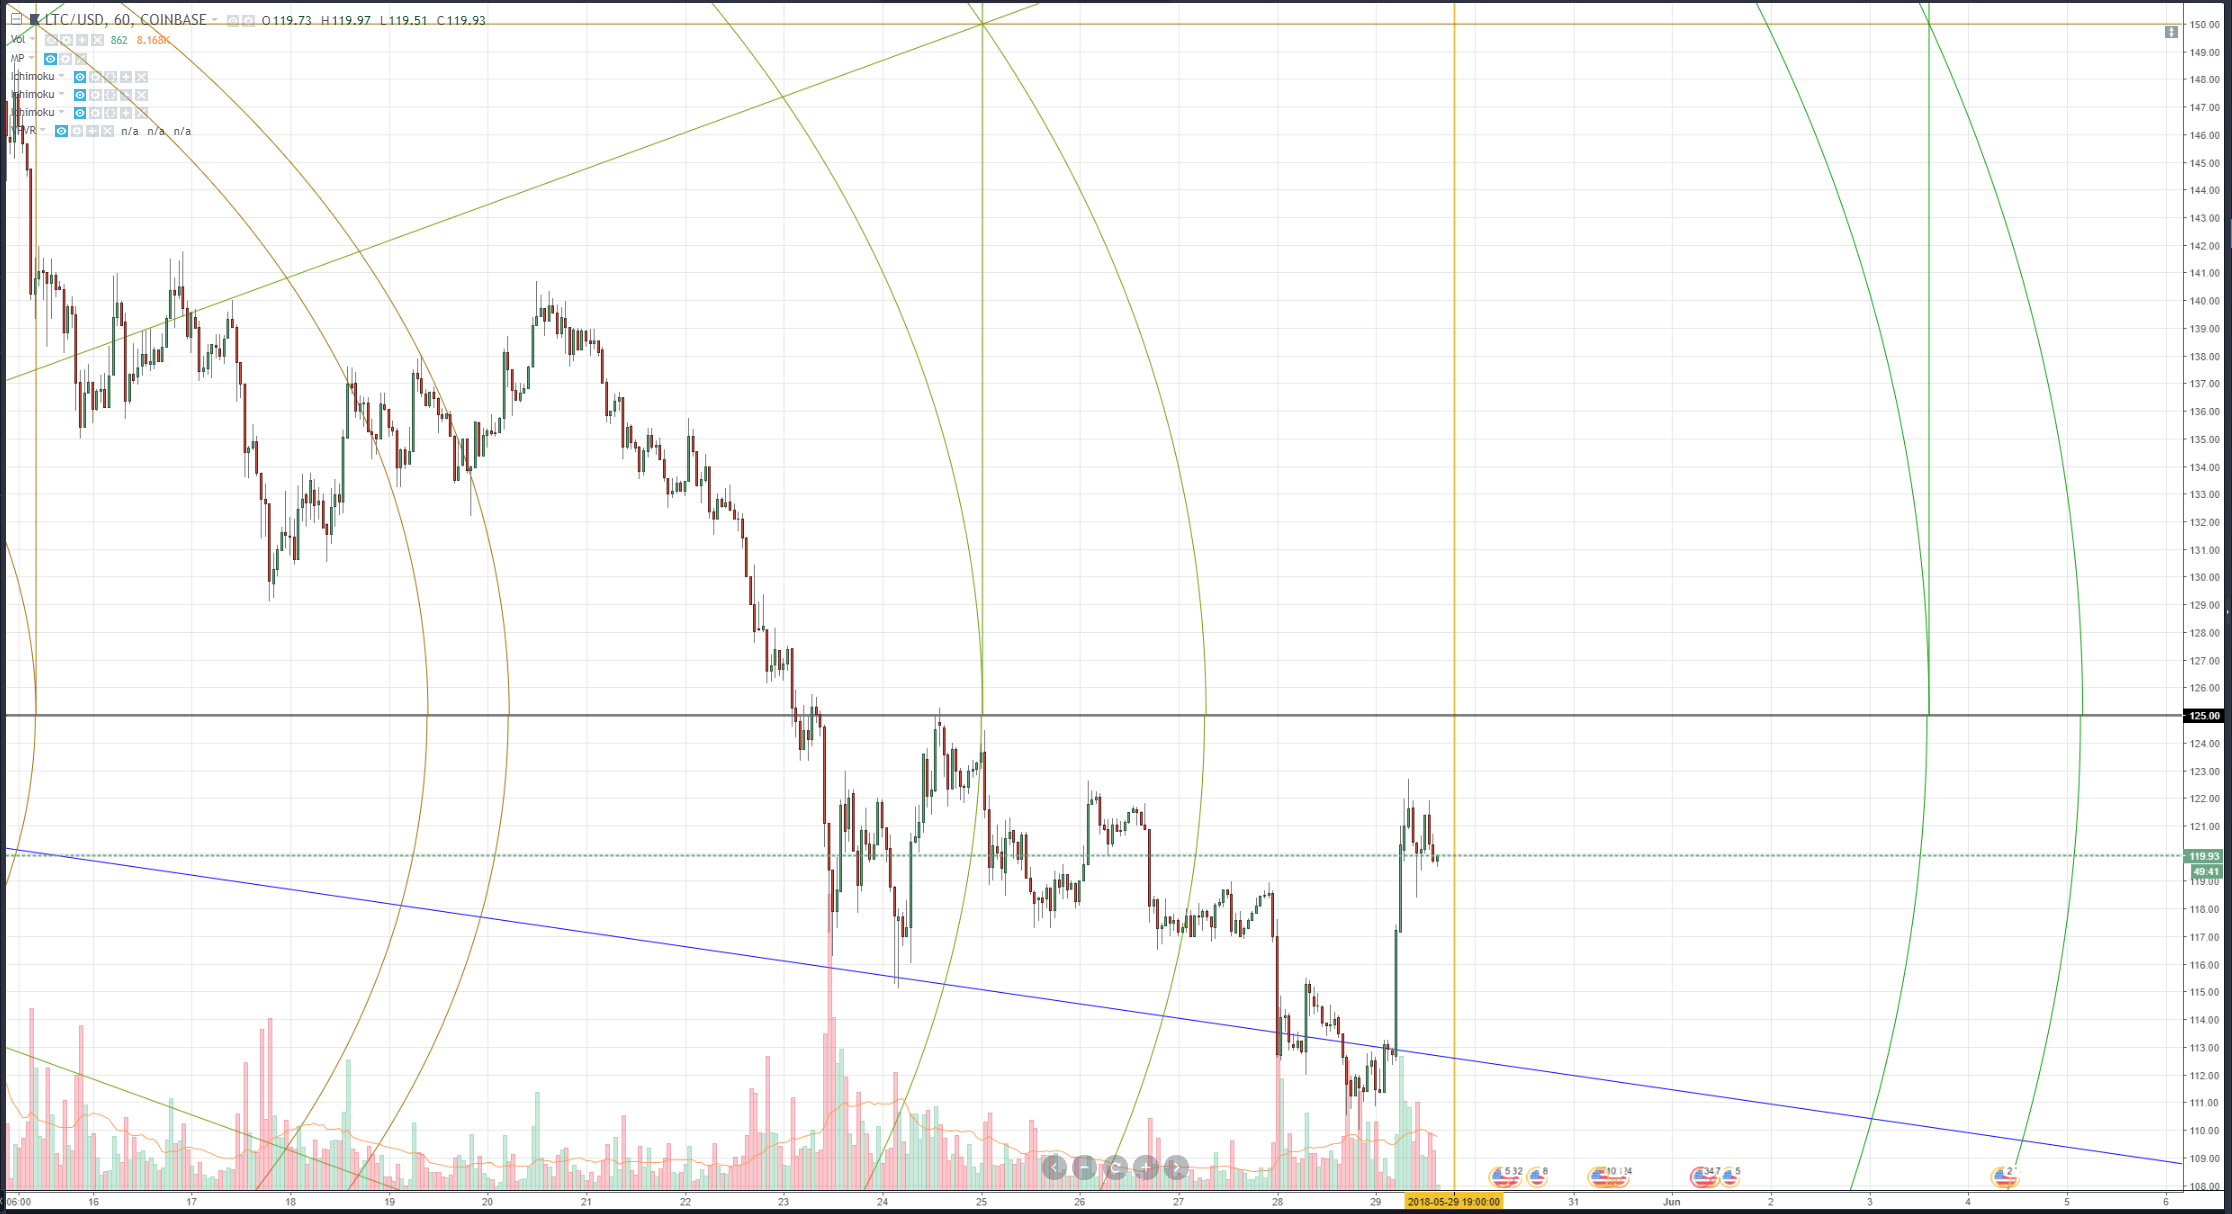
Litecoin has been responding very nicely to the 5×1 angle. It is also right up against a pivot in time. Out of the majors (I consider any currency traded on Coinbase to be a ‘major’), Litecoin is the most sold off and has the least major participation. Fundamentally, it has the most real use value. Considering that the support level was found right inside the 110 value area on that 5×1, the next zone to reach is 125. This brings Litecoin back above and into its major harmonic trading range. It is most definitely the laggard and the major with the most upside potential.

Categories
Crypto Market Analysis

Weekly Crypto Update 20.05.2018 – More Correction Coming


General Overview


Weekly Cryptocurrency Update:

Market Cap: $383,203,468,592 
24h Vol: $15,118,655,008 
BTC Dominance: 37.2%

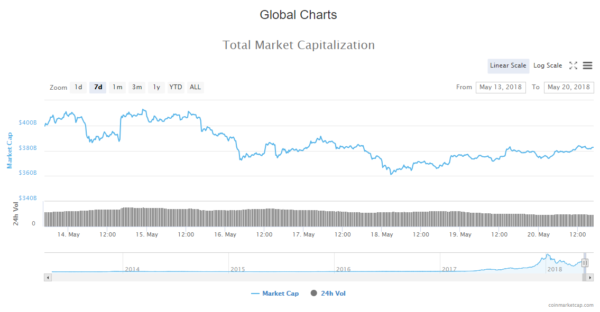
At the start of the week on Monday 14th May, the cryptocurrency market cap evaluation was $407,285,000,000 and it soon dropped to $386,345,000,000 before it spiked up to $412,903,000,000 which was the week’s high. From Monday to Friday, the market cap has been steadily dropping and it hit $361,113,000,000 which was the week’s lowest point.

Weekly Cryptocurrency Market Cap Update

From yesterday, the evaluation has been increasing but it looks like it entered the bearish territory, judging by the spike to $383,159,000,000, and a quick drop. However, this may be a new support level, as the evaluation appears to be stabilising around these levels.


Analysis


BTC/USD

At the start of the week, the price of Bitcoin was $8700 and the only time it went higher was on the same day when it hit $8815 after a drop to $8365. It is now sitting at $8370 which is a 4.8% decrease.


Looking at the daily chart we can see that Monday’s candle was a pin bar doji which indicated stronger buying pressure than the pressure from the sellers, but the position of the candle, however, indicated more downside.

Yesterday’s candle closed as a red doji and as you can see from the wick, the price hit the 0.382 Fibonacci level and retraced since so judging by the wick there’s still a lot of selling pressure.

Today’s candle is green, which is very unusual for Sunday, as on weekends there’s a lot of selling going on. 


Market sentiment

Daily chart technical signals a strong sell.

Oscillators are on a sell and moving averages are indicating a strong sell with 13 MA’s on sell


Pivot points

S3 5360.5 
S2 7120.1 
S1 7795.5 

P 8879.7

R1 9555.1 
R2 10639.3
R3 12398.9

ETH/USD

From Monday until today, the price of Ethereum has decreased by 2.8% going from $733 to $712 where it is now sitting. The price fell even lower to $660 on Friday which is the week’s low.


On the daily chart, we can see that the candle on Monday was a pin bar doji like in the case of Bitcoin and since then, the price fell to the 0.5 Fibonacci levels, where it found support. Yesterday’s candle was a doji also like in the case of Bitcoin, and the current one is green but not higher than yesterday’s which is still a bearish sign. 


Market sentiment

Ethereum’s daily chart technicals signal a buy.

8 oscillators are on neutral and moving averages are signalling a strong buy. 


Pivot points

S3 499.01 
S2 596.73 
S1 646.17 

P 694.45 

R1 743.89 
R2 792.17 
R3 889.89

XRP/USD

From Monday’s open until today, the price of Ripple has declined by 5.82% going from $0.73 to $0.688 where it is currently sitting. The price went down further on Friday to $0.645, but since then, it has been steadily rising to the levels on where it is currently.


Looking at the daily chart we can see that Monday’s candle was a pin bar doji like in the case of Bitcoin and Ethereum, but the correlation doesn’t end there as we can see that yesterday’s candle was a doji also, like it was on the BTC and ETH daily charts. 


Market sentiment

Ripple is still in the sell zone, as daily chart technicals signal a sell.

Oscillators are;- 3 on sell and 8 on neutral, but moving averages signal a strong sell with 12 on sell.


Pivot points

S3 0.48085
S2 0.58545
S1 0.63011

P 0.69005

R1 0.73471
R2 0.79465
R3 0.89925

LTC/USD

Overall this week, Litecoin has decreased by 3.38% from $144 on Monday’s opening to $139.2 where it is today. The price went higher than it was on the opening to $151 on Monday, and it was lower than today’s (Friday), to $129 which was the week’s low.


Looking at the daily chart we can see that the price of Litecoin is currently interacting with the 0.236 Fibonacci retracement level which serves as resistance. On Monday there was great indecision which can be seen on Monday’s candle wicks. On Wednesday we had a pin bar doji that closed above the Fibonacci level which indicated buying pressure, but as you can see the buyers failed to push the price higher, and the sellers were stronger so the price fell below the Fibo level on the next day. 


Market sentiment

Daily chart technicals signal a sell.

Oscillators signal a sell, and moving averages a strong one.


Pivot points

S3 90.493 
S2 114.733 
S1 124.937

P 138.973

R1 149.177
R2 163.213
R3 187.453

Conclusion


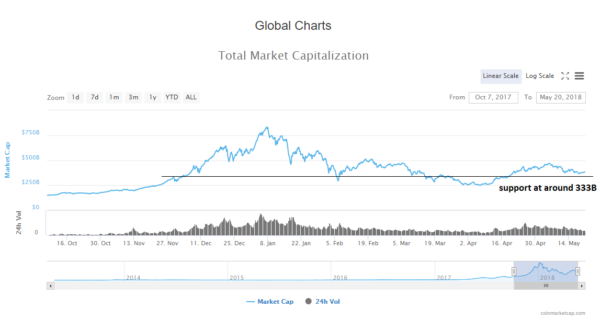
Weekly Cryptocurrency Update: I don’t believe that the corrective move is over. The prices of four major cryptocurrencies failed to exceed prior highs even though we are experiencing a move to the upside in the last couple of days. I think we are in for another low.

Weekly Cryptocurrency Update

This will correspond with a retest of prior resistance for support which is around $333B.

For more information about what’s likely coming in the following week make sure you watch the substitutionary video in which I provide a forecast and reasons why I believe there’s another low coming.


Categories
Crypto Market Analysis

Correction Is On The Way

General overview

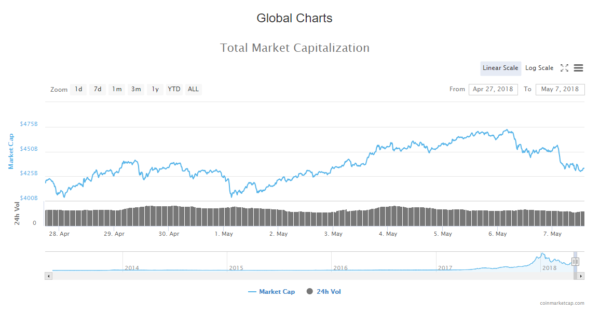
Weekly Crypto Update: At the start of the week, on Monday, April 30. Cryptocurrency market capitalization was around 430B. On the next day, it dropped by 30 billion dollars and has on the rise all the way to 472,272,000,000$ at the highest point on yesterdays open. Since then the evaluation dropped again to 433B where it is now sitting, slightly above the starting point.

Analysis

BTC/USD

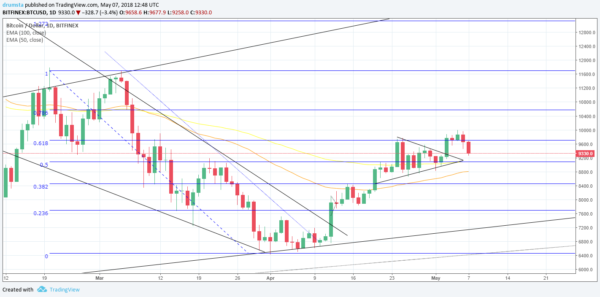
From the opening price on Monday, April 30. The price of Bitcoin hasn’t changed much. It is approximately at the same levels, experiencing only a 0.8% decrease from 9396$ to 9322$ where it is now sitting. However, the price experienced new highs, coming to slightly below 10k to 9952$ to be exact on yesterday’s close, but has decreased significantly in the last 24 hours.

Looking at the daily chart we can see that the price broke out of the triangle in which it was consolidating, and went above 0.618 Fibonacci level, retested it for support, but the level didn’t hold. The price is significantly above the 100-day EMA which is a good sign.

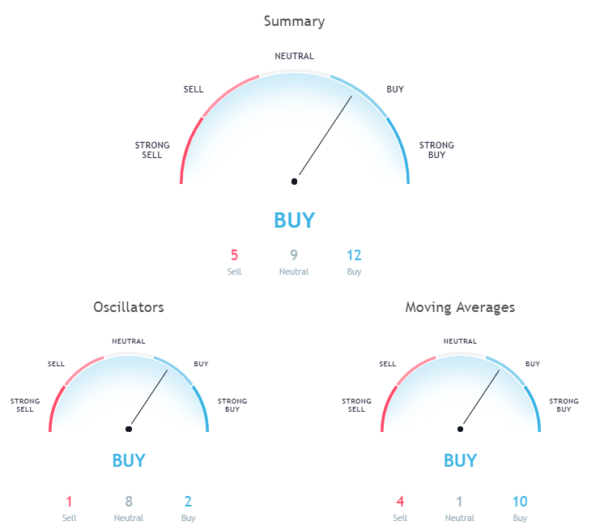
Daily chart signals a buy.

Pivot points

S3 7212.3
S2 8384.4
S1 9122.8
P 9556.4
R1 10294.8
R2 10728.4
R3 11900.4

ETH/USD

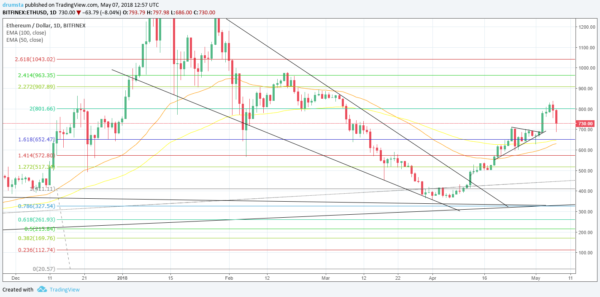
Since last Monday the price of Ethereum has increased by 5.18% coming from 692$ to 730$ where it is now sitting. Like in the case of Bitcoin the price has increased more, to 837$ on yesterdays close, but dropped significantly in the last 24 hours.

Looking at the daily chart we can see that the price of Ethereum broke out of the triangle on May 3. and went to create higher highs, going slightly above the 2 Fibonacci level, retested it for support, but there was no support there, which made the price go in a downward trajectory.

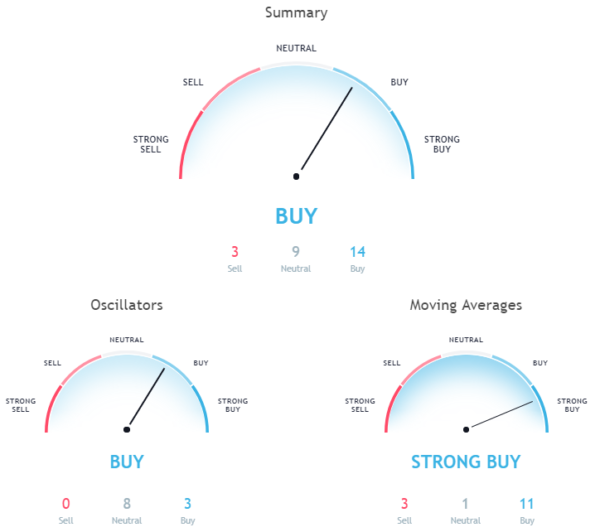
Daily chart signals a buy, moving averages a strong buy.

Pivot points

S3 353.88
S2 556.46
S1 688.07
P 759.04
R1 890.65
R2 961.62
R3 1164.20

XRP/USD

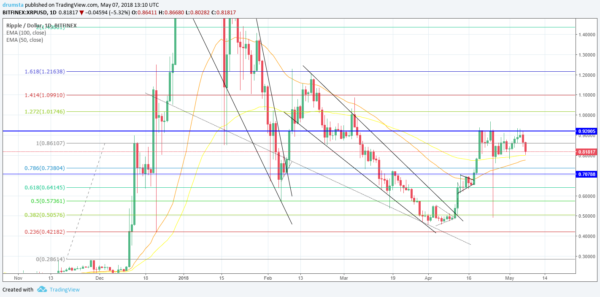
Starting from last Monday, the price of Ripple has decreased by 4,61% from 0.862$ to 0.818$ where it is now sitting.

The price failed to break the key resistance line at 0.92$ and is currently sitting above 100-day EMA from which it bounced. A lot of sideways movement for Ripple this week, between the key resistance 100% Fibonacci level and the 100 EMA.

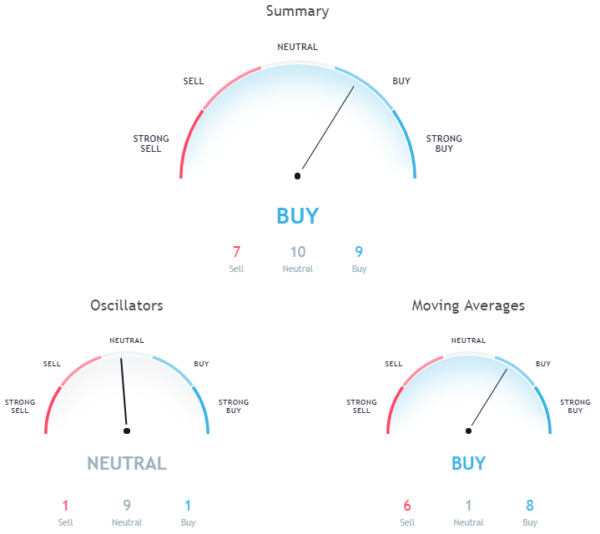
Daily chart overall, signals a buy, however, oscillators are on neutral.

Pivot points

S3 0.56663
S2 0.71933
S1 0.81017
P 0.87203
R1 0.96287
R2 1.02473
R3 1.17743

LTC/USD

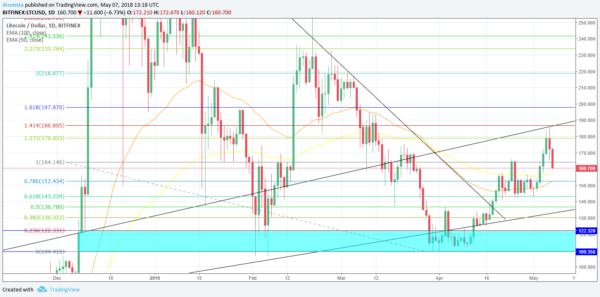
Litecoin’s price has increased by 4,64% from last week’s opening, coming from 154$ to 161$. The highest point of the week was at 182$ on yesterday’s close and the lowest at 142$ on 1. of May. 

As you can see from this daily chart, the price went above the 1,272 Fibonacci level, but it closed below and is currently below 100%, heading toward 100-day EMA, looking for support.

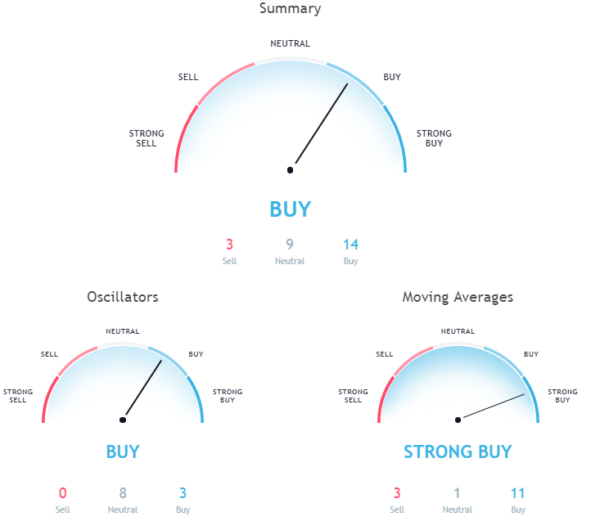
Daily chart signals a buy, overall.

Pivot points

S3 86.403
S2 127.483
S1 153.147
P 168.563
R1 194.227
R2 209.643
R3 250.723

Conclusion

Weekly Crypto Update: After hitting major resistance lines, four of the major cryptocurrencies are experiencing a pullback, like it was predicted in the last week’s forecast.

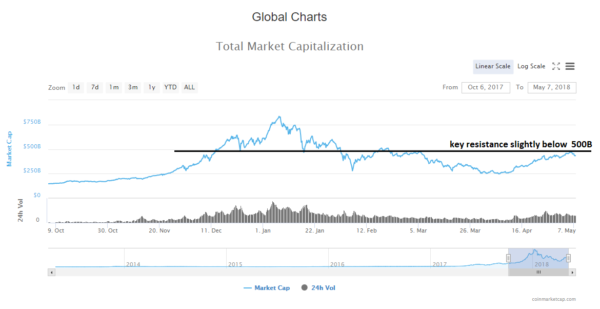
Those key resistance’s are correlated with the resistance on the global chart as you can see above.

We are currently seeing a correction, after a runup that lasted from April 9.
Check out the substitutionary video for the forecast for the upcoming week.

©Forex.Academy