General overview
Weekly Crypto Update: At the start of the week, on Monday, April 30. Cryptocurrency market capitalization was around 430B. On the next day, it dropped by 30 billion dollars and has on the rise all the way to 472,272,000,000$ at the highest point on yesterdays open. Since then the evaluation dropped again to 433B where it is now sitting, slightly above the starting point.

Analysis
BTC/USD
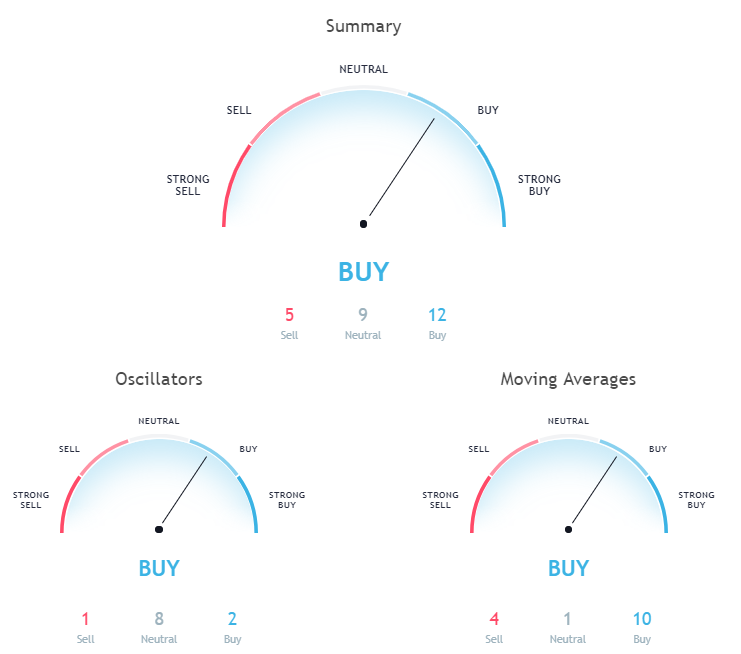
From the opening price on Monday, April 30. The price of Bitcoin hasn’t changed much. It is approximately at the same levels, experiencing only a 0.8% decrease from 9396$ to 9322$ where it is now sitting. However, the price experienced new highs, coming to slightly below 10k to 9952$ to be exact on yesterday’s close, but has decreased significantly in the last 24 hours.

Looking at the daily chart we can see that the price broke out of the triangle in which it was consolidating, and went above 0.618 Fibonacci level, retested it for support, but the level didn’t hold. The price is significantly above the 100-day EMA which is a good sign.
Daily chart signals a buy.
Pivot points
S3 7212.3
S2 8384.4
S1 9122.8
P 9556.4
R1 10294.8
R2 10728.4
R3 11900.4
ETH/USD
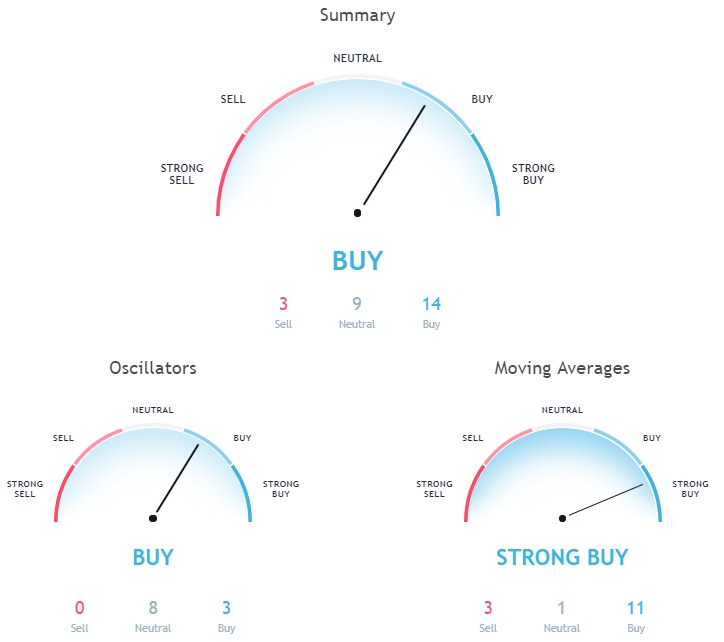
Since last Monday the price of Ethereum has increased by 5.18% coming from 692$ to 730$ where it is now sitting. Like in the case of Bitcoin the price has increased more, to 837$ on yesterdays close, but dropped significantly in the last 24 hours.

Looking at the daily chart we can see that the price of Ethereum broke out of the triangle on May 3. and went to create higher highs, going slightly above the 2 Fibonacci level, retested it for support, but there was no support there, which made the price go in a downward trajectory.
Daily chart signals a buy, moving averages a strong buy.
Pivot points
S3 353.88
S2 556.46
S1 688.07
P 759.04
R1 890.65
R2 961.62
R3 1164.20
XRP/USD
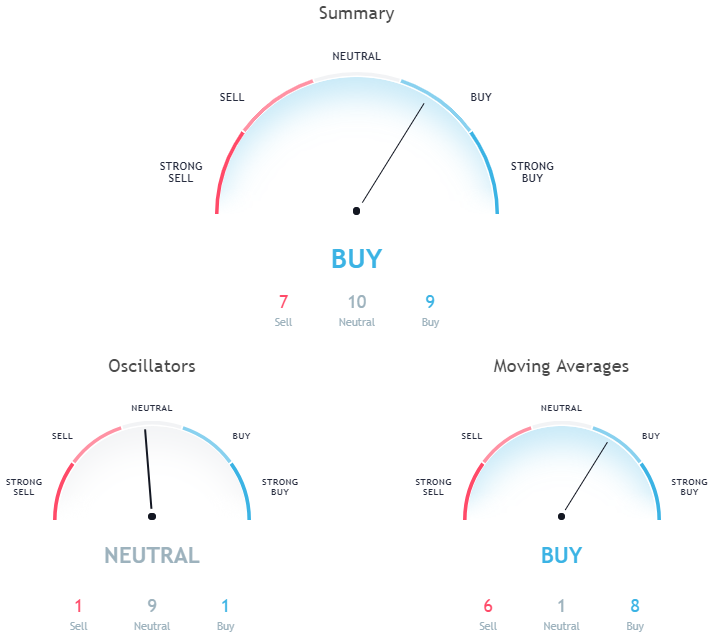
Starting from last Monday, the price of Ripple has decreased by 4,61% from 0.862$ to 0.818$ where it is now sitting.
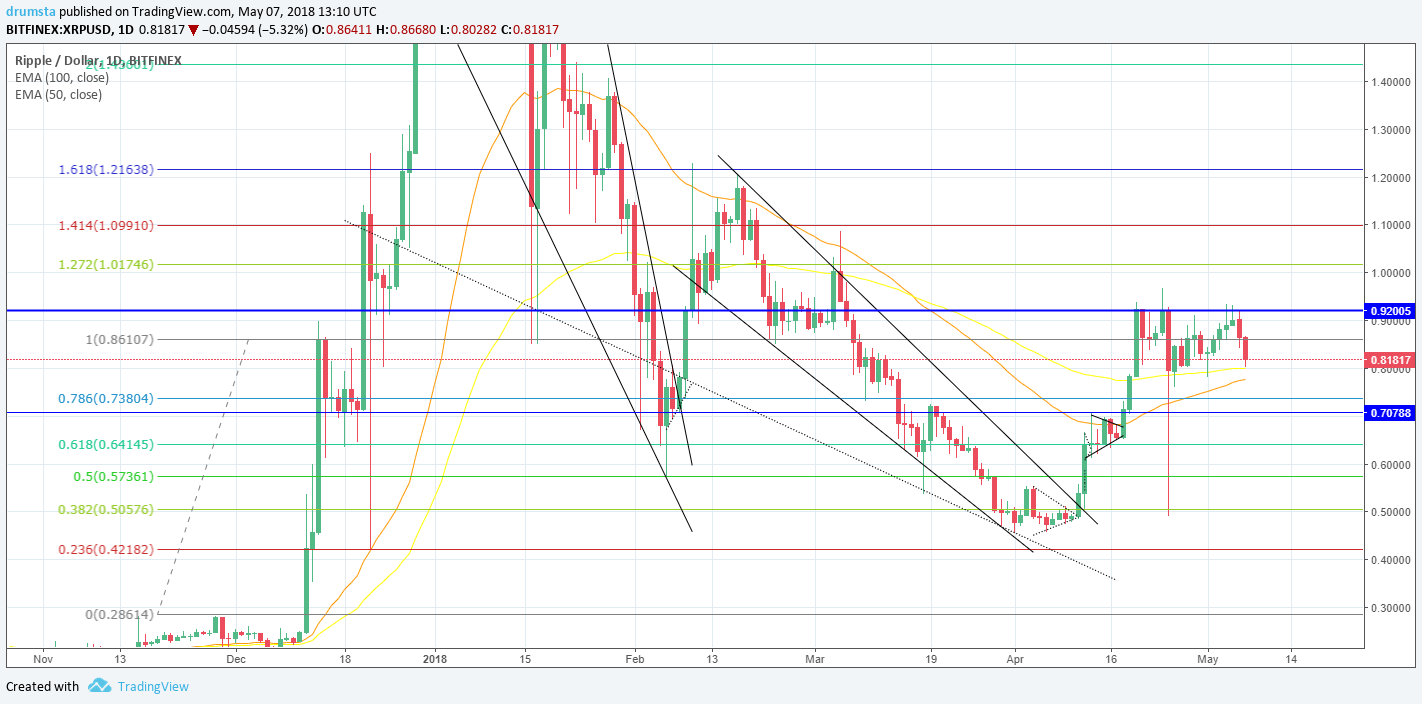
The price failed to break the key resistance line at 0.92$ and is currently sitting above 100-day EMA from which it bounced. A lot of sideways movement for Ripple this week, between the key resistance 100% Fibonacci level and the 100 EMA.
Daily chart overall, signals a buy, however, oscillators are on neutral.
Pivot points
S3 0.56663
S2 0.71933
S1 0.81017
P 0.87203
R1 0.96287
R2 1.02473
R3 1.17743
LTC/USD
Litecoin’s price has increased by 4,64% from last week’s opening, coming from 154$ to 161$. The highest point of the week was at 182$ on yesterday’s close and the lowest at 142$ on 1. of May. 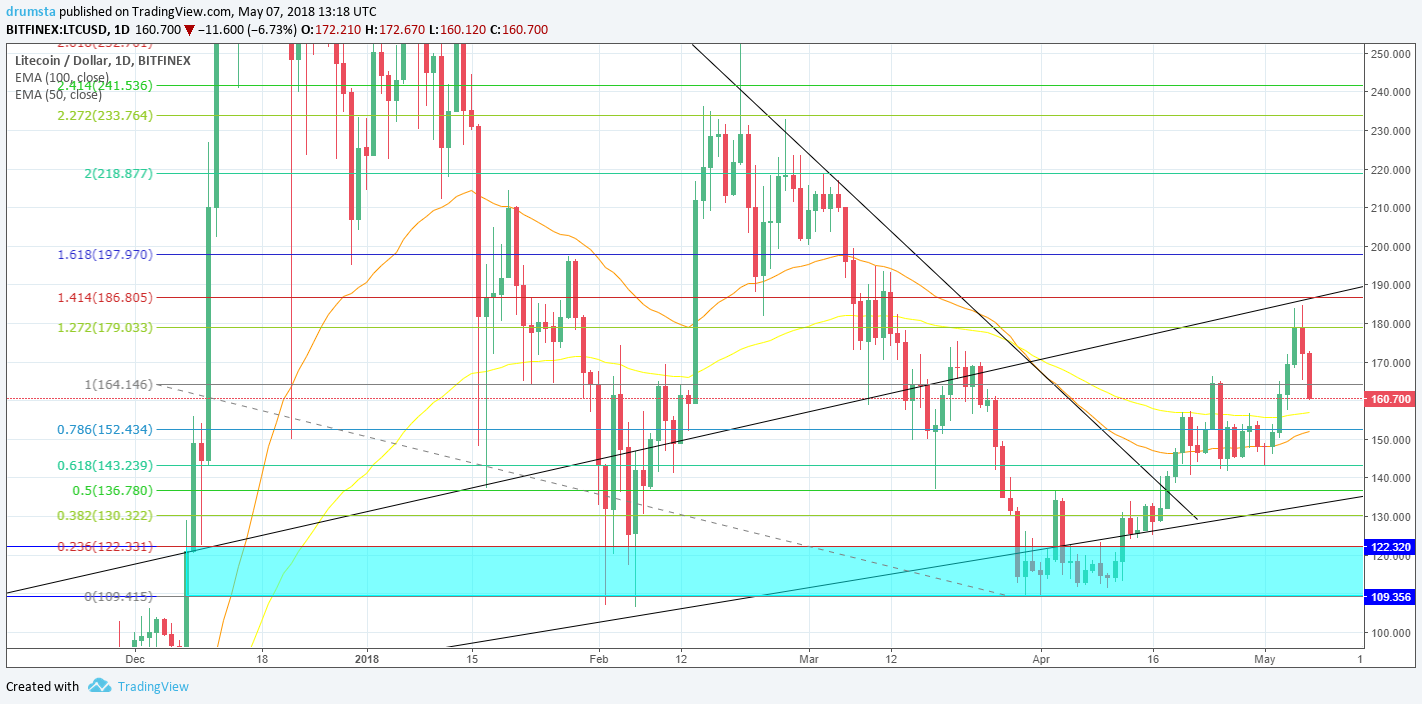
As you can see from this daily chart, the price went above the 1,272 Fibonacci level, but it closed below and is currently below 100%, heading toward 100-day EMA, looking for support.
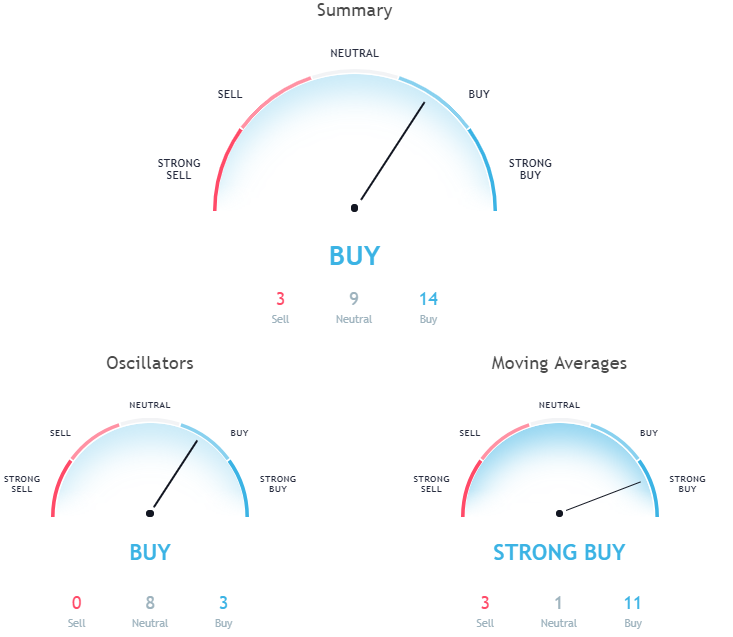
Daily chart signals a buy, overall.
Pivot points
S3 86.403
S2 127.483
S1 153.147
P 168.563
R1 194.227
R2 209.643
R3 250.723
Conclusion
Weekly Crypto Update: After hitting major resistance lines, four of the major cryptocurrencies are experiencing a pullback, like it was predicted in the last week’s forecast.
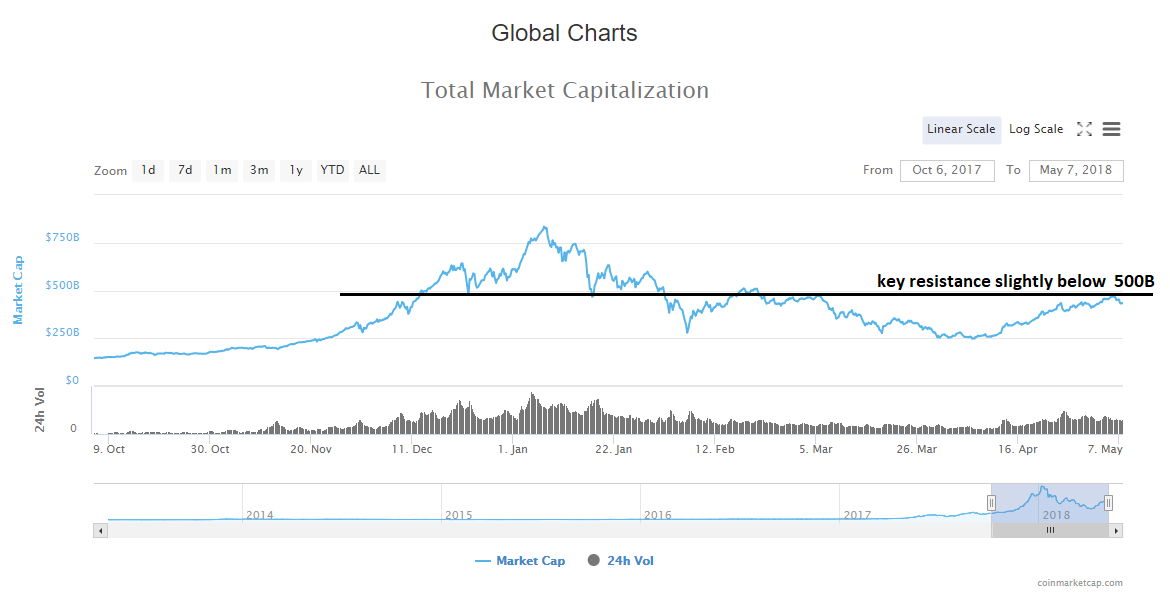
Those key resistance’s are correlated with the resistance on the global chart as you can see above.
We are currently seeing a correction, after a runup that lasted from April 9.
Check out the substitutionary video for the forecast for the upcoming week.
©Forex.Academy