News commentary
In the last FOMC meeting, we can conclude that the FED intends to have a gradual rate hike followed by June & August.
It also mentioned the word “symmetrical” twice in the statement referring that it will be necessary to sustain the inflation at its target level at 2%
“Our great financial team is in China trying to negotiate a level playing field on trade! I look forward to being with President Xi in the not too distant future. We will always have a good (great) relationship!”. Trump tweeted to calm down the atmosphere in the running trade war.
It’s not expected from the bank of England to increase the rate at its meeting on Thursday according to its previous weak data. Rate hike may be postponed to the next big meeting in August if there’s hawkish sentiment in Thursday speech.
The growth of Eurozone is running slow since the beginning of this year. The ECB will not be anticipating the end of its quantitative easing now. We might not witness any rate hike until 2019
Chart Analysis
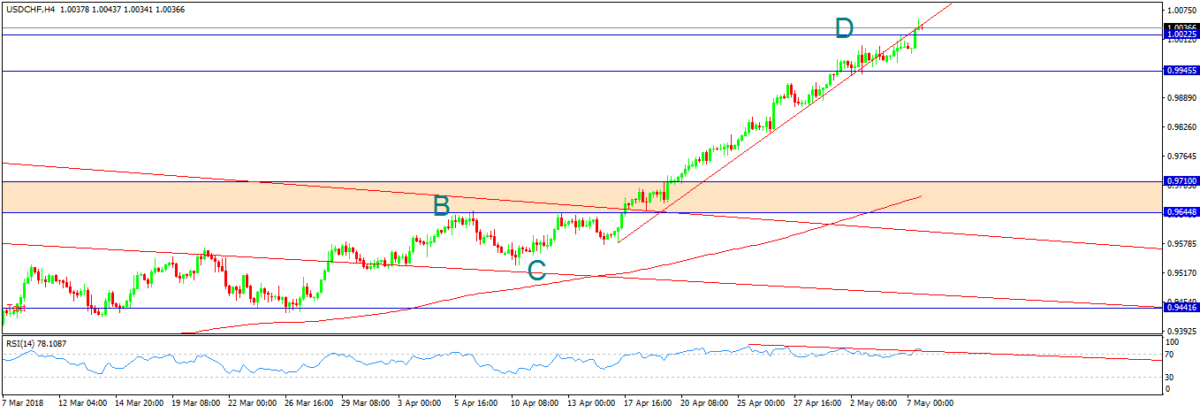
USD/CHF
On the 4-hour chart, we can see that the price has reached a key resistance level at 1.002
With breaking the lower trend line and divergence on RSI, A harmonic pattern is produced to enhance the reversal movement, followed by a pin bar; the price is expected to go down to 0.9815
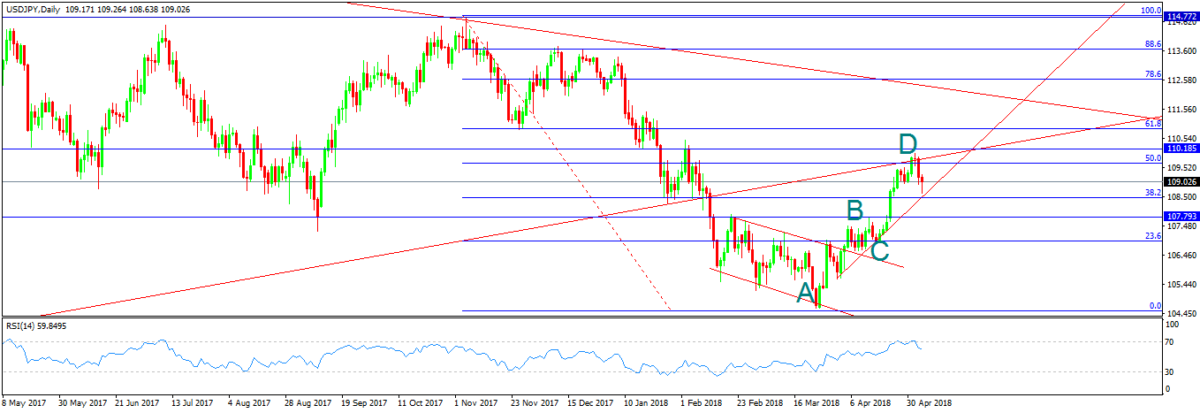
USD/JPY
On the daily chart, the price bounced from the resistance 110 which is the same level of 50% Fibonacci level. The price had reversed from a broken upward trend line from the low of 2011 with the 200-day moving average. The pair confirmed the bearish bias after forming a harmonic pattern (AB=CD). With pin bar and engulfing candle, besides overbought on RSI. If the price could break the uptrend line from the low of 2018, we can see 107.5 level
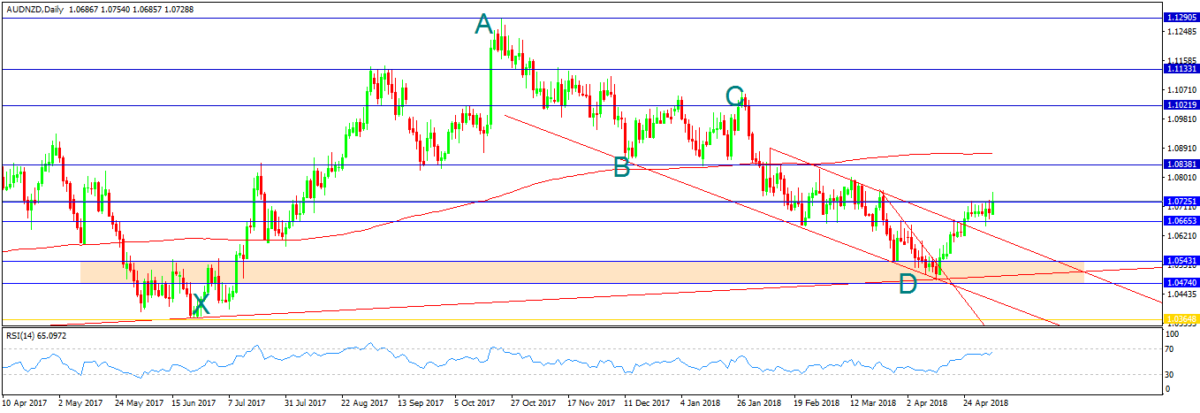
AUD/NZD
On the daily chart, the price moved according to our analysis before bouncing from the support zone 1.0475-1.0545. Breaking also a descending trend line followed by a break of the descending channel. The price has formed four dojis above the key level 1.0645. The harmonic pattern improves the chance of a bullish continuation. Therefore, the price is assumed to visit 1.084.
©Forex.Academy