Categories
Forex Course

157. What Expectations Do Forex Market Have On The Financial News?

Introduction

Economic releases and news are essential for traders who make trading decisions based on fundamental analysis. Economic news is publicly available as soon as it releases. Therefore, traders can access it from any internet connection enabled device. As economic releases directly affect the currency market, traders must understand how to use it.

Types of Economic News

There are three types of economic news for the currency market- low impact, medium impact, and high impact. Among these types, the high impact news is essential as it immediately impacts a currency pair. Some example of high impact economic news is-

  • Interest rate decision
  • Inflation report
  • Retail Sales
  • PMI
  • GDP
  • Export and Import
  • Foreign Currency Reserve

Besides, the high impact news, medium, and low impact news often create a good movement in the market, which is not very frequent. Therefore, we should stick to high and medium impact news only.

How Economic News Affect the Currency Pair?

There are three significant elements of the economic news that a trader should consider while doing analysis. They are:

  • Previous Release- Previous data is the most recent release used to compare with the current data.
  • Expectation- Before releasing every news, analysts project the data. If the news comes better than expected, it will be shown in green and indicate a positive effect on the currency.
  • Current Release- It is the most important part as trading decisions depend on it. The current release is the data that usually release on a particular day.

Let’s have a look at how to read the news:

  • The current release is better than the Previous release- Good for the currency
  • The current release is better than the expectation- good for the currency
  • The current release is worse than the previous release- bad for the currency
  • The current release is worse than the expectation- bad for the currency.

Image Source: www.forexfactory.com

In the above image’s marked area, we can see that the US monthly retail sales came at 1.2%, where the previous data was 8.4%, and the expectation was 2%. As the news massively declined from 8.4% to 1.2%, the US Dollar became weaker than the Euro as indicated in the image below:

Conclusion

As of the above discussion, we can say that better than expected and previous data may positively impact the currency, and weaker than expected data will negatively impact a currency. However, we should consider the overall fundamental outlook of a country to take the ultimate trading decision.

[wp_quiz id=”86431″]
Categories
Forex Fundamental Analysis

The Impact Of ‘Money Supply’ Fundamental Indicator On the Forex Price Charts

Introduction

Inflation plays an undeniable role in influencing the fiscal and monetary policies implemented within an economy. These policies’ role is to either mop up money from the economy or inject more money into the economy. Primarily, the rate of inflation tends to fluctuate depending on the amount of money in circulation. When the money in circulation is high, so is the rate of inflation, and when it’s low, the rate of inflation lowers. For this reason, the money supply statistics are vital and can be used as a leading indicator of inflation.

Understanding Money Supply

The money supply is the totality of the cash in circulation within an economy, bank deposits, and other liquid assets that can quickly be converted to cash. Note that the money supply is measured over a specific period, and it excludes any form of a physical asset that must be sold to convert to cash, lines of credit, and credit cards.

There are three commonly used measures of the money supply in an economy. They are M1, M2, and M3.

M1 Money Supply

This measure of money involves the entirety of the cash in circulation, i.e., the amount of money held by the public. This measure includes travelers’ checks, checkable deposits, and demand deposits with commercial banks. The money held by central banks and depository vaults is excluded from this measure. The M1 money supply is also known as the narrow measure of the money supply and can be referred to as the M0 money supply in other countries.

Source: St. Louis FRED

M2 Money Supply

This measure of the money supply is the intermediate measure. It includes the M1 money supply as well as time deposits in commercial banks, savings deposits, and the balance in the retail money market funds.

Source: St. Louis FRED

M3 Money Supply

This measure of the money supply is broad. It includes the M2 money supply as well as larger time deposits depending on the country, shorter-term repurchase agreements, institutional money market funds’ balance, and larger liquid assets. Note that this measure of money mainly focuses on the money within an economy used as a store of value.

Source: St. Louis FRED

Monetary Base

As a measure of money supply, the monetary base measures the entirety of the money in circulation and those held by the central banks as deposits by the commercial banks.

How to use Money Supply in Analysis

As we noted earlier, both fiscal and monetary policies are influenced by the economy’s money supply. For companies and households, the analysis of money supply not only helps predict the interest rates but also to determine business cycles, expected changes in the price levels and inflation.

Money supply in an economy can be used to analyze and identify seasonal business cycles. When the economy is going through a period of recovery and expansion to the peak, the economy’s money supply will increase steadily. During recovery, there is an increase in aggregate demand, unemployment levels reduce, and households’ welfare improves. At this point, the money supply in the economy begins to increase. The supply rapidly increases during the expansion cycle than during recovery. At the peak, the money supply in the economy stagnates, and the increase is lower than the previous two stages.

Similarly, the money supply begins to drop when the economy is going through a recession to depression. These periods are characterized by a decrease in the GDP levels signaling a shrinking economy, accompanied by higher unemployment levels and diminished aggregate demand in the economy.

Furthermore, an increase in money supply in an economy leads to lower interest rates, which means that businesses and households can invest more in the economy. More so, increased money supply stimulates increased demand by consumers, which leads to increased production and demand for labor. The rise in aggregate demand is followed by increased aggregate supply, which leads to economic expansion and growth of consumer discretionary industries.

Impact on Currency

The most notable impact of the money supply is inflation. Inflation is the increase in the prices of goods and services over time.

When the money supply is increasing, it shows that households have more money to spend, which increases the aggregate demand. Since the supply doesn’t change at the same pace as demand, the resulting scenario is an increase in the prices of goods and services. In most countries, the central banks have a target rate of inflation.

Therefore, when inflation is increasing, the central banks will employ deflationary monetary policies, such as increasing interest rates. The deflationary policies are designed to increase the cost of money and discourage consumption. Therefore, in the forex market, an increase in money supply can be seen as a signal of a future hike in the interest rates, which makes the local currency appreciate relative to others.

Conversely, a decrease in the money supply signals an economic recession, loss of jobs, and a shrinking economy. For governments, preventing economic recessions is paramount. Thus, a constant decrease in the money supply will trigger the implementation of expansionary fiscal policies. The fiscal policies can be accompanied by expansionary monetary policies by the central banks. These policies aim to spur economic growth and are negative for the currency. Therefore, a decrease in the money supply implies a possible interest rate cut in the future, which makes the local currency depreciate relative to others.

Sources of Data

In the US, the Federal Reserve publishes the money supply data and releases it monthly in the Money Stock Measures – H.6 Release. An in-depth review of the US’s total money supply can be accessed at St. Louis FRED, along with the historical data on M1 money supply, M2 money supply, and M3 money supply. Trading Economics publishes data on global M1 money supply, global M2 money supply, and global M3 money supply. In the EU, the data on the money supply can be accessed from the European Central Bank.

How the Money Supply Data Release Affects Forex Price Charts

The most recent release of the EU’s money supply data was on September 25, 2020, at 8.00 AM GMT and can be accessed at Investing.com.

The screengrab below is of the monthly M3 money supply from Investing.com. To the right is a clear legend that indicates the impact level of the FI has on the EUR.

As can be seen, this low volatility is expected upon the release of the M3 money supply data.

In August 2020, the M3 money supply in Europe grew by 9.5% compared to the 10.1% increase in July. The August increase was lower than analysts’ expectations of 10.2%.

Now, let’s see how this release made an impact on the Forex price charts.

EUR/USD: Before the M3 Money Supply Data Release on September 25, 2020, 
Just Before 8.00 AM GMT

Before the publication of the M3 money supply, the EUR/USD pair was trading in a subdued uptrend. Candles were forming just above a slightly rising 20-period MA.

EUR/USD: After the M3 Money Supply Data Release on September 25, 2020, 
at 8.00 AM GMT

The pair formed a 5-minute bearish candle after the release of the data. Subsequently, the pair adopted a strong downtrend as the 20-period MA fell steeply with candles forming further below it.

Bottom Line

The money supply data is generally expected to a mild impact on the forex price action. For this release, however, the worse than expected data was more pronounced in the markets. This effect could be attributed to the fact that the markets expected that the ECB’s pandemic stimulus program would have a visible impact on the money supply.

Categories
Forex Fundamental Analysis

Everything You Should Know About ‘Reserve Assets’ As A Macro Economic Indicator

Introduction

In the current age of globalization and increasing international trade, every country strives to have a favorable balance of payment and a stable currency in the international market. As is with any other market, a currency’s exchange rate is majorly determined by the forces of demand and supply. For stability of its exchange rate, a country might opt to purchase its currencies from the international market to reduce its supply, using its reserve assets.

Understanding Reserve Assets

In finance, reserve assets refer to foreign currencies held and controlled by a country’s central bank. The central banks are mandated to use the reserve currency as they deem fit to benefit the local economy. A reserve currency is supposed to be a universally accepted currency whose value is relatively stable over time. The US dollar is the most preferred reserve currency. Other major currencies include the Euro and GBP.

Purposes of the Reserve Assets

A country’s central bank can use the reserve assets it controls in several ways.

The reserve assets can be used to influence the exchange rate of the local currency against international currencies. Countries can do this whether their exchange rate is fixed or floating. For a fixed exchange rate, a country will peg the exchange rate of its currency against a reserve currency. Pegging the local currency against another one means that the local currency’s value will adjust at the same rate as the other currency.

In this case, when the local government wants to increase its currency value, it uses the reserve assets to buy its currency from the international market. In turn, the demand for the local currency goes up along with its value. The main goal for currency pegging is to remove inflation or changes in the interest rates from impacting the trade between two economies.

Source: St. Louis FRED

For countries whose exchange rate is floating, the central banks use the reserve assets to adjust their currencies relative to that of the reserve currency. If a country wants to weaken its currency to make its exports competitive in the international market, it will sell its currency to buy reserve assets. Conversely, if it wants to increase its currency value, it will use the reserve assets to purchase its currency from the international market.

Another function of the is to shore up the economy in case of natural or human-made disasters. In such disasters, economic activities in the country may be crippled, which significantly lowers the exports. Consequently, the foreign exchange earned in the international market. The central banks use the reserve assets to ensure there is enough liquidity of foreign currency for importation.

Furthermore, in such disasters, investors may flee the country by withdrawing from the local banks. The resultant shortage of foreign currency will reduce the value of the local currency. The central banks can use the reserve assets to buy the local currency to prevent over-inflation and keep the local currency stable.

The country’s reserve assets are also used to meet its financial obligations, such as debt repayment. When a country borrows from the international markets, the interest payments are usually demanded to be paid in the reserve currency. Debtors prefer the reserve currency since it guarantees them that their cash flow is protected from rapid inflation. Therefore, having adequate reserve assets gives investors and creditors confidence that their capital is protected.

Using the reserve assets data for analysis

There is a minimum limit of reserve assets that a country is recommended to hold. This minimum threshold is meant to ensure that in case of any economic shocks, the country can fund essential imports in the short term. Furthermore, the minimum reserves should cover all the country’s debt obligations for about a year.

Therefore, when the reserve assets held by a country are dropping, it could indicate that the economy is experiencing shocks, and the central banks have stepped in to mitigate. When these levels are continually dropping, it means that the economic shocks being experienced are not reducing.

Source: St. Louis FRED

Considering that the reserve assets increase when the balance of payments accounts is improving, a drop in the reserve assets signals that a country in exceedingly becoming a net importer. A reduction in the number of exports or a drop in the value of exports results in net imports. Either way, it implies that the country’s living standards have deteriorated, and unemployment is on the rise.

All these factors point towards a shrinking economy. Conversely, a constant increase in reserve assets implies that the country is a net exporter, which could increase the quantity of exports or quality through value addition. These two factors signal a growing economy with possibly improving labor market conditions.

Impact on Currency

Apart from the direct influence of the exchange rate by buying and selling the reserve assets, here are some of the ways changing levels of a country’s reserve assets impact its currency. Higher reserve assets levels show that the country is well prepared to deal with any unforeseen economic shocks. For investors, this is a sign of stability and encourages them to invest in the country, which leads to lower unemployment and economic growth. Thus, increasing levels of reserve assets lead to a currency’s appreciation.

Conversely, a persistent drop in the reserve assets is negative for the currency. Dropping reserve assets is an indicator that the local currency is under pressure, and the central banks are selling reserve assets to stabilize the currency. Similarly, it could mean that exports in the economy have been reducing over time. Both these instances point towards an adversely affected economy.

Sources of Data

In the US, the data on reserve assets is published monthly by the US Federal Reserve Board, while in the EU, it is published by the European Central BankThe IMF publishes data on global reserve assets balances.

How Reserve Assets Data Release Affects Forex Price Charts

The most recent release of the EU’s reserve assets data was on September 15, 2020, at 10.00 AM GMT. The release can be accessed at Investing.com. The screengrab below is of the monthly reserve assets from Investing.com. To the right is a legend that indicates the level of impact the FI has on the EUR.

As can be seen, this low volatility is expected upon the release of the reserve assets data.

In August 2020, the EU’s total reserve assets were 915.08 billion compared to 923.07 billion in July 2020.

EUR/USD: Before the Reserve Assets Data Release on September 15, 2020, 
Just Before 10.00 AM GMT

Before the publication of the reserve assets data by the ECB, the EUR/USD pair was trading in a neutral trend. The 20-period MA was flattening with candles forming just around it.

EUR/USD: After the Reserve Assets Data Release on September 15, 2020, 
at 10.00 AM GMT

After the news release, the pair formed a 5-minute “Doji” candle. Subsequently, the pair adopted a bullish trend with candles crossing and forming above the rising 20-period MA.

Bottom Line

The total reserve assets that a country holds is a crucial indicator of its economic health and balance of payments condition. But as can be seen in the above analyses, this indicator has no significant impact on the forex price action. We hope you found this article informative. Let us know if you have any questions in the comments below. Cheers!

Categories
Forex Fundamental Analysis

Everything About ‘Harmonized Consumer Prices’ Macro Economic Indicator

Introduction

Harmonized Index of Consumer Prices (HICP) is the go-to indicator for monitoring inflation statistics in the European Union (EU). Inflation reports are vital for the currency markets, as inflation directly erodes currency value. Hence, domestically and internationally, inflation statistics play equally critical roles in currency valuations. Understanding HICP is mandatory for building fundamental analysis related to the European Union countries.

What are Harmonized Consumer Prices?

Harmonized Index of Consumer Prices (HICP)

It is a list of the final price paid by European end-consumer for a basket of commonly used goods and services. Like the United States has the Consumer Price Index (CPI) as a means of regularly measuring inflation levels month over month, the European Union (EU) has HICP. The average change in the price of the selected goods and services gives us a clear idea about the inflation rates in the EU.

The HICP differs from United States CPI because it takes inflation data from each member nation of the European Central Bank (ECB). It is also a weighted index, meaning that goods are given a specific weightage based on demand, or how essential and frequently used by the consumers. The consumer goods basket is derived from data of both rural and urban areas of each member nation.

How can the Harmonized CP numbers be used for analysis?

The Harmonized Index of Consumer Prices (HICP) is measured and given by each of the European Union (EU) member states. European Union is a political and economic union of 27 states located primarily in Europe. It is given out to measure inflation and help the European Central Bank (ECB) to form monetary policies accordingly if required. Every member country’s HICP measures the shifts over time in the prices of the basket of selected goods and services purchased, used, or paid for by households of that nation.

The “commonly used goods and services” include coffee, meat, tobacco, fruits, household appliances, electricity, clothing, pharmaceuticals, cars, and other commonly used products. It is also worth mentioning that the index excludes owner-occupied housing costs.

The HICP is also used for the Monetary Union Index of Consumer Prices (MUICP), an aggregate measure of consumer inflation for all countries of the eurozone. The eurozone represents all countries of the European Union that have incorporated the Eurodollar as their national currency. The primary aim of HICP is to maintain price stability. It defines the stable inflation rate in the euro area as below two percent annually.

Amongst HICP and MUICP, the HICP is a broader measure of inflation, but for trading, traders would prefer MUICP as it tells about the inflation concerning the European Dollar (EUR). The MUICP is calculated by selecting HICP from the eurozone countries only. All the member nations use the same methodology to calculate their respective HICP, enabling them to compare with each other and easily calculate the MUICP directly.

The selected goods and services are updated annually to account for the changes in consumer spending patterns. Each country’s weightage represents its consumption expenditure share in the entire euro area.

Inflation is the fuel that drives the economy. It is a double-edged sword, too much inflation erodes currency value, and citizens become poorer, and too low causes deflation, which slows the economy making money “costly.” A low and steady inflation rate is the only solution to keep the economy growing for capitalist economies.

When inflation rates fall below the long-term averages, the central authorities may use fiscal (government actions, ex: tax cuts) or monetary levers (central bank actions, ex: lower interest rates) to counter deflation and induce inflation. When the inflation rate is above the long-term rate, it is called hyperinflation, and central authorities may intervene and tighten the belt to deflate the economy. They can raise interest rates, increase taxes to deflate the economy to normal levels.

Inflation statistics like the HICP are coincident indicators as they tell us about the current price inflation. They are affected by leading indicators and policymaker’s responses. The HICP is closely watched by economists, central authorities, consumers, and even traders. In the currency markets, relative inflation can help us predict which currency’s value is eroding relatively faster. Inflation also affects the GDP of the country, which is a primary macroeconomic indicator for currency trading.

Impact on Currency

Currency markets emphasize on leading indicators over coincident indicators to always stay a step ahead of market trends. Coincident indicators confirm the trends rather than predict. Due to this, the impact of the HICP indicator in the market is low. For currency traders, MUICP and currency-specific aggregates are more useful than aggregate metrics like HICP to check inflation. Hence, overall, HICP is a low impact coincident indicator that can be overlooked for more country-specific inflation statistics.

Economic Reports

HICP data is published by Eurostat every month. It is the statistical office of the European Union. A brief estimate for the euro is published at the end of the month, followed by the detailed version containing indices of all member states approximately two weeks later. On the Eurostat page, we can find monthly, annual data, a detailed listing of country weights, item weights, prices, etc.

Sources of Harmonized Consumer Prices

We can know more about HICP in detail from the European Central Bank’s official website and the official data on the Eurostat page. We can find the consolidated monthly reports of HICP on Trading Economics.

Harmonized Consumer Prices – Effect on Price Charts

The Harmonized Index of Consumer Prices (HICP) is a coincident indicator. In essence, this indicator does not predict the future price action of currency but is coincident with it. Typically, metrics such as MUICP and other price reports induce volatility in the market. But HICP alone does not increase the volatility of the market.

Impact

The data is exclusive to the European Union and is released by the Federal Statistical Office. The impact of HICP on the currency market is negligible.

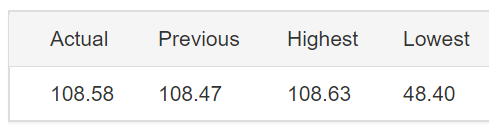
Harmonized Consumer Prices Report June

Below is the report of HICP for the month of June released in July. As per the data, the HICP increased from 108.47 to 108.58.

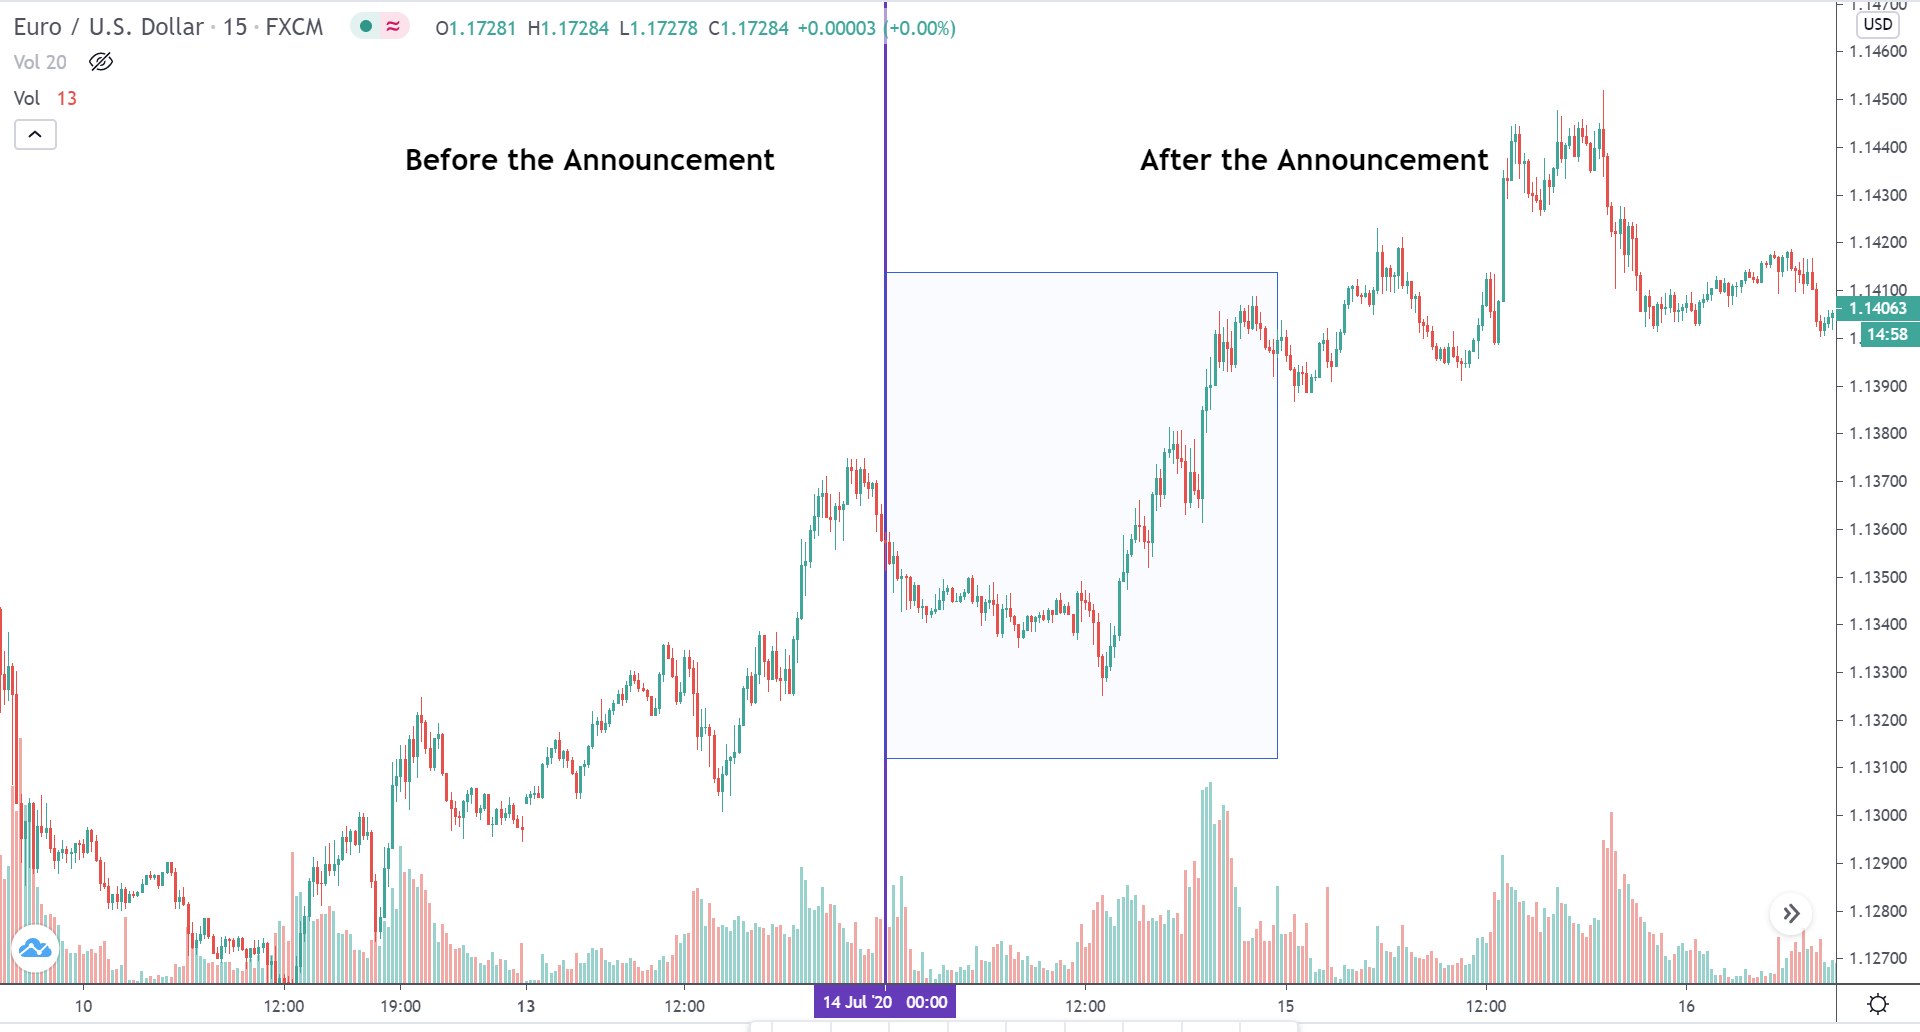
EURUSD – Before the Announcement

Before the announcement of the report, the market was in an uptrend making higher highs and higher lows.

EURUSD – After the Announcement

On the day of the announcement of the report, the prices retraced in the first half of the day and shot north aggressively and made a new higher high during the New York session. On the volumes side, there was feeble volatility in the Asian and European sessions, while it increased with the open of the US markets. That said, the increase in the volatility was not abnormal, which is typically seen during the release of major economic reports.

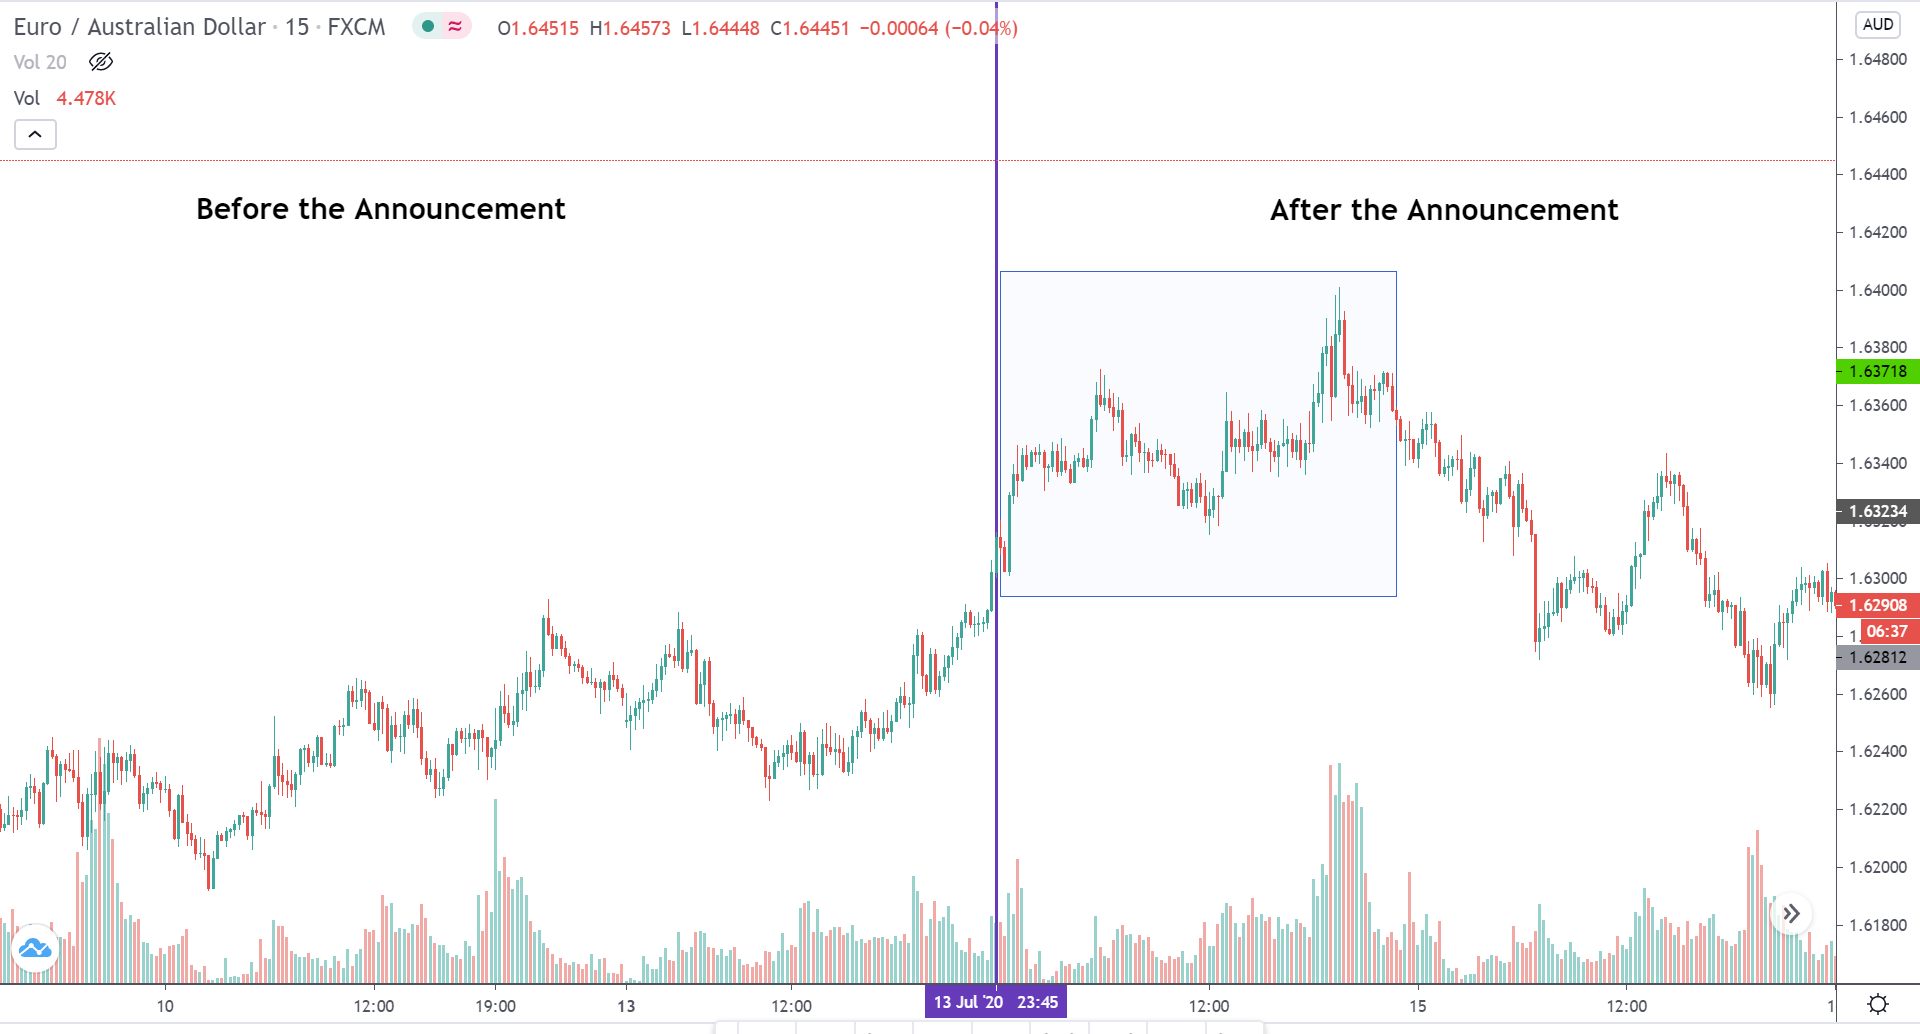
EURAUD – Before the Announcement

Before the report was released, the market was moving in an inclined channel showing EUR strength.

EURAUD – After the Announcement

After the report came out, the price break through the channeling market and began to trend. By the end of the day, the EURAUD price was up 0.65% from the previous day. This bullishness could perhaps be from the incident HICP report. However, the subsequent day, the market lost all its gains.

EURNZD – Before the Announcement

Prior to the announcement of the report, the market which was consolidating had begun to show mild bullishness.

EURNZD – After the Announcement

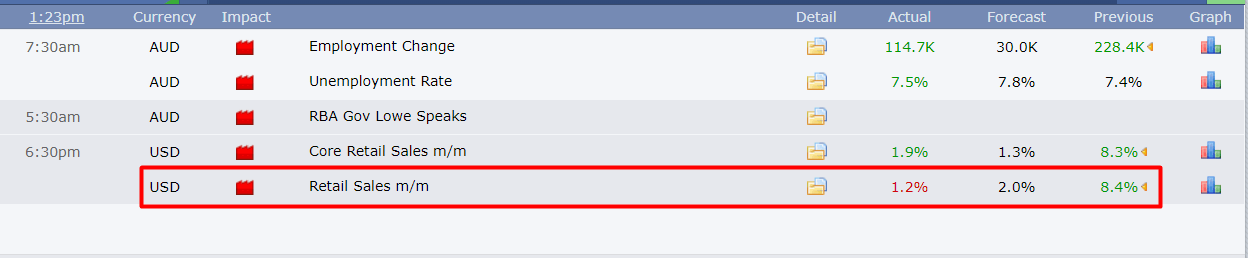
On the day the news was announced, the price continued to rise higher and higher for the entire day. In fact, EURNZD outperformed both EURUSD and EURAUD. There would be several factors that could’ve inflated the price, but a moderate effect could be through the positive HICP news. On the volatility side, there was no aggressive rise in volatility. However, the volume significantly increased during the North American session.

Thus, traders can analyze the technical factors of the market and open positions without any hesitation from the HICP report. That said, conservative traders may wait for the reports to be released, and then enter if the report is in favor of their speculated direction.