Introduction
Producer Price Index PPI, which sounds very similar to the Consumer Price Index CPI is also an equally important indicator. It is widely used as a leading indicator to predict the upcoming CPI and thereby draw economic conclusions accordingly ahead of time. Hence, understanding the Producer Price Index, its history, and the resultant effect it has on the market is significant for traders who trade on Fundamental Analysis.
What is the Producer Price Index?
As the name suggests, the calculation of this index is from the viewpoint of the Producer, i.e., a manufacturer or maker of goods and services. Producer Price Index, in the simplest sense, measures the average of the selling prices of the goods and services at the manufacturing end place. In other words, it is the average of the prices at which the manufacturer sells his products and services to the retailers, who then take it to the local markets and make it available to the general public.
Understanding the difference between what Producer Price Index and Consumer Price Index represent is the key here. Consumer Price Index CPI represents the cost at which goods and services are made available to the general public. Hence, CPI is the measure of average weighed in COST PRICE of finished goods while the Producer Price Index represents the weighted average of SELLING PRICE of the manufactured goods. CPI represents what the end consumer or customer pays, and PPI represents what the manufacturer receives for his commodities.
An item when manufactured and sold from the place where it got manufactured incurs certain costs before it reaches the end consumer. These costs include transportation fees, some specific goods & service taxes, storage costs, etc. Hence, Producer Price is a more rudimentary or cruder form of CPI, and there is an inherent correlation between both. For this reason, PPI is considered an advanced signaling tool to assess CPI and make informed economic decisions by various groups.
How is the Producer Price Index PPI calculated?
The Bureau of Labor Statistics (BLS) surveys almost all industries in the goods manufacturing section and a majority of service sectors. This organization continues to include more and more divisions as time progresses. Producer Price Index of BLS is calculated by first collecting data from all the listed industries by field economists. These people collect data through various means like an onsite visit, phone calls, or even emails, etc.
The producer Price Index uses an altered version of the Laspeyres index. For any given set of goods, it compares the base period revenue to the current period revenue.
Producer Price Index = (∑QoPo(Pi/Po)) / (∑QoPo) ×100
- Qo: Commodity Quantity shipped in the base period
- Po: Commodity Price in the base period
- Pi: Commodity Price in the current period
The above equation tells clearly that based on size & importance, items are weighted. The base price corresponds to 100 for which the base year corresponds to 1982. The PPI is published as a percentage increase or decrease with regards to the previously released number, which may be monthly, quarterly, and annually.
Why is the Producer Price Index important?
CPI measures consumer inflation, and PPI measures business inflation. The significance of the Producer Price Index is many-fold. First are the range and history of the data. The index data set goes way back in time. For example, PPIFGS (Producer Price Index by Commodity for Finished Goods) goes as far back as 1947. With such huge data, the reliability of the data set is high, and it usually depicts the macroeconomic picture of country and industrial health with good confidence.
Also, The PPI program is the oldest continuous series of the Federal Government going back to 1902. Second is the frequency & direct ground-level nature of the statistic meaning this data is a real-time reflection of the current industrial health. Thirdly, PPI is very closely related to CPI in the sense that it is an index of the same goods at an earlier stage of the life cycle.
While CPI shows the stats for a product at the near-end of its transaction life cycle in terms of changing hands, PPI shows the stats at the first transaction life cycle, which is very helpful. In this Index, there are many subcategories, wherein certain goods and services get included or excluded from the basket to give a more accurate picture of the concerning market in absolute or relative terms. For example, PPILFE Producer Price Index Excluding Food & Energy (Core PPI) strips away food, gas, and oil prices from the equation whose prices are volatile and measures the absolute changes.
How can the Producer Price Index be Used for Analysis?
The range of PPI is such that there is something for everyone here. Narrowing down into the PPI, any industry can be analyzed. Broadly there are three most popular classifications:
Industry classification: Here, groupings of commodities are done based on the industry sector they represent. The PPI releases about 535 indexes with more than four thousand specific product lines and product category sub-indexes.
Commodity classification: Here, the grouping of items is done based on the similarity of goods and services in terms of their making.
Commodity-based Final Demand-Intermediate Demand (FD-ID): Here, Based on the consumer group, the commodities are classified and are one of the most used PPI stats.
Due to the diversity in the statistics, different sectors of economists can isolate and use the Producer Price Index for their purposes.
Producer Price Index is a widely used indicator for predicting Consumer Price Index. Manufacturers and Industrialists also use these PPI to adjust pricing on the goods and services they buy and sell to fellow manufacturers to avoid having fixed pricing or unfair price changes during the duration of their business contract, which usually tends to be very long periods.
Sources of Producer Price Index
The U.S. Bureau of Labor Statistics releases all the indexes as mentioned above here
You can also find out the same indexes along with many others with a comprehensive summary and statistics of various categories on the St. Louis Fed website.
Impact of PPI’s news release on the Forex market
After understanding the definition and significance of the Producer Price Index (PPI) in an economy, we shall look at its importance on price charts. For analysis purposes, we have taken the PPI data of Japan, where the survey responses from large Japanese manufactures provide the data for the report. Even though the PPI is a key indicator of the manufacturing sector of the economy, currency traders do not consider it to be the most important indicator of the overall economy. The below image The Business Manufacturing Index (BSI), along with PPI, measures the business sentiment in manufacturing.

The PPI data is released by ‘Bank of Japan’ that measures the change in selling prices of goods purchased by Japanese Corporations. A higher than expected PPI is considered to be positive for the currency and vice versa. The PPI data is released on a monthly, quarterly, and yearly basis, but the highest importance is given to the year-on-year data. The below image shows the latest year-on-year PPI data of Japan that was released in the month of March. As we can see, there is so much variation in the data from ‘previous’ to ‘forecasted to the ‘actual.’ This means, there are many other factors that influence the manufacturing industry that it is difficult to measure for the economists.

EUR/JPY | Before The Announcement
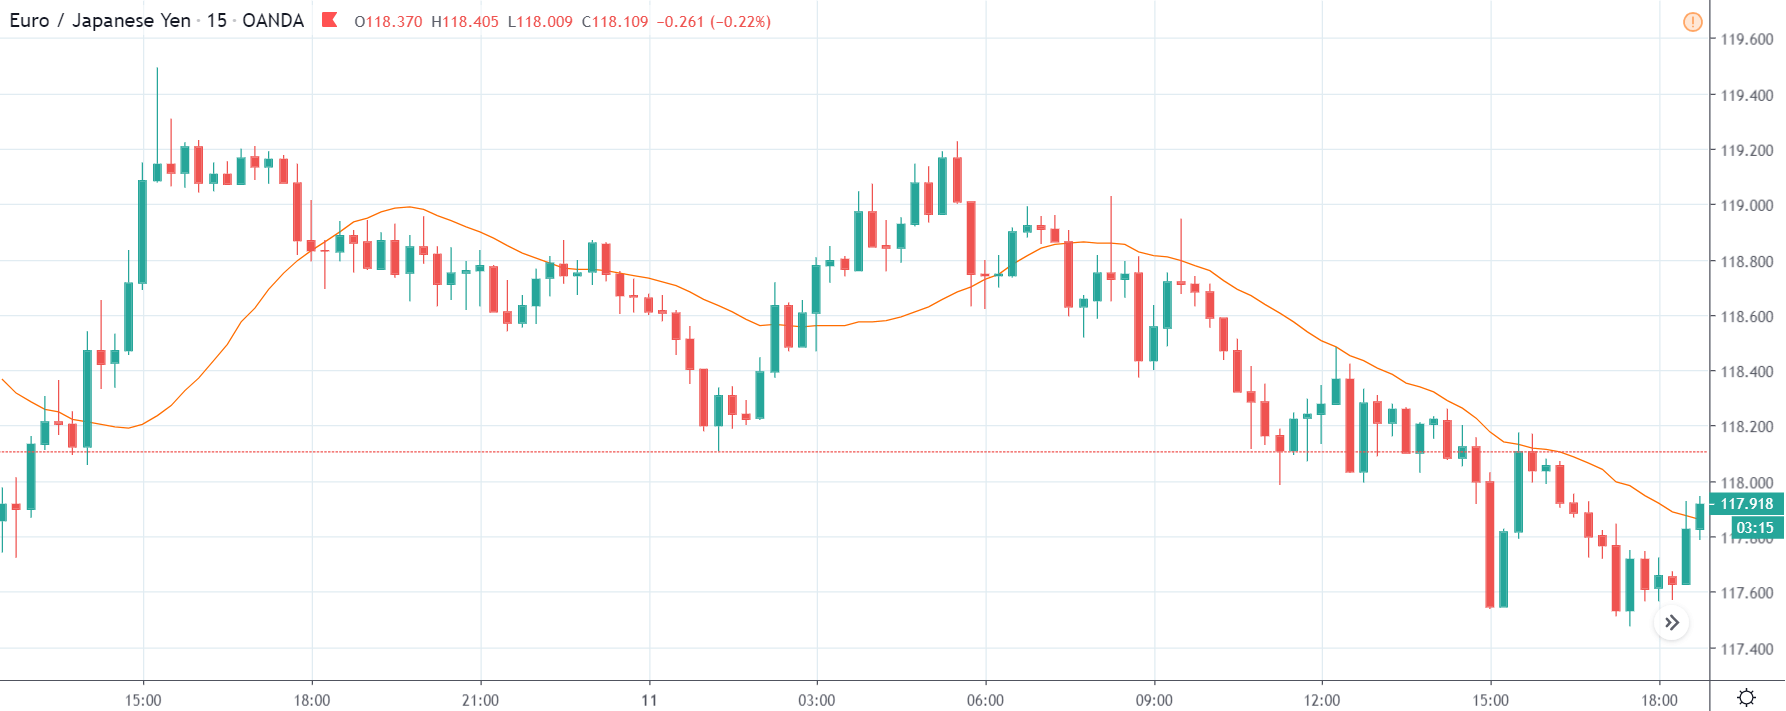
The above chart is that of EUR/JPY, and since the Japanese Yen is on the right-hand side, a down-trending market indicates the strength of the Japanese Yen. The reason behind this downtrend before the news release is because of the bullish expectation of the PPI data from market players. Traders have already forecasted the PPI to be around 1%, which 0.5% lower than the previous reading. Since it is lower, we should expect weakness in the Japanese Yen, but 1% seems to be a good PPI figure for the Japanese economy, hence the downtrend. We need to remember that a higher PPI data is not compulsory to take the currency higher, but rather sometimes the data alone plays importance.
EUR/JPY | After The Announcement
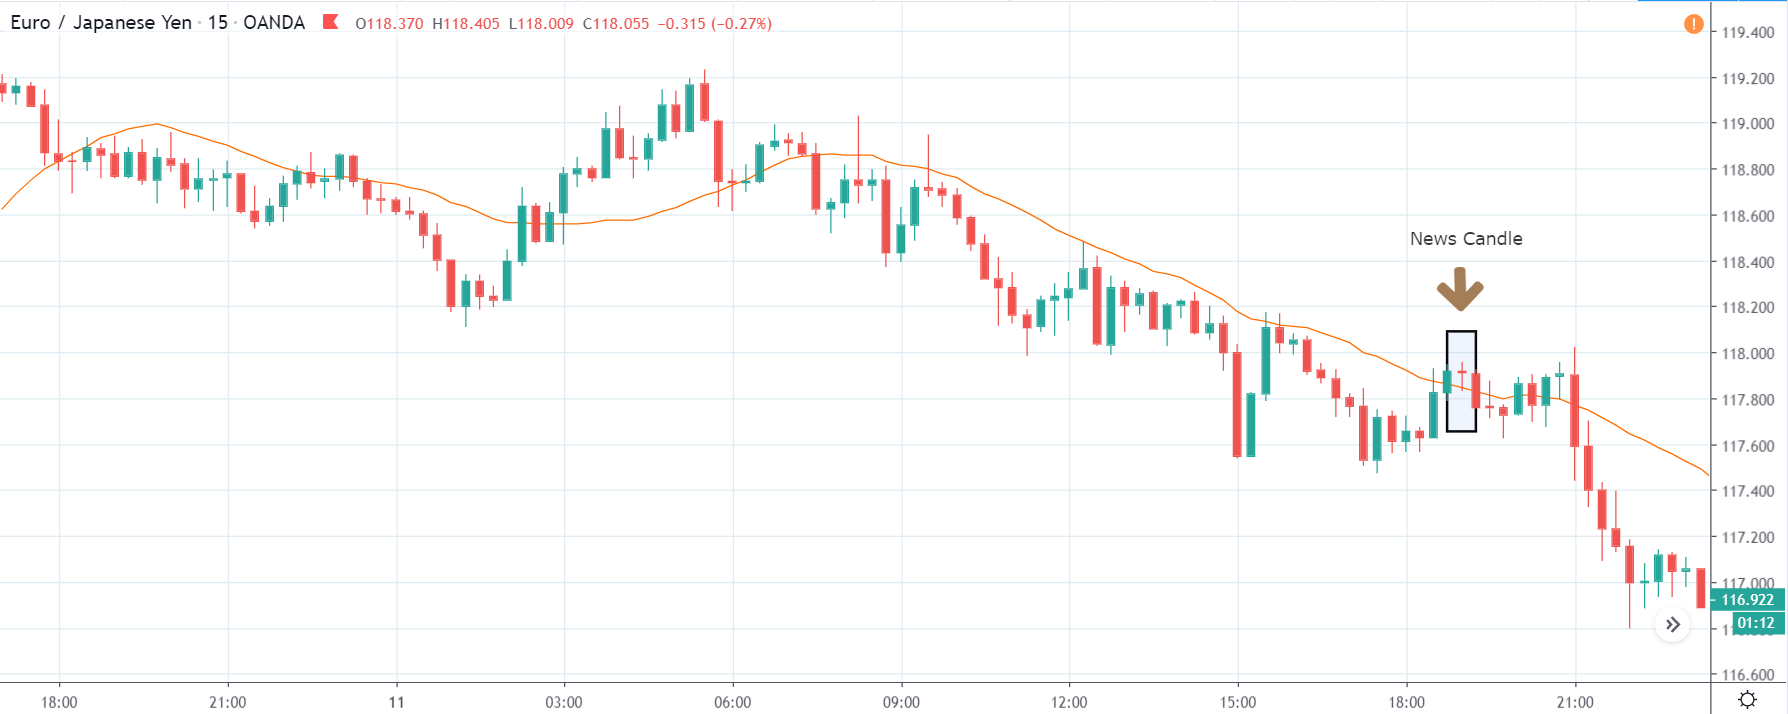
After the PPI numbers are announced, the price barely goes above the moving average line, and there is not much change in the volatility. As the PPI is not an impactful event, the volatility is as expected. A reduction in PPI is bad for the currency, but even though the PPI was reduced, the Japanese yen did not get weak. Therefore, we should just not be paying attention to the news but also use technical analysis to take trades. In this example, we can go long in the market only if we get ‘reversal’ signs, but we don’t see any such patterns. Thus, we should be looking for trend continuation patterns and join the downtrend.
GBP/JPY | Before The Announcement

GBP/JPY | After The Announcement
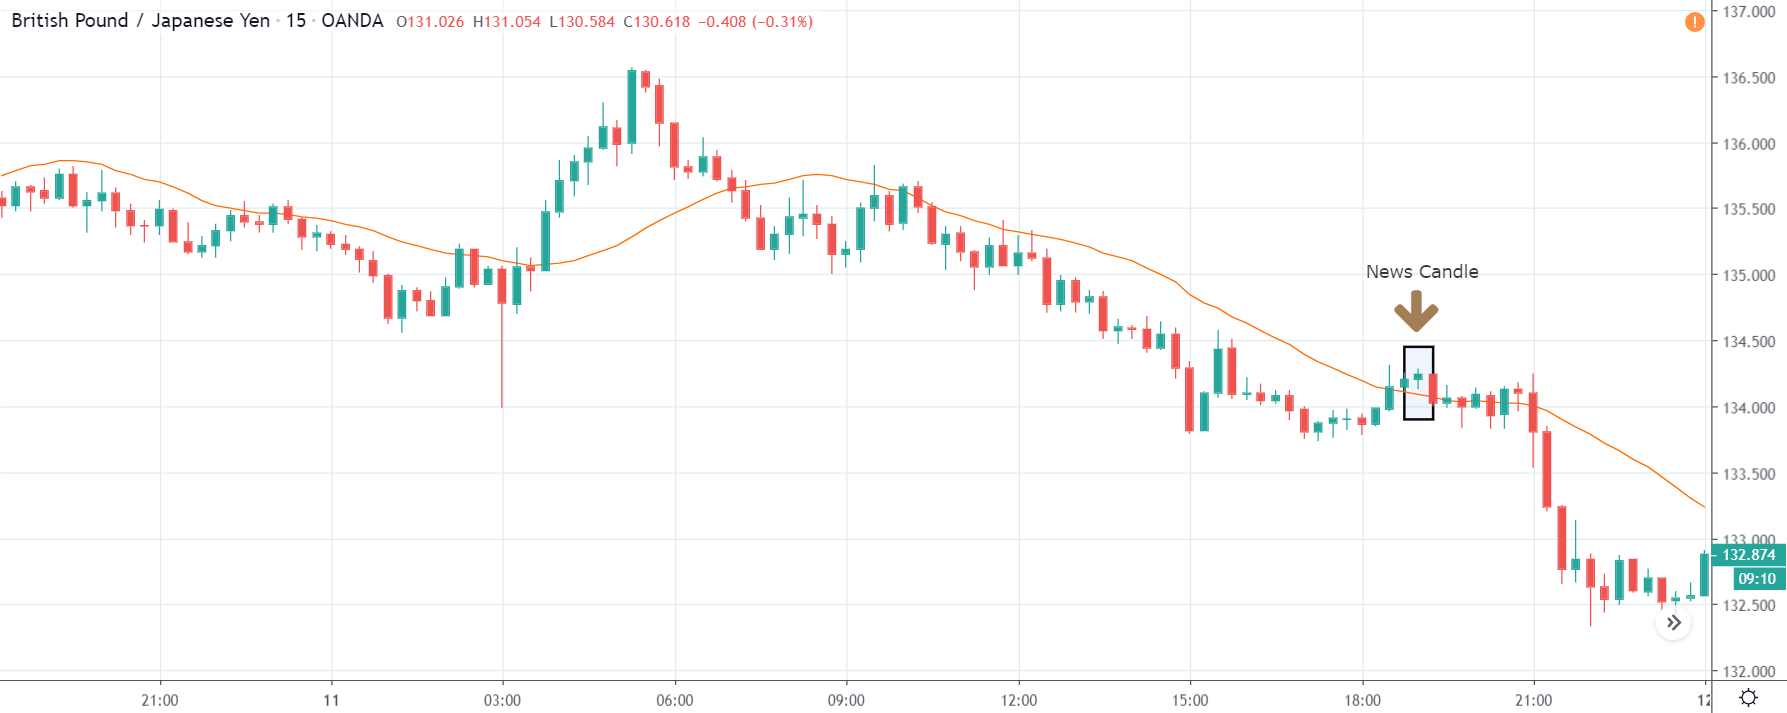
The above image represents the GBP/JPY currency pair, which shows similar characteristics as that of EUR/JPY, where the downtrend is much stronger than the latter. Since the downtrend is prominent, only a much worse PPI than before can take the currency higher. Even if the PPI was very low, the uptrend would not last as it is not an important measurement of the economy. After the news announcement, there is hardly any effect on the currency pair, and the volatility is in the same range. The PPI data was almost the same as that was forecasted by traders, and we can say that it was as per the market expectations. This made the Japanese Yen to strengthen more and downtrend extended on the downside after a bit of consolidation. Once the market slips below the moving average, a ‘short’ trade can be taken with a stop loss above the ‘news candle.’
USD/JPY | Before The Announcement
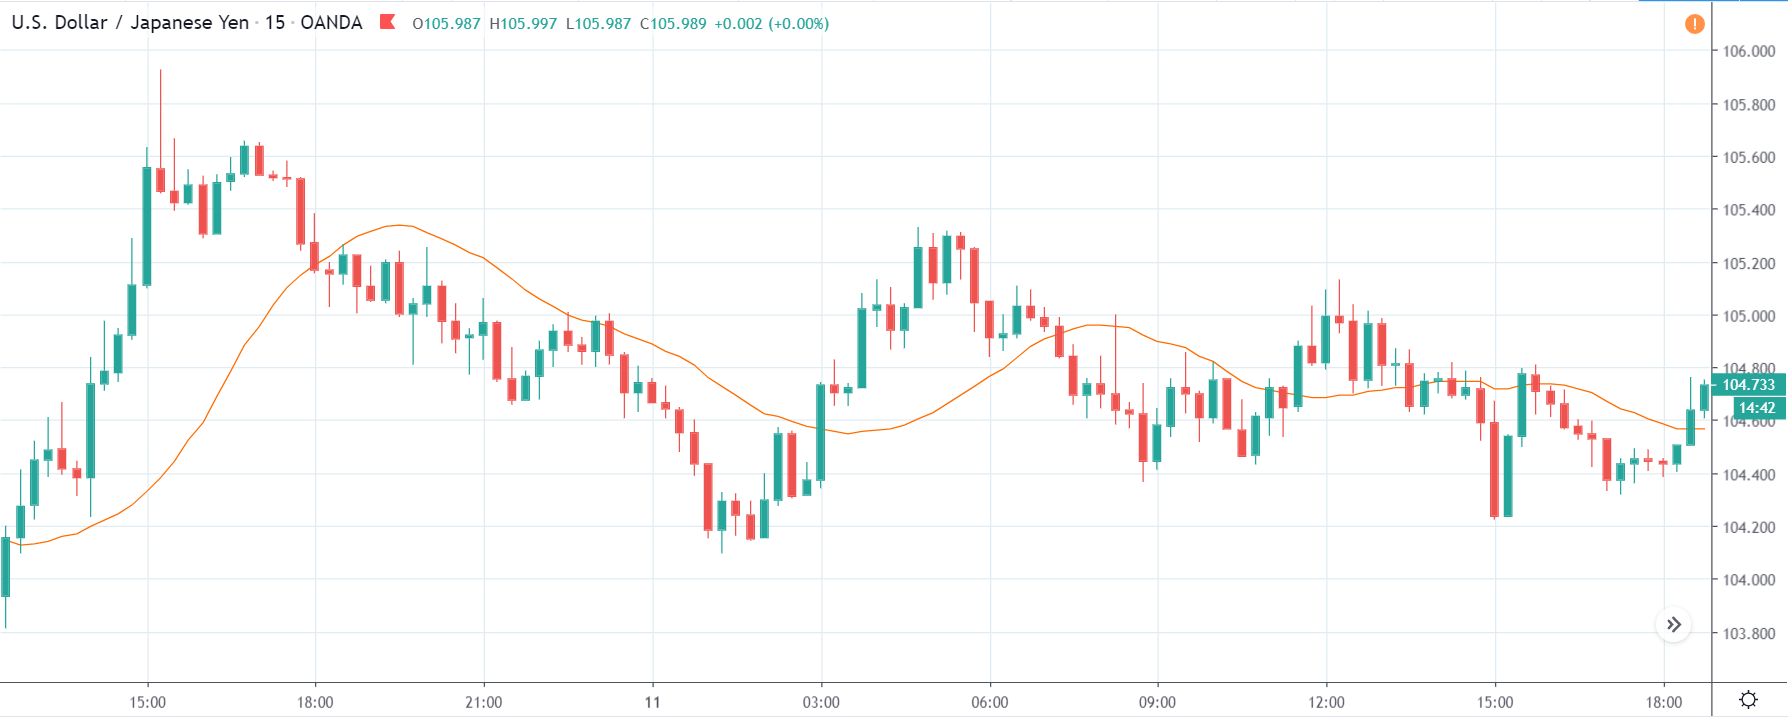
USD/JPY | After The Announcement
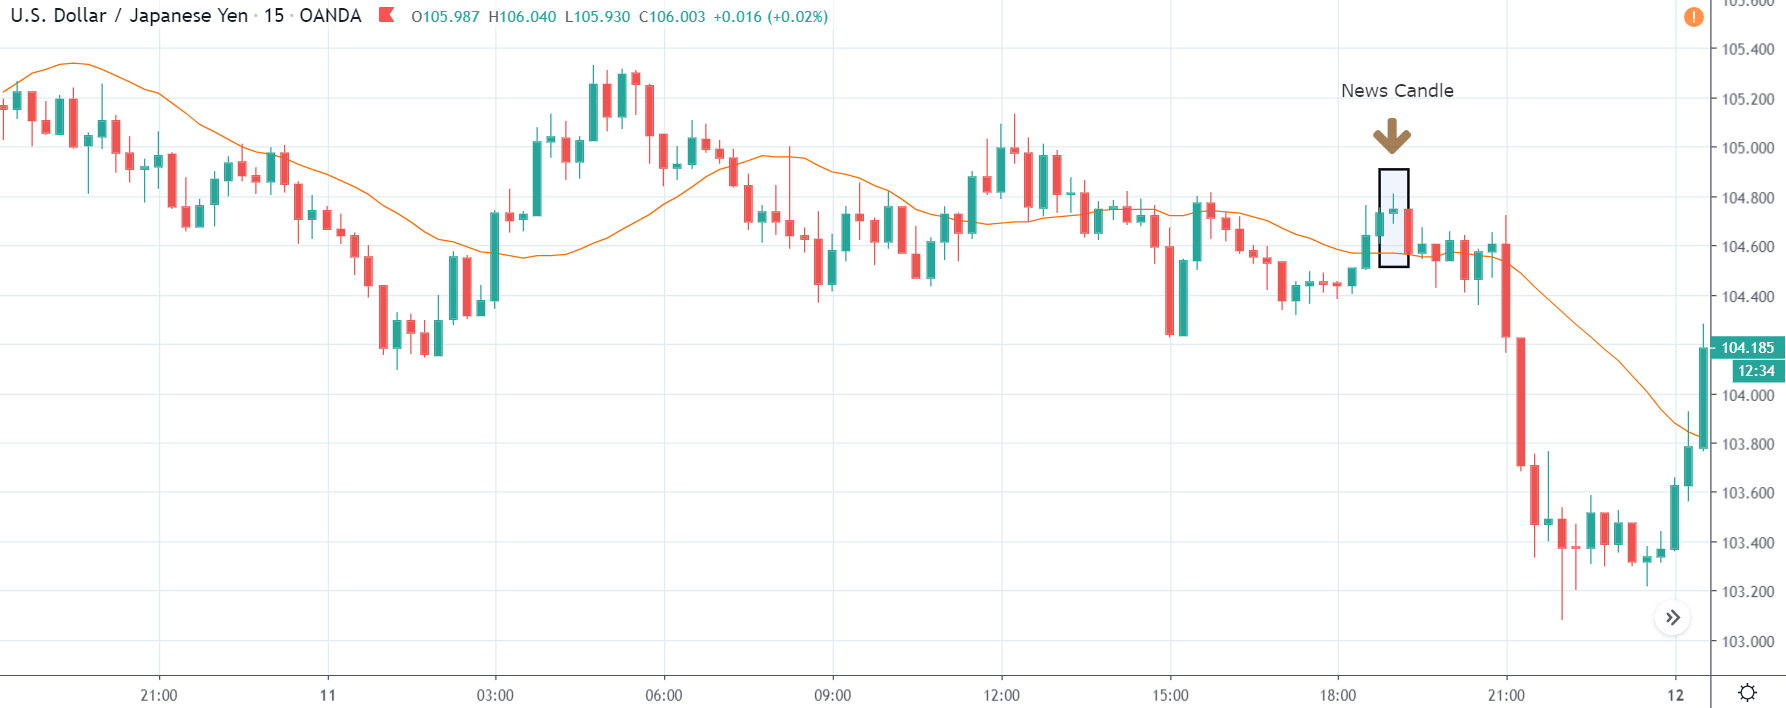
This is the USD/JPY currency pair, where the chart characteristics are a little different than the above two charts. Here we don’t really witness a downtrend but rather a ranging nature of the market. Since we are near the resistance area, any positive news release should be taken as an opportunity to ‘short’ in this pair. This is the way we should combine fundamentals with technical analysis. After the news is released, we don’t see any change in the volatility, and the ‘news candle’ leaves a wick on the top. The PPI data was again positive for the Japanese Yen, where the price crashed right after the ‘news candle.’
That’s about PPI and how the Forex price charts get affected during the news release of this fundamental indicator. Let us know if you have any questions in the comments below. Cheers!