Categories
Forex Fundamental Analysis

Understanding ‘US TIC Net Long-Term Transactions’ Fundamental Forex Driver

Introduction

When foreign investors prefer investing in the domestic economy, they strongly believe that they can get better returns than in any other market. The US is considered the leading economy in the world; therefore, hence US securities are highly trusted by most investors. Similarly, since the USD is the most traded currency in the international market, its value would fluctuate depending on investors’ optimism in the capital and money market of the US.

Understanding US TIC Net Long-Term Transactions

As an economic indicator, the US TIC Net Long-Term Transactions measures the net flow of financial securities in the US economy. The financial securities under consideration include; Treasury and agency securities, corporate bonds, and equities.

Therefore, the ‘net’ in the US TIC Net Long-term Transactions means the difference between US financial securities’ gross purchases and sales by foreign investors. This data provides a vivid overview of the participation of foreigners in the US capital and money markets. When the US TIC net long-term transactions data is positive, it means that more foreigners are buying into the US economy than those selling. Similarly, when the US TIC net long-term transactions data is negative, it means more foreigners are exiting the US economy compared to those buying into the economy.

So, what is TIC? TIC stands for Treasury International Capital, a financial report from the US Department of Treasury. It shows the flow of capital into and out of the US in both the short and long term. The TIC report is published monthly and quarterly; it details the flow of capital explicitly in the sale and purchase of US financial securities.

According to the TIC reports, the classification of foreigners does not necessarily mean individuals and institutions from abroad. Foreigners in this context also include foreign branches of US institutions. For example, if a US bank has a branch in London, that branch is considered a foreigner.

Using US TIC Net Long-Term Transactions in Analysis

The main point of the US TIC Net Long-Term Transactions Report is it shows the demand for USD stocks and investors’ sentiment towards the US economy. Let’s break down the US TIC Net Long-Term Transactions depending on the market.

If the US TIC net long-term transactions, it could signal that the US treasuries and bonds are in high demand. First, you should know why investors would demand more of US treasuries. The US treasuries and bonds are considered to be risk-free. The reason for this is because investors are guaranteed to receive a fixed amount of coupon rate until maturity.

More so, the US treasuries also come with an inherent guarantee that the US government will not default the interest payment and that investors will receive their principal upon maturity. Furthermore, the US’s interest rates are relatively higher than other developed nations; this means that investors in the US government securities stand to profit more by investing in the US.

The level of purchase of the US TIC net long-term transactions also says a lot about the expected inflation. In the long term, most investors worry that if the rate of inflation increases rapidly, it will reduce their profits. Thus, any investor would prefer to invest in a country with stable inflation, which would ensure that their returns are not severely affected.

Therefore, when the US TIC net long-term transactions are positively increasing, it means that foreign investors expect the US economy to be relatively stable over the long term. It is taken as confidence that the Federal Reserve will keep long term inflation in check.
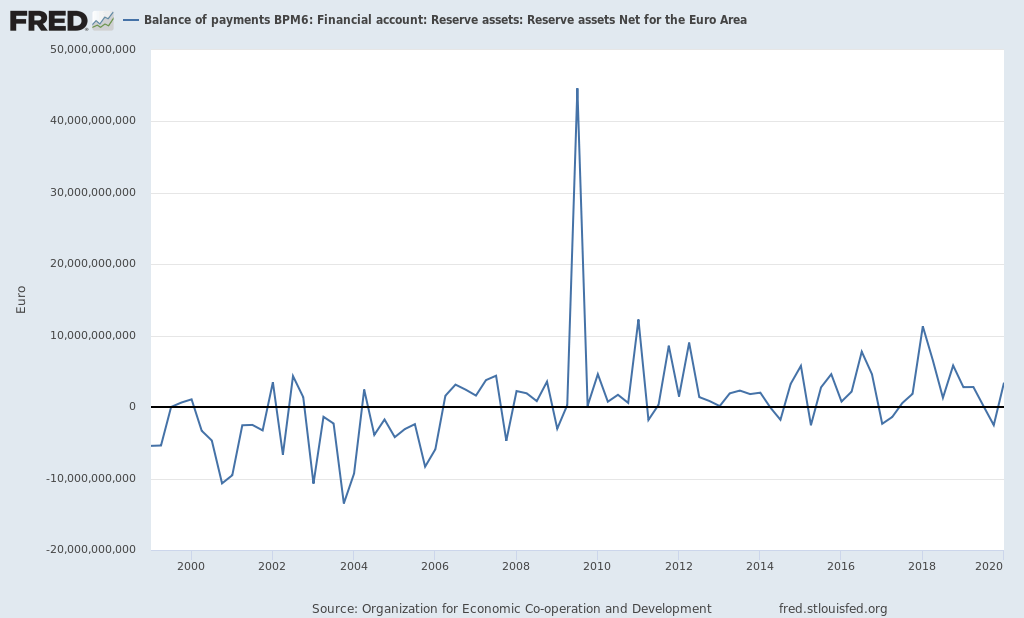
Source: St. Louis FRED

Conversely, if the US TIC net long-term transactions are negative, it implies that there are more sellers than buyers. This scenario could imply that foreign investors believe that the long-term inflation rate will exceed the rate of returns they will receive from their investments. Since their expected real returns will be diminished, they prefer to invest their money in other economies.

The US TIC net long-term transactions can also be used to show impending recessions and optimism about economic recoveries. Let’s use the recent coronavirus pandemic as an example. In the first quarter of 2020, the US TIC net long-term transactions plunged to historic lows. It means that more foreign investors were exiting the US capital and money markets and presumably investing their funds elsewhere. This net outflow was a result of the uncertainty of what the pandemic might bring.

 Source: Trading Economics

In the second quarter of 2020, the US TIC net long-term transactions jumped back to positive territory, implying that foreign investors were pouring back into the US capital and money markets. Note that this net inflow coincides with the passing of the $2 trillion stimulus package. Therefore, we can argue that the net inflow of US TIC net long-term transactions was a vote of confidence by foreign investors that in the long term, the US economy will rebound from the pandemic-induced recession.

Impact of US TIC Net Long-Term Transactions on Currency

The impact of the US TIC net long-term transactions on the USD is pretty straightforward. In the international market, foreigners are obliged to convert their currencies into the USD. Therefore, an increase in the US TIC net long-term transactions means that the demand for the USD increases as well. Consequently, the increase in the demand for the USD makes it appreciate relative to other currencies.

Conversely, when US TIC net long-term transactions show net outflows, the USD will depreciate relative to other currencies. This is because when foreigners sell the US financial securities, they will convert the USD to their domestic currencies when repatriating their money.

Data Sources

The US Department Of The Treasury is responsible for collating and publishing the monthly and quarterly US TIC net long-term transactions. Trading Economics has detailed historical data on the US TIC net long-term transactions.

How US TIC Net Long-Term Transactions Release Affects The Forex Price Charts

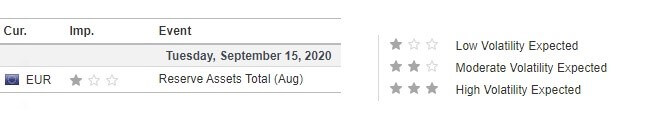
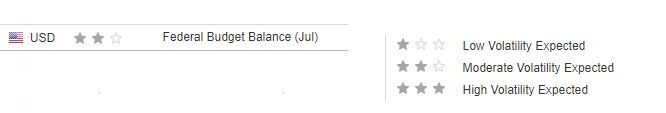
The latest monthly publication of the US TIC net long-term transactions was on October 16, 2020, at 4.00 PM EST. The release can be accessed at Investing.com. Moderate volatility on the USD can be expected when the US TIC net long-term transactions report is released.

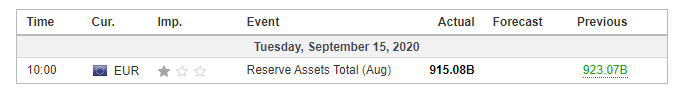
In August 2020, the US TIC net long-term transactions were $27.8 billion compared to $11.3 billion in July 2020. In theory, this increase should be positive for the USD.

Let’s see how this release impacted the GBP/USD pair.

GBP/USD: Before US TIC Net Long-Term Transactions Release on October 16, 2020, 
just before 4.00 PM EST

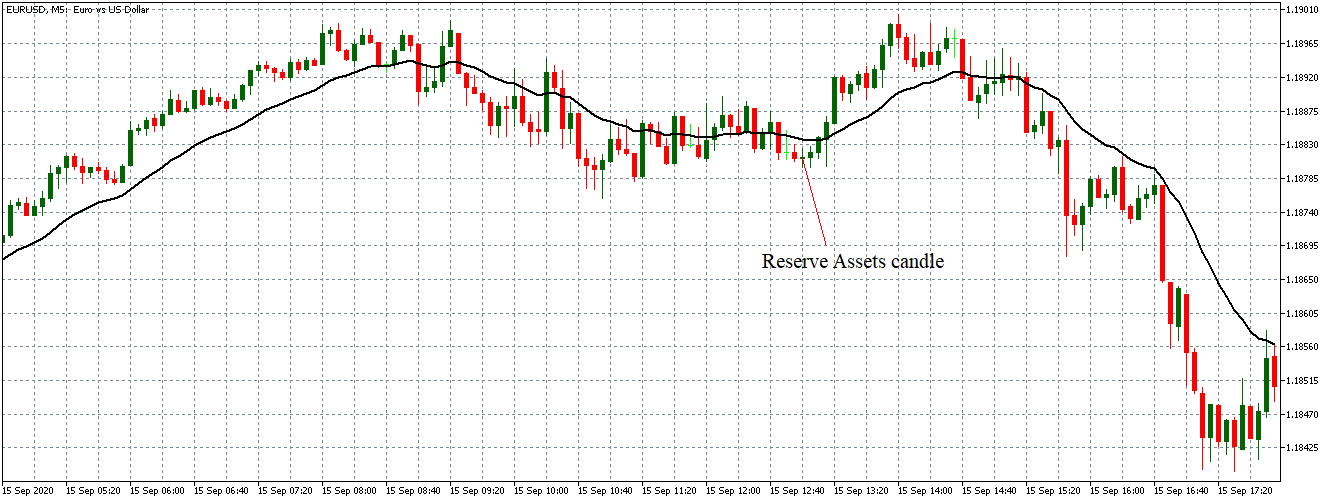
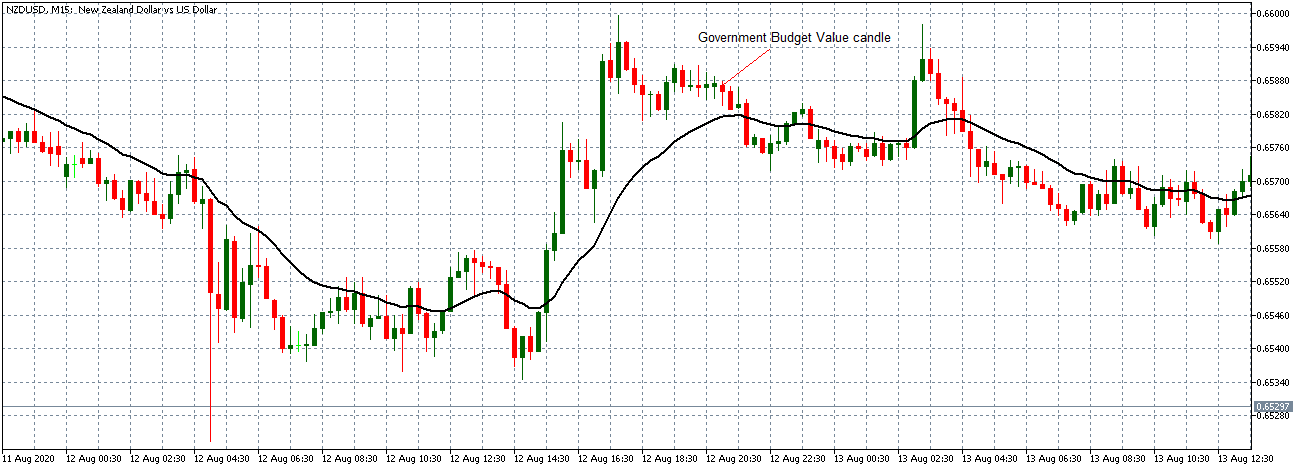
Before the publication of the US TIC net long-term transactions, the GBP/USD pair was trading in a subdued uptrend. The 20-period MA was almost flattened with candles forming just above it.

GBP/USD: After US TIC Net Long-Term Transactions Release on October 16, 2020, 
at 4.00 PM EST

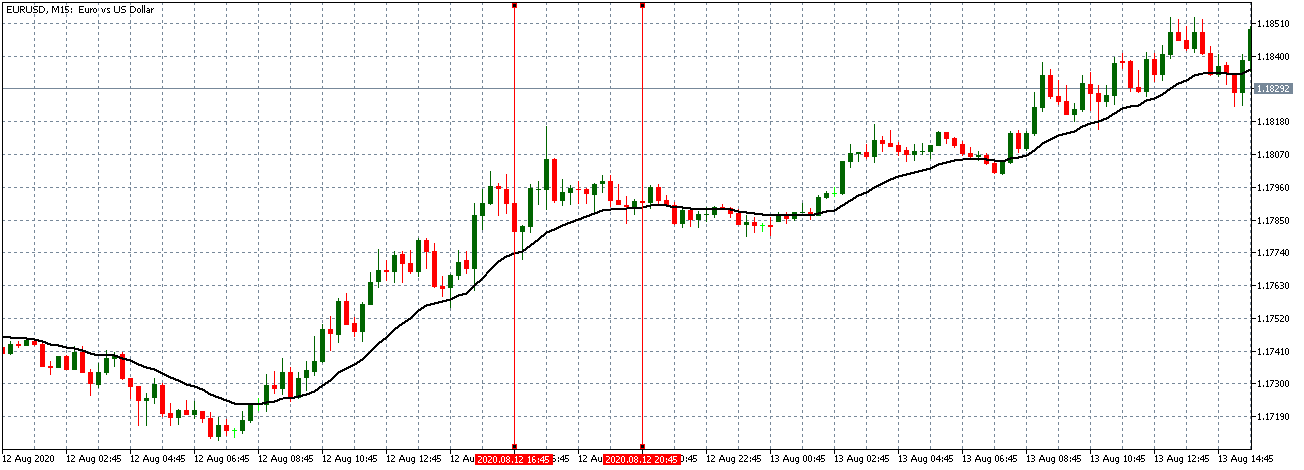
After the publication of the US TIC net long-term transactions, the pair formed a 5-minute bearish candle. Subsequently, GBP/USD adopted a bearish trend showing that the USD significantly strengthened against the GBP. The 20-period MA steeply fell as candles formed further below it.

Bottom Line

From this analysis, it is evident that the US TIC net long-term transactions release has a significant impact on the forex market. The report shows the confidence of investors in the US economy and the demand for the US Dollar.

Categories
Forex Course

165. Knowing More About Trading The Euro & Yen Crosses

Introduction

In cross-currency trading, the Euro and Japanese Yen are the most traded currency. Therefore, after major currencies, EUR and JPY has the highest liquidity in the forex market. Overall, trading in the Euro and Yen crosses are secure compared to the other cross currencies.

Understand the European Economy

When trying to trade in any Euro cross pairs, we should understand the European economy even if we only follow technical analysis. In technical analysis, traders can make decisions based on previous price movements. Therefore, many traders think that there is no need for fundamental analysis.

However, in trading, we aim to increase the probability of our analysis. Therefore, when we add Europe’s economic condition, we will have a better outlook of trading Euro crosses like- EURCHF, EURAUD, EURNZD, etc.

The European economy consists of several countries, including France, Italy, Germany, etc. Therefore, trading in the Euro cross requires to know interest rate decisions, retail sales, employment export-import, GDP, and other economic releases of these countries.

Moreover, in Euro cross trading, we should focus on other currencies that combine with the Euro. For example, if we want to trade in the EURCHF pair, we should focus on Switzerland’s economic condition.

Understand the Japanese Economy

In Yen cross trading, we should have extensive knowledge of the Japanese economy. Japan is an export-oriented country. Therefore, it tries to depreciate its value against other major currencies by keeping the interest rate lower.

Overall, any increase in interest rate, retail sales, employment, and GDP are suitable for the Japanese economy.

Besides the Japanese economy, we need to understand the economic condition of the Japanese Yen combination. For example, trading in the CADJPY pair requires a fundamental analysis of both the Japanese and Canadian economies.

Conclusion

Overall, the Euro and Japanese Yen cross are mostly traded currency in currency crosses. Therefore, to trade Euro and Yen crosses, we should know these two countries’ economic conditions. Even if we don’t trade based on fundamental analysis, having good knowledge is essential to have an overall outlook of the economy. Cheers.

[wp_quiz id=”86515″]
Categories
Forex Fundamental Analysis

Everything You Should Know About ‘Reserve Assets’ As A Macro Economic Indicator

Introduction

In the current age of globalization and increasing international trade, every country strives to have a favorable balance of payment and a stable currency in the international market. As is with any other market, a currency’s exchange rate is majorly determined by the forces of demand and supply. For stability of its exchange rate, a country might opt to purchase its currencies from the international market to reduce its supply, using its reserve assets.

Understanding Reserve Assets

In finance, reserve assets refer to foreign currencies held and controlled by a country’s central bank. The central banks are mandated to use the reserve currency as they deem fit to benefit the local economy. A reserve currency is supposed to be a universally accepted currency whose value is relatively stable over time. The US dollar is the most preferred reserve currency. Other major currencies include the Euro and GBP.

Purposes of the Reserve Assets

A country’s central bank can use the reserve assets it controls in several ways.

The reserve assets can be used to influence the exchange rate of the local currency against international currencies. Countries can do this whether their exchange rate is fixed or floating. For a fixed exchange rate, a country will peg the exchange rate of its currency against a reserve currency. Pegging the local currency against another one means that the local currency’s value will adjust at the same rate as the other currency.

In this case, when the local government wants to increase its currency value, it uses the reserve assets to buy its currency from the international market. In turn, the demand for the local currency goes up along with its value. The main goal for currency pegging is to remove inflation or changes in the interest rates from impacting the trade between two economies.

Source: St. Louis FRED

For countries whose exchange rate is floating, the central banks use the reserve assets to adjust their currencies relative to that of the reserve currency. If a country wants to weaken its currency to make its exports competitive in the international market, it will sell its currency to buy reserve assets. Conversely, if it wants to increase its currency value, it will use the reserve assets to purchase its currency from the international market.

Another function of the is to shore up the economy in case of natural or human-made disasters. In such disasters, economic activities in the country may be crippled, which significantly lowers the exports. Consequently, the foreign exchange earned in the international market. The central banks use the reserve assets to ensure there is enough liquidity of foreign currency for importation.

Furthermore, in such disasters, investors may flee the country by withdrawing from the local banks. The resultant shortage of foreign currency will reduce the value of the local currency. The central banks can use the reserve assets to buy the local currency to prevent over-inflation and keep the local currency stable.

The country’s reserve assets are also used to meet its financial obligations, such as debt repayment. When a country borrows from the international markets, the interest payments are usually demanded to be paid in the reserve currency. Debtors prefer the reserve currency since it guarantees them that their cash flow is protected from rapid inflation. Therefore, having adequate reserve assets gives investors and creditors confidence that their capital is protected.

Using the reserve assets data for analysis

There is a minimum limit of reserve assets that a country is recommended to hold. This minimum threshold is meant to ensure that in case of any economic shocks, the country can fund essential imports in the short term. Furthermore, the minimum reserves should cover all the country’s debt obligations for about a year.

Therefore, when the reserve assets held by a country are dropping, it could indicate that the economy is experiencing shocks, and the central banks have stepped in to mitigate. When these levels are continually dropping, it means that the economic shocks being experienced are not reducing.

Source: St. Louis FRED

Considering that the reserve assets increase when the balance of payments accounts is improving, a drop in the reserve assets signals that a country in exceedingly becoming a net importer. A reduction in the number of exports or a drop in the value of exports results in net imports. Either way, it implies that the country’s living standards have deteriorated, and unemployment is on the rise.

All these factors point towards a shrinking economy. Conversely, a constant increase in reserve assets implies that the country is a net exporter, which could increase the quantity of exports or quality through value addition. These two factors signal a growing economy with possibly improving labor market conditions.

Impact on Currency

Apart from the direct influence of the exchange rate by buying and selling the reserve assets, here are some of the ways changing levels of a country’s reserve assets impact its currency. Higher reserve assets levels show that the country is well prepared to deal with any unforeseen economic shocks. For investors, this is a sign of stability and encourages them to invest in the country, which leads to lower unemployment and economic growth. Thus, increasing levels of reserve assets lead to a currency’s appreciation.

Conversely, a persistent drop in the reserve assets is negative for the currency. Dropping reserve assets is an indicator that the local currency is under pressure, and the central banks are selling reserve assets to stabilize the currency. Similarly, it could mean that exports in the economy have been reducing over time. Both these instances point towards an adversely affected economy.

Sources of Data

In the US, the data on reserve assets is published monthly by the US Federal Reserve Board, while in the EU, it is published by the European Central BankThe IMF publishes data on global reserve assets balances.

How Reserve Assets Data Release Affects Forex Price Charts

The most recent release of the EU’s reserve assets data was on September 15, 2020, at 10.00 AM GMT. The release can be accessed at Investing.com. The screengrab below is of the monthly reserve assets from Investing.com. To the right is a legend that indicates the level of impact the FI has on the EUR.

As can be seen, this low volatility is expected upon the release of the reserve assets data.

In August 2020, the EU’s total reserve assets were 915.08 billion compared to 923.07 billion in July 2020.

EUR/USD: Before the Reserve Assets Data Release on September 15, 2020, 
Just Before 10.00 AM GMT

Before the publication of the reserve assets data by the ECB, the EUR/USD pair was trading in a neutral trend. The 20-period MA was flattening with candles forming just around it.

EUR/USD: After the Reserve Assets Data Release on September 15, 2020, 
at 10.00 AM GMT

After the news release, the pair formed a 5-minute “Doji” candle. Subsequently, the pair adopted a bullish trend with candles crossing and forming above the rising 20-period MA.

Bottom Line

The total reserve assets that a country holds is a crucial indicator of its economic health and balance of payments condition. But as can be seen in the above analyses, this indicator has no significant impact on the forex price action. We hope you found this article informative. Let us know if you have any questions in the comments below. Cheers!

Categories
Forex Fundamental Analysis

Everything You Should Know About ‘Government Budget Value’ Fundamental Indicator

Introduction

Regardless of the country, the respective governments have a pivotal role to play in economic growth for a given year. The vast resources at the disposal of the nation and state’s government, when combined with effective planning and action, has yielded phenomenal results for many countries’ growth. Understanding the government budget and its role in economic growth helps us to predict how conducive the market place will be for economic growth for the fiscal year.

What is Government Budget Value?

Budget: A budget is a periodic estimation of revenue and expenses for a specified period. The time-frame can be monthly, quarterly, or even yearly. A budget can be drafted for an individual, a group, a business, the government, or anything else that has cash in-flow and out-flow.

Government Budget: When we refer to the term budget, it is generally associated with the local or central government. The Government Budget refers to the estimated or forecast of its expenditures and revenue for a particular period. The time-frame generally for which it is estimated is for a financial year, which may or may not coincide with the calendar year. The combined income and outlays of a government for a fiscal year make up the government budget.

Government Budget Value: Here, the government budget value refers to the actual dollar value of the entire budget. We are referring here to the raw or direct numerical dollar value of the total budget. The budget is drafted as per the plans and obligations of the government for the fiscal year. The government has obligations like paying out social security funds, interests, and principal on its debts, purchasing military equipment for national security, and other mandatory spending programs. The government receives incomes from interests on its investments, revenue from taxes, fees collected from government services offered, etc.

All these income sources, outlays are all detailed in the government budget report. It is analogous to a bank statement of an individual except that it is for the entire government as a single entity, and the transaction values would be in millions and billions of dollars.

How can the Government Budget Value numbers be used for analysis?

In the budget report, if the revenues exceed the expenditures, then it is called a budget surplus. When the expenditures exceed the revenue, it is called a budget deficit. When both the revenue and expenditure level off and are equal, it is called a budget balance. All three scenarios have different meanings and implications.

When there is a budget surplus, the government has additional funds to create new infrastructure, improve the living conditions, raise salaries of government officials, and even provide support for new businesses to improve business growth. In developed economies, when the government experiences prolonged periods of excessive budget surplus, there may be outbursts from the public to reduce taxes levied on them to make sure money stays with the people who earned and not the government. Ideally, a budget surplus is preferred.

The budget balance is an ideal situation for any government where all their outlays are met through the revenues received, although any change of plans or additional programs, if needed to be taken up, would push them to a deficit. In general, all the expected expenditures would be factored in. A balanced budget would indicate every penny is accounted for and is very hard to achieve in real-world scenarios. There would always be some differences in income and outlays.

When the income does not suffice the expenditures, we have a budget deficit. It is the less preferred and more commonly occurring scenario, especially for developed economies like the United States. However, some arguments can be made where a deficit is not always bad, as the government can borrow extra funds from investors to set up the infrastructure for future returns. Temporary deficits for future surplus are acceptable. Deficits arising out of sustainable expenses, meaning expenses that will pay off in the future more than what they cost now, are seen as good signs for the economy.

On the other hand, when the deficit arises out of unsustainable expenses, which are likely to continue due to increasing debt, interest payments, inflation, etc. all are warning signs for the economy. The government plugs in the deficit by issuing securities and treasury bonds. Corporations and investors buy these bonds. A budget deficit can arise out of a multitude of reasons. When the economic growth of the native country is slower than its trading partners, it would spend more and earn less, leading to a deficit. High unemployment rates, recessions, tight lending environments, increased government spending, etc. all add to the deficit.

The United States has been facing a deficit crisis for many years in succession now. Things are only getting worse as the baby boomer generation is retiring, further increasing the weight on the social security program adding to wider deficits in the budget. An ideal government should maintain a surplus or at least a balance to be safe. Still, like any real-world scenario, a surplus or balanced budget does not ensure or indicate high economic growth. It just makes economic growth more conducive and likely for the nation or state.

The nation’s growth depends on many factors, and one amongst them is through government budget planning and allocation of funds. When it is played right, many things fall in order, and a significant boost for the economy can be induced.

Impact on Currency

The Government Budget values are useful for analysts to ascertain what proportion of funds will be allocated to each of the listed programs. The raw value of the budget in itself is not useful for traders as it is just a number and does not bear significance until there is something to compare. In general, budget or government spending as a percentage of GDP offers a more relative picture to forecast whether stimulus from the government side is relatively more or less. Through it, we can forecast the growth rate and market environment.

The government budget value alone is not enough to bring forth any significant economic conclusions or make an investment decision. Hence, it is a low-impact lagging indicator that does not bring much volatility in the currency markets.

Economic Reports

The Treasury Department and Office of Management and Budget of the United States maintain the government budget reports on their official websites. Internationally, the World Bank and International Monetary Fund maintain the budget data for most countries.

Sources of Government Budget Value

Treasury department of the United States – Budget Reports and Office of Management and Budget – USA detail the budget reports

Government budget values for most countries are available on Trading Economics.

How Government Budget Value Release Affects The Price Charts

In the US, the Department of the Treasury is responsible for the release of the Monthly Treasury Statement. This statement contains the Federal Budget Balance, which is synonymous to the Government Budget Value. It measures the difference in value between the federal government’s income and spending during the previous month. The most recent release was on August 12, 2020, at 2.00 PM ET and can be accessed from Investing.com here. A more in-depth review of the Monthly Treasury Statement can be accessed at the US the Department of the Treasury here.

The screengrab below is of the monthly government budget value from Investing.com. On the right is a legend that indicates the level of impact the fundamental indicator has on the USD.

As can be seen, the government budget value data is expected to have a medium impact on the USD upon its release.

The image below shows the recent changes in the monthly government budget value in the US. In July 2020, the government budget value changed from a deficit of $864 billion to $63 billion, beating analysts’ expectations of a $193 billion deficit. This change is positive and, in theory, should make the USD stronger compared to other currencies.

Now, let’s see how this release made an impact on the Forex price charts.

EUR/USD: Before the Monthly Government Budget Value Release 
on August 12, 2020, Just Before 2.00 PM ET

Before the budget data release, the EUR/USD pair was trading in a subdued uptrend. As seen in the above chart, the 15-minute candles are forming closer to the 20-period Moving Average, whose steepness is decreasing.

EUR/USD: After the Monthly Government Budget Value Release 
on August 12, 2020, at 2.00 PM ET

After the data release, the pair formed a 15-minute bullish candle, indicating that the USD weakened against the EUR contrary to the expectation. However, the data release was not significant enough to cause a shift in the trading pattern. The pair traded in a neutral trend with candles forming around a flat 20-period Moving Average.

AUD/USD: Before the Monthly Government Budget Value Release 
on August 12, 2020, Just Before 2.00 PM ET

Before the data release, the AUD/USD pair traded in a steady uptrend with candles forming above a rising 20-period MA.

AUD/USD: After the Monthly Government Budget Value Release 
on August 12, 2020, at 2.00 PM ET

The pair formed a 15-minute bearish “hammer” candle after the data release. Similar to the EUR/USD, AUD/USD subsequently traded in a neutral trend with the 20-period MA flattening.

NZD/USD: Before the Monthly Government Budget Value Release 
on August 12, 2020, Just Before 2.00 PM ET

NZD/USD: After the Monthly Government Budget Value Release 
on August 12, 2020, at 2.00 PM ET

NZD/USD pair showed a similar steady uptrend as observed with the AUD/USD before the data release. The pair formed a 15-minute bearish candle. It subsequently traded in the neutral pattern observed with the other pairs.

Bottom Line

For economists, the monthly government budget value is an invaluable indicator showing the trends in government budget deficit, revenue, and expenditures. However, in the forex market, this fundamental indicator does not produce significant price action changes, as observed in the above analyses.

Categories
Forex Fundamental Analysis

Do You Know That ‘IP Addresses’ of A Nation Is Also Considered A Macro Economic Indicator?

Introduction

The advent of the Internet and the rapid growth of technology over the years has dramatically changed the way we define development and living standards. The number of literate people nowadays do own an electronic gadget with access to the Internet. It was not the case long before, but now access to the Internet is seen as a growth measure for countries. Understanding the IP addresses count as a means to assess how developed a nation is fascinating to acknowledge and look back on how the Internet changed the world.

What is an IP Address?

Each electronic gadget with internet access has a unique identifier called its IP address. An analogy would be like the “from” address in a post letter. Successful transfer of to-and-fro of data from mailer to recipient is possible when “from” and “to” addresses are clear. The unique address of your computer machine is used to relay data across a network in either direction.

The majority of the networks today use TCP/IP (Transmission Control Protocol/Internet Protocol) as a means to communicate with other machines over a network. The unique identifier for a computer is known as its IP address.

There are two standards for IP address: IPv4 and IPv6 (v stands for version). All computers have the IPv4 address, and it is the prior version consisting of (24 =32 bit binary digits). At the same time, it will soon exhaust all possible combinations as more people start accessing the Internet. A sample IP address would look like “138.23.45.23” this. The IPv6 (26 = 128-bit binary digits) is the later implementation that came into the picture when we realized the limitation of IPv4 as the Internet was not an immediate trendsetter during its initial launch. The IPv6 will have six numbers as part of the address and would look something like “12.158.23.61.3.23” this.

How can the IP Addresses numbers be used for analysis?

Ten-twenty years ago, this article would be invalid as the Internet’s popularity grew exponentially until today to become an indispensable part of most economies. The Internet is now the primary source of information and communication. In today’s world countries, where the majority of people do not have access to the Internet are seen as third-world countries. It is a meaningful inference, though. Countries that have high literacy rates are bound to be aware of the Internet, computers, and similar electronic gadgets. People are rapidly incorporating technology all across the world and, through the Internet, are more connected than ever before.

Even if we look at the statistics and see the countries with one of the highest number of IP addresses are generally the most developed nations. Likewise, countries with the least number of IP addresses are generally underdeveloped nations. As more people are educated, have enough money to own a computer or electronic gadget, and have access to the Internet are likely to have a better living standard than those who do not.

One likely drawback of this type of inference would be that the IP address count is also a function of the population. Countries like India or China that have a large population count would easily surpass those who have a relatively small area of land and population. In that case, a percentage of the total population could be used to compare how many people have access to the Internet. In this digital age, the Internet is a powerful tool to incorporate new technologies, take advantage of access to external resources, and rapidly grow.

Businesses that do not have a “.com” are typically seen as not an established brand themselves. A digital presence of a business is almost mandatory as it has become one of the primary sources through which people know about the company. People, businesses, corporations, and governments are all accessible to us via the Internet. Hence, IP addresses count can give us more insight into how developed a country is than we think.

For instance, Bangalore, a city in India, is nowadays referred to as the Indian Silicon Valley due to a massive number of IT and Software companies operating as a primary business center there. With India incorporating electronic gadgets and the Internet (3G, 4G, and now 5G soon) boosted the economy, providing rapid growth and for consecutive years had one of the highest GDP growth rates globally. In this sense, the IP address count trend can be used to forecast growth trends in other developing countries.

Internet is a gold mine, companies like Facebook, Google have a net worth in billions, and the traditional definitions of large businesses do not apply to internet giants. Making proper use of the Internet and the available resources can potentially help in earning huge revenues. Even currency or stock trading are all done online for which we need internet access. Even this very article you are reading requires an internet connection and a computer (or a mobile) to begin-with.

Impact on Currency

The IP address count of countries serves as a general measure of prosperity. The relative growth of countries by the count and percentage share can be used to understand how open and adaptive countries are to the latest technologies. The countries with increasing IP addresses are likely to undergo a transformation and achieve high economic growth. We can forecast long-term trends through these statistics due to which it is a low-impact leading economic indicator as currency markets focus on current economic trends.

Economic Reports

The global count of IP addresses across countries is available through an internet company known as Akamai. However, the quarterly consolidated and graph plots of these statistics of most countries are available on Trading Economics.

That’s everything about IP Address Forex fundamental driver. It is obvious that there won’t be any impact on the price charts after the news release of this economic indicator. Cheers!

Categories
Forex Fundamental Analysis

Did You Know That ‘Internet Speed’ Of A Nation Is Also Considered A Forex Fundamental Driver?

What is Internet Speed?

Internet Speed refers to the speed at which data, voice, and video travel long distances. This is achieved with the help of broadband. Broadband refers to the transmission technologies used to transmit the internet. The term is used to describe high-speed and high-bandwidth communication infrastructure. Without broadband, it is not possible to attain high-speed internet at any cost. The common medium of transmission technologies includes coaxial cable, fiber optic cable, and radio waves.

(Source: Statista.com)

Business and Internet Speed  

Companies accessing the internet is nothing new. In the 80s, banks and Wall Street began changing the way they dealt with information. Back then, internet-related tasks were accomplished with the help of a simple modem and dial-up connection. In today’s demand scenario, much faster and reliable systems of internet connection are required. Business owners and IT professionals have a lot to choose from.

High-speed internet leads to greater advantages for companies that rely on cloud-based apps and data. According to the study conducted by an international group, a city with high-speed internet, over a gigabit connection, has an overall healthier economy. The research was carried out by comparing 14 metropolitan areas where more than half the population has access to high-speed internet with that of 40 neighboring cities without high-speed internet.

It was reported that cities that had gigabit connections, like the fiber optics, can support a 1.1% higher gross domestic product than other “slower internet” cities. A 1.1% contribution might soundless, but when this is seen in the context of developed countries that grow a minimum of 1-2% every year, one can estimate how significantly it can impact economic growth. It could mean up to $1.5 billion in the local economy.

Importance of High-Speed Internet

On a global level, increasing internet speeds have the power to transform whole economies. During the keynote speech at Broadband World Forum, Johan Wiberg (Head of Business Unit Network, Ericsson) described that when more and more people begin to have access to high-speed internet and mobile broadband, people will find new ways to conduct the businesses.

High internet speed has the power to spur economic growth by creating efficient systems for businesses and consumers. It opens up opportunities for more advanced online services, smarter utility services, and telecommunication. In healthcare, for instance, innovative mobile applications will be used by nearly 800 million people.

But when it comes to high-speed internet, it is not easy to launch into an area overnight. It takes effort from companies and governments to introduce data and wi-fi connectivity in rural areas. Hence, the positive effects of these new technologies are hard to see right away. As more and more businesses get access to high-speed internet, whole verticals of the economy will transform.

With these effects sounding exciting, one shouldn’t expect higher income levels with the introduction of high-speed internet in our communities. When governments and policymakers fully comprehend the importance of digital highways, it is then we can find drastic changes in the economy in no time.

Countries with Fastest Internet around the World

Taiwan has the fastest internet with an average speed of 85Mbps, followed by Singapore, Jersey, Sweden, and Denmark. While Yemen has the slowest internet in the world with an average speed of just 0.38Mbps. Thirty-seven of the fifty fastest internet countries are located in Europe, with 10 in Asia, 2 in North America, and just 1 in Africa. The global internet speed is getting faster.

The previous year, global average internet speed was 9.1Mbps while this year, the global average is 11.03Mbps, a rise of more than 20%. Generally speaking, countries which have the fastest internet speeds are the ones which are small and developed. The larger & less developed a nation is, the slower will be the internet.

By looking at the present statistics, we can say that there is little change in development, availability, and rollout of faster infrastructure in the bottom half of the ranking compared to the top half.

Below is the avg Internet Speed of different countries in the world (In terms of MBPS)

(Source – Fastmetrics)

Impact on Currency 

Temporary internet shutdown in a high connectivity country is estimated to have a GDP impact per 10 million people per day of $23.5 million on average. The average impact in a medium connectivity country would be an estimated $6.5 million and $0.6 million of GDP, respectively. Therefore, Internet Speed does impact the value of the currency as well. But it does not an immediate impact, rather the effect is felt on a longer-term.

Sources of information on Internet Speed

There are many speed testing websites that calculate internet speed and keep them updated every few minutes. However, this information cannot be found on most of the economic websites as it is a very important economic indicator for traders. The website of telecommunication ministry is also a source of information on the internet and broadband.

Links to Internet Speed information sources

GBP (Sterling) – https://tradingeconomics.com/united-states/internet-speed

AUD – https://tradingeconomics.com/australia/internet-speed

USD – https://tradingeconomics.com/united-states/internet-speed

CAD – https://tradingeconomics.com/canada/internet-speed

JPY – https://tradingeconomics.com/japan/internet-speed

CHF – https://tradingeconomics.com/switzerland/internet-speed

Final Words

Broadband has created new sectors and redefined the old ones. The music industry, for example, after years of declining sales, is growing rapidly after the adoption of digital distribution models. All this is possible only with the help of fast internet. As broadband becomes abundant and faster, everything from retail to government services finds new ways to reinvent themselves, especially in knowledge-based sectors where such speed and efficiency can enhance competitiveness.

Digital infrastructure opens up possibilities for more advanced online services, smarter utility services, e-health, telecommunication, and telepresence. All are dependent on high-speed broadband networks. Hence Internet Speed of a nation pays a key role in determining how advanced the country is in terms of technology as well.

Having that said, the news release of Internet Speed figures for different countries doesn’t really affect the Forex price charts in any way. Hence, technical analysts can ignore this fundamental driver’s news announcements. Cheers!