Categories
Forex Fundamental Analysis

The Impact Of The ‘US Redbook’ News Release On The Forex Market

Introduction

The growth in any economy is primarily driven by the growth of retail sales to households. For this reason, monitoring retail sales data can be the most suitable way of gauging if the economy is expanding or not. In most national retail sales data, the data is collected through surveys. However, having an index solely based on the growth of same-store sales can help provide a more accurate sense of growth in the retail industry.

Understanding US Redbook

Redbook Research Inc. is an American company primarily dealing with market research on the momentum of retail sales, macro and quantitative analysis, and consumer demand factors in public and private retail sectors. The company publishes the Johnson Redbook Retail Sales Index, also known as the US Redbook, which is considered one of the most respected proprietary indicators on retail sales in the US.

The Redbook index measures the growth in the US retail sector. The index uses a sales-weighted of the year-over-year growth in sales of the same store. About 9000 large general merchandise stores primarily operating in the US retail sector are sampled. When these sampled stores’ monetary value is measured, their combined output accounts for about 80% of the national retail sales. Note that in the US, the official government retail sales data is compiled and released by the Department of Commerce.

The Redbook index is published weekly. In this publication, the report extensively analyses and explains the current trends in retail sales and the economy. Since households’ demand is highly elastic, the weekly US Redbook publication can capture the most recent trends in consumer demand. Thus, the Johnson Redbook Retail Sales Index provides advance data on the trends in retail sales in the US.

In this report, the comprehensive analysis covers the sales in the current month, the quarterly sales, year-on-year and annual sales, company rankings, and data on historical sales. The 9000 retailers are categorized into; Apparel Specialty, Sporting Goods, Home Improvement, Home Furnishings, Books, Toy & Hobby, Department, Discount, Footwear, Furniture, Drug, Electronic, Jewellery, and Miscellaneous.

Using US Redbook in Analysis

We have already established that the US Redbook’s retail index provides a comprehensive and advance trend in household consumption patterns.

When the weekly US Redbook retail index increases, it means that households’ consumption is on the rise. At its core, higher levels of consumption are driven by increased disposable income in the economy. An increase in household consumption means that there is a general increase in demand in the economy. When households’ demand increases, it could mean that the economy’s unemployment levels have reduced. Since more people are gainfully employed, there is increased disposable income for households, hence the increase in consumption represented by the rise in the Redbook index. Similarly, it could also mean that wages received by households are increasing, which increases disposable income.

Conversely, when the weekly Redbook retail index drops, it means that households have reduced disposable income. The reduction in disposable income could directly result from increasing levels of unemployment or a reduction in wages received by households. With less disposable income, people will be forced to cut back on their consumption. In both these cases, the US Redbook retail index increase implies that the economy is expanding; conversely, a drop in the index shows that the economy is contracting.

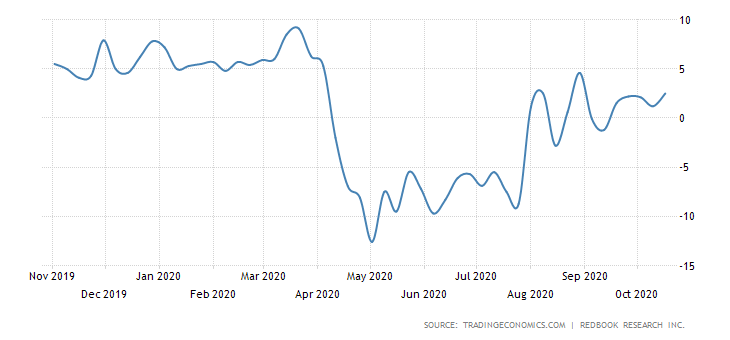
Source: Trading Economics

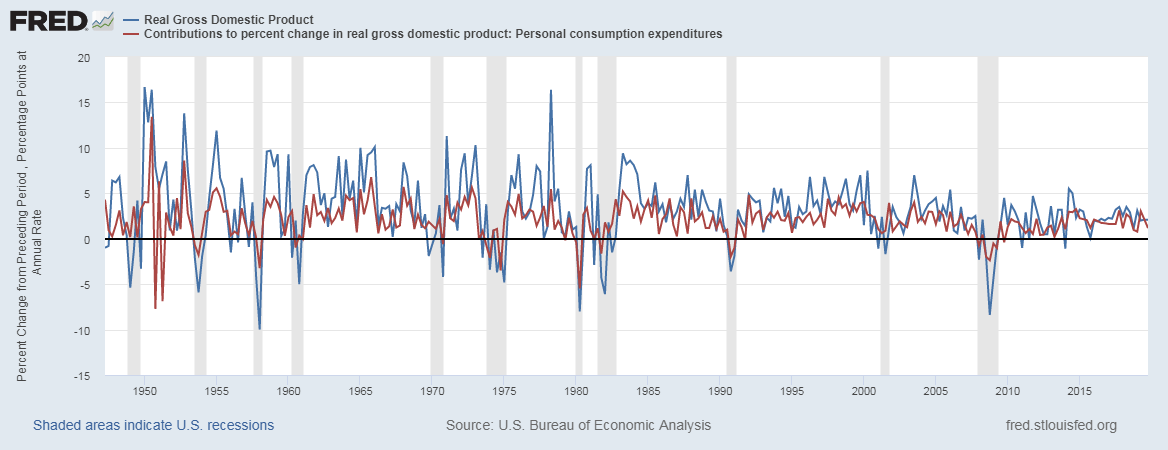
The US Redbook retail index can also be used as a precursor to economic recessions and recoveries. We already know that the majority of growth in the economy is driven by consumer demand. It is estimated that household consumption accounts for up to 70% of economic growth. Now, picture this. When the consumer demand is consistently dropping, suffice to say the GDP should also be expected to drop significantly. This period will be marked by a reduction in production and increased unemployment levels. Note that recession is described as a consistent drop in GDP for two successive quarters.

Source: St. Louis FRED

At the onset of the 2020 coronavirus pandemic, the weekly US Redbook retail index continuously dropped. From the period between March to May, the index dropped steadily. This period coincided with a drop in the US GDP. Due to the nationwide imposed lockdowns and social distancing rules, unemployment surged to historic highs of 14.7%. Naturally, demand in the economy was depressed.

In times of recessions, the US Redbook retail index can be handy in changes in household consumption. Policymakers can implement several expansionary policies meant to stimulate the economy. Since the official government retail sales data is published monthly, the US Redbook can be used to show any immediate response by households. The US Redbook index can therefore be used to show if the expansionary policies are working as they are expected to. One such instance can be seen after the US government implemented the 2020 stimulus package worth $2 trillion. The US Redbook retail index can be seen to be rising from the lowest points of May 2020.

Impact of US Redbook on USD

When the US Redbook retail index increases, we can expect the USD to appreciate relative to other currencies in the Forex market. A consistently rising index implies that the economy is steadily expanding, the unemployment rate is falling, and there is a general increase in money in the economy. In such a situation, governments and central banks might step in with contractionary fiscal and monetary policies. These policies are meant to prevent the economy from overheating and avoid unsustainable inflation levels due to the increase in the money supply. Such policies make domestic currency appreciate.

Conversely, a dropping US Redbook retail index shows that the general economy might be contracting. Consequently, expansionary fiscal and monetary policies like lowering interest rates might be implemented to stimulate the economy. Such policies make the domestic depreciate relative to others.

Sources of Data

Redbook Research Inc. published the weekly, monthly, and annual US Redbook Retail Sales Index. In-depth and historical data on the US Redbook Index is available at Trading Economics.

How US Redbook Index Release Affects The Forex Price Charts

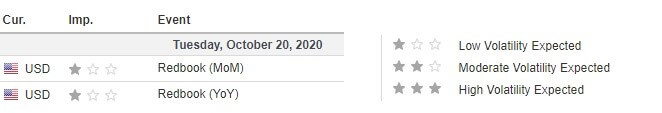
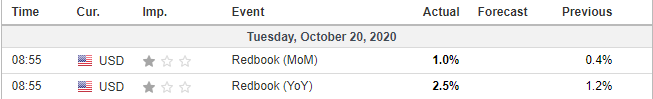
Redbook Research Inc. published Retail Sales Index the latest data on October 20, 2020, at 8.55 AM EST. The news release can be accessed at Investing.com. This release is expected to have a low impact on the USD.

The MoM index increased by 1.0% in the latest publication compared to 0.4% in the previous reading. Similarly, the YoY index showed an increase of 2.5% compared to the previous 1.2%.

Let’s find out if this release has an impact on the USD.

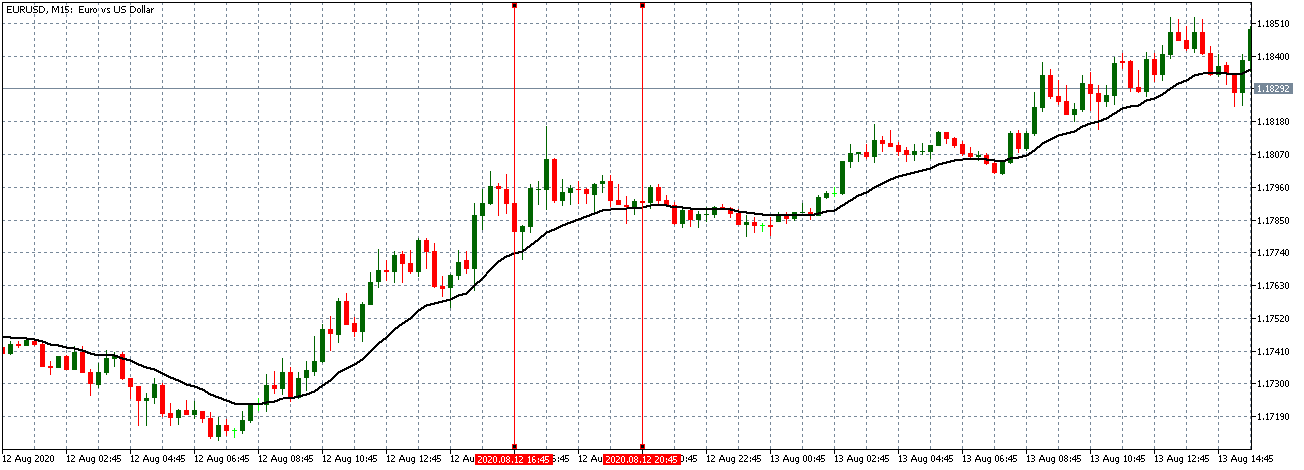
EUR/USD: Before US Redbook Release on October 20, 2020, just before 8.55 AM EST

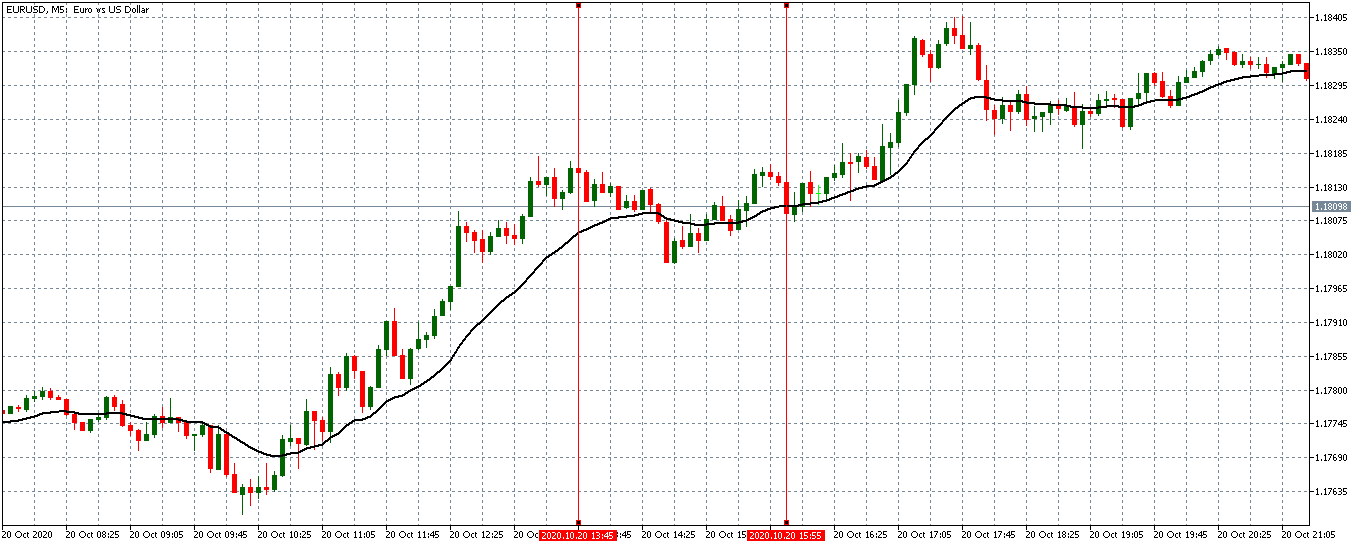
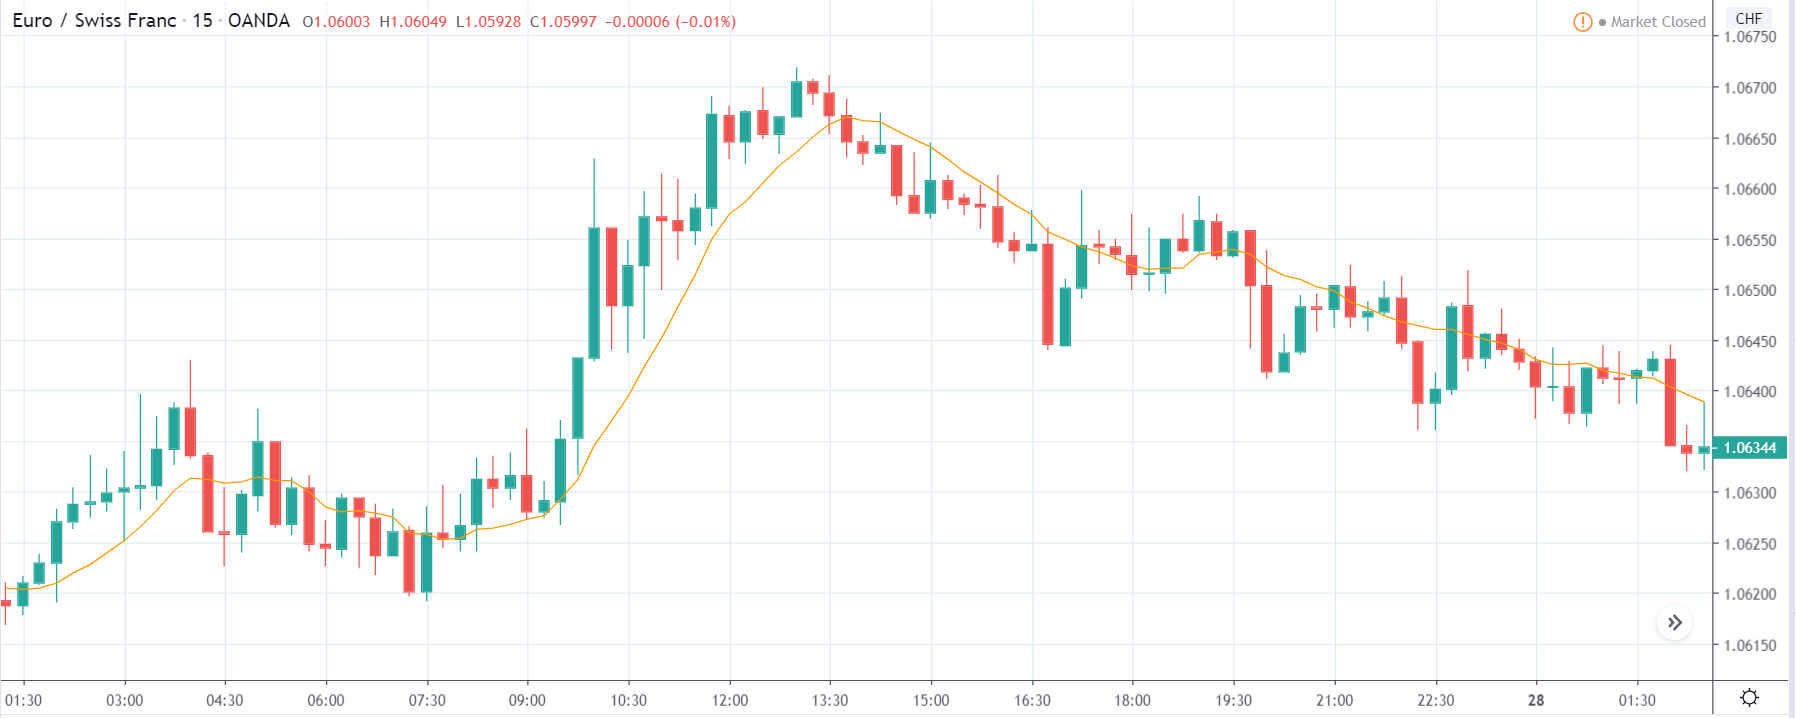
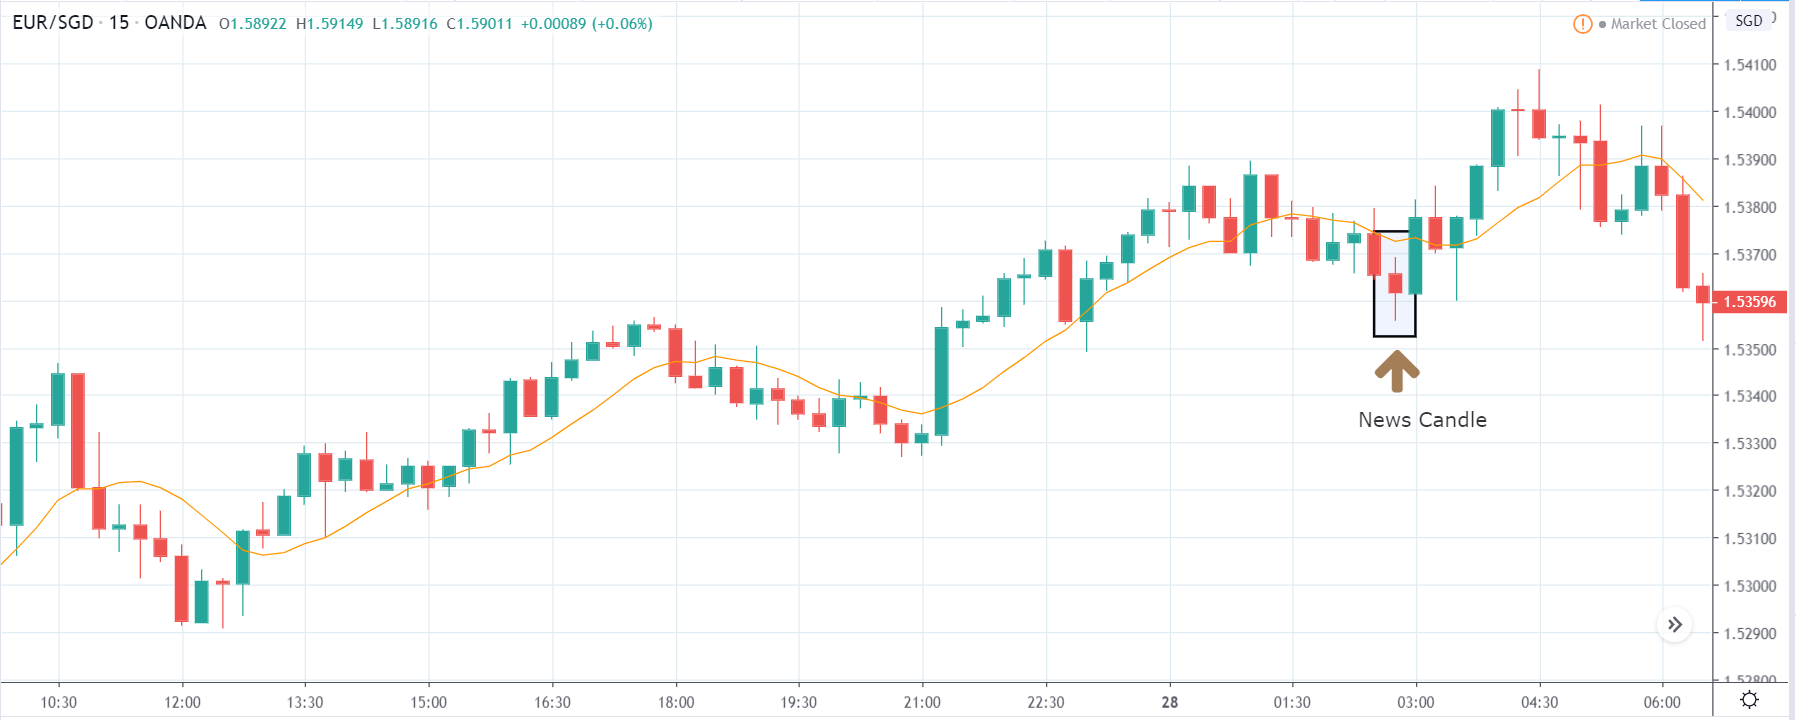
Before the release of the US Redbook data, the EUR/USD pair was trading in an almost neutral trend. The 20-period MA is seen to be flattening with candles forming just around it.

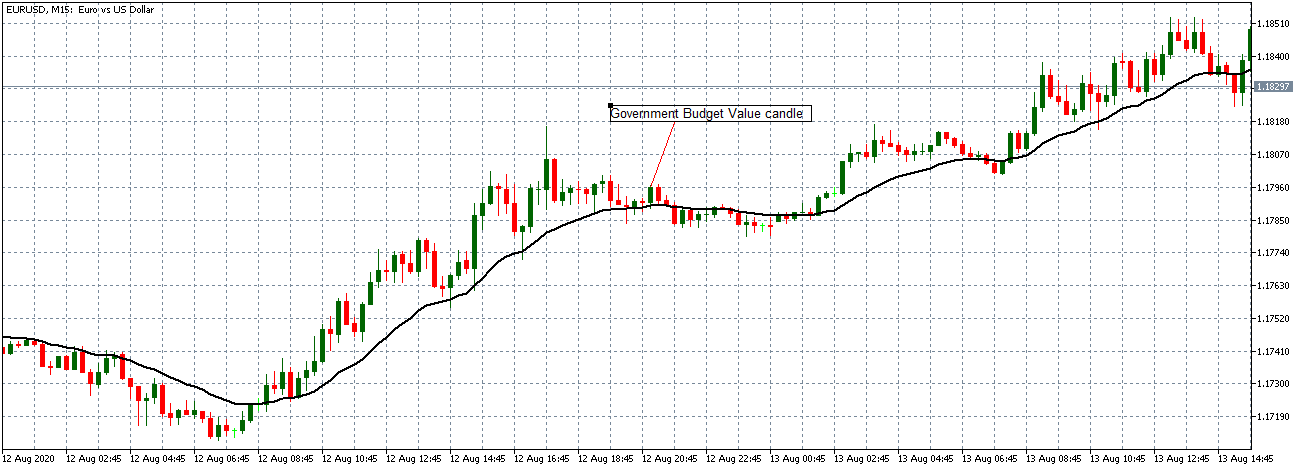
EUR/USD: After US Redbook Release on October 20, 2020, at 8.55 AM EST

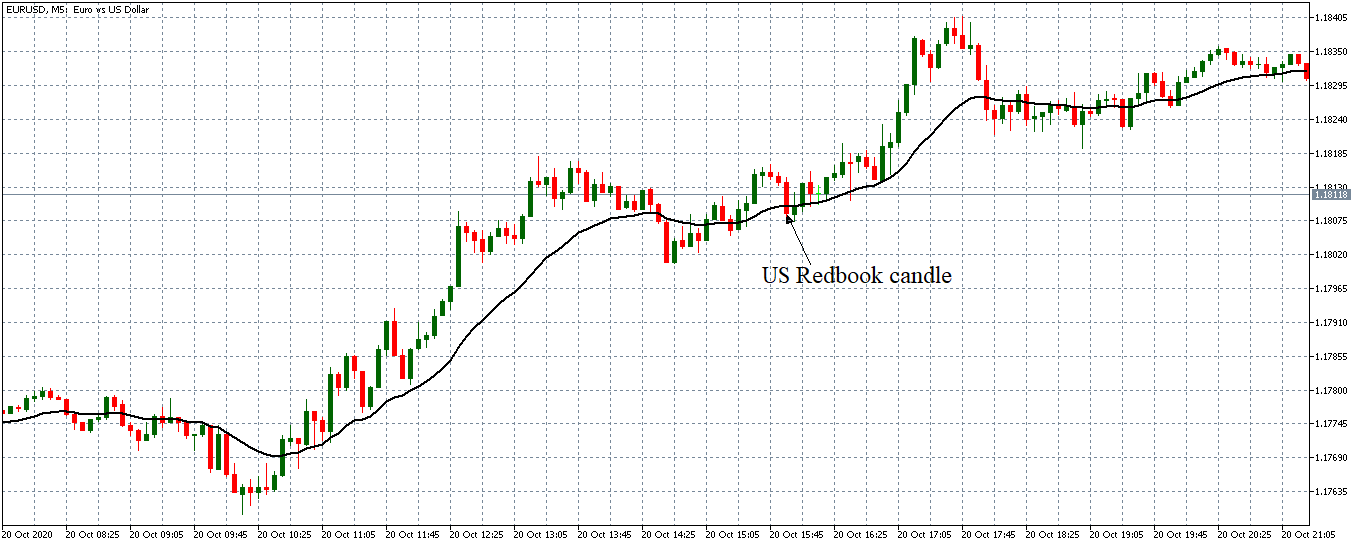
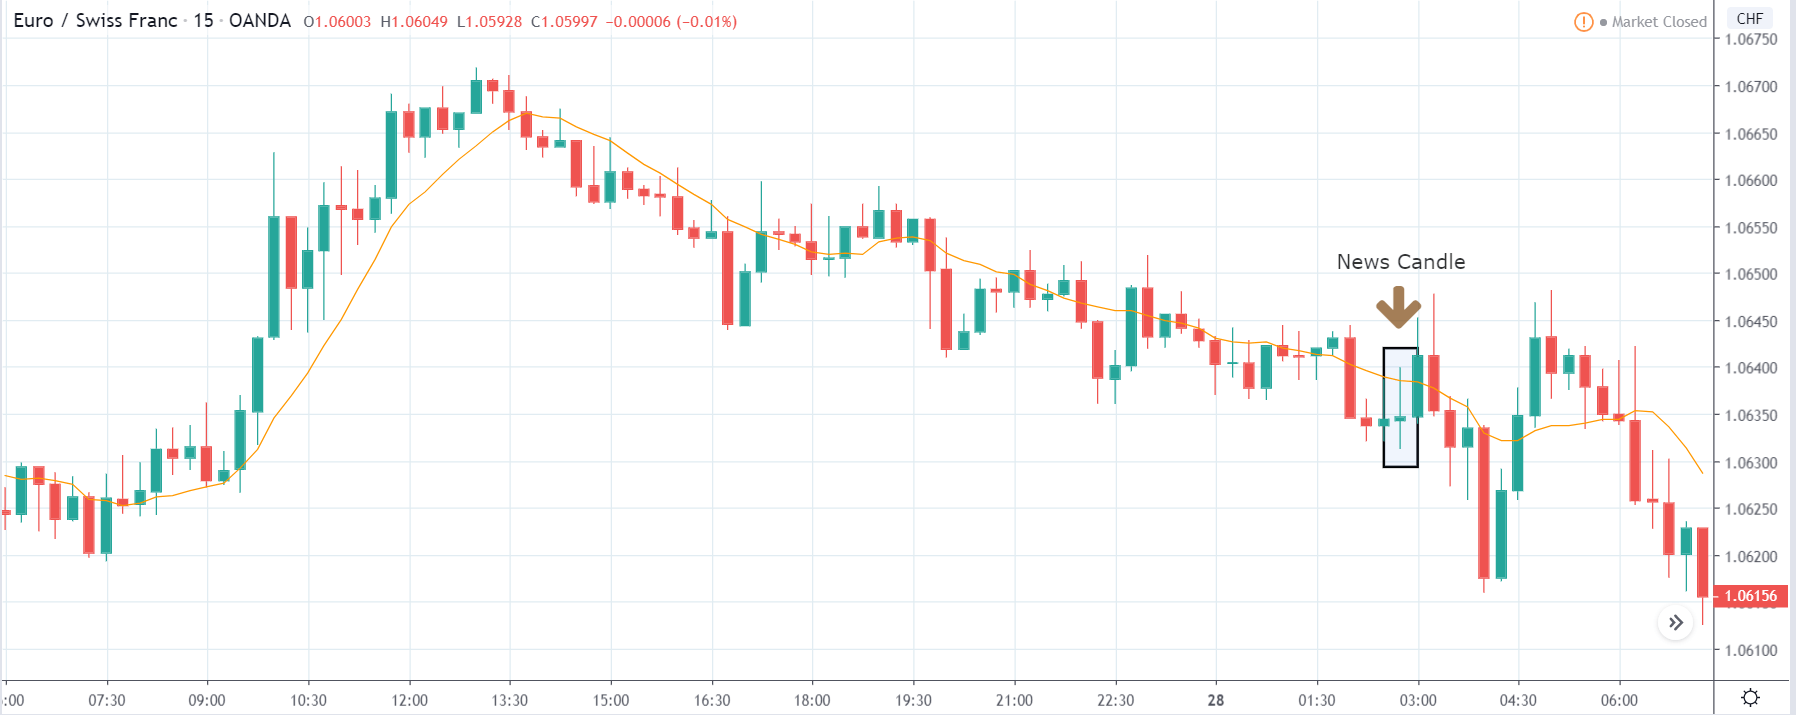
The EUR/USD pair formed a 5-minute bearish candle immediately after the publication of the US Redbook report. Subsequently, the pair continued trading in the earlier observed subdued uptrend.

Bottom Line

This article has established that the US Redbook report is a crucial leading indicator of retail sales and consumer demand. However, in the forex market, its significance is diminished since most traders pay close attention to the US Department of Commerce’s monthly retail sales data.

Categories
Forex Fundamental Analysis

Everything You Should Know About ‘Government Budget Value’ Fundamental Indicator

Introduction

Regardless of the country, the respective governments have a pivotal role to play in economic growth for a given year. The vast resources at the disposal of the nation and state’s government, when combined with effective planning and action, has yielded phenomenal results for many countries’ growth. Understanding the government budget and its role in economic growth helps us to predict how conducive the market place will be for economic growth for the fiscal year.

What is Government Budget Value?

Budget: A budget is a periodic estimation of revenue and expenses for a specified period. The time-frame can be monthly, quarterly, or even yearly. A budget can be drafted for an individual, a group, a business, the government, or anything else that has cash in-flow and out-flow.

Government Budget: When we refer to the term budget, it is generally associated with the local or central government. The Government Budget refers to the estimated or forecast of its expenditures and revenue for a particular period. The time-frame generally for which it is estimated is for a financial year, which may or may not coincide with the calendar year. The combined income and outlays of a government for a fiscal year make up the government budget.

Government Budget Value: Here, the government budget value refers to the actual dollar value of the entire budget. We are referring here to the raw or direct numerical dollar value of the total budget. The budget is drafted as per the plans and obligations of the government for the fiscal year. The government has obligations like paying out social security funds, interests, and principal on its debts, purchasing military equipment for national security, and other mandatory spending programs. The government receives incomes from interests on its investments, revenue from taxes, fees collected from government services offered, etc.

All these income sources, outlays are all detailed in the government budget report. It is analogous to a bank statement of an individual except that it is for the entire government as a single entity, and the transaction values would be in millions and billions of dollars.

How can the Government Budget Value numbers be used for analysis?

In the budget report, if the revenues exceed the expenditures, then it is called a budget surplus. When the expenditures exceed the revenue, it is called a budget deficit. When both the revenue and expenditure level off and are equal, it is called a budget balance. All three scenarios have different meanings and implications.

When there is a budget surplus, the government has additional funds to create new infrastructure, improve the living conditions, raise salaries of government officials, and even provide support for new businesses to improve business growth. In developed economies, when the government experiences prolonged periods of excessive budget surplus, there may be outbursts from the public to reduce taxes levied on them to make sure money stays with the people who earned and not the government. Ideally, a budget surplus is preferred.

The budget balance is an ideal situation for any government where all their outlays are met through the revenues received, although any change of plans or additional programs, if needed to be taken up, would push them to a deficit. In general, all the expected expenditures would be factored in. A balanced budget would indicate every penny is accounted for and is very hard to achieve in real-world scenarios. There would always be some differences in income and outlays.

When the income does not suffice the expenditures, we have a budget deficit. It is the less preferred and more commonly occurring scenario, especially for developed economies like the United States. However, some arguments can be made where a deficit is not always bad, as the government can borrow extra funds from investors to set up the infrastructure for future returns. Temporary deficits for future surplus are acceptable. Deficits arising out of sustainable expenses, meaning expenses that will pay off in the future more than what they cost now, are seen as good signs for the economy.

On the other hand, when the deficit arises out of unsustainable expenses, which are likely to continue due to increasing debt, interest payments, inflation, etc. all are warning signs for the economy. The government plugs in the deficit by issuing securities and treasury bonds. Corporations and investors buy these bonds. A budget deficit can arise out of a multitude of reasons. When the economic growth of the native country is slower than its trading partners, it would spend more and earn less, leading to a deficit. High unemployment rates, recessions, tight lending environments, increased government spending, etc. all add to the deficit.

The United States has been facing a deficit crisis for many years in succession now. Things are only getting worse as the baby boomer generation is retiring, further increasing the weight on the social security program adding to wider deficits in the budget. An ideal government should maintain a surplus or at least a balance to be safe. Still, like any real-world scenario, a surplus or balanced budget does not ensure or indicate high economic growth. It just makes economic growth more conducive and likely for the nation or state.

The nation’s growth depends on many factors, and one amongst them is through government budget planning and allocation of funds. When it is played right, many things fall in order, and a significant boost for the economy can be induced.

Impact on Currency

The Government Budget values are useful for analysts to ascertain what proportion of funds will be allocated to each of the listed programs. The raw value of the budget in itself is not useful for traders as it is just a number and does not bear significance until there is something to compare. In general, budget or government spending as a percentage of GDP offers a more relative picture to forecast whether stimulus from the government side is relatively more or less. Through it, we can forecast the growth rate and market environment.

The government budget value alone is not enough to bring forth any significant economic conclusions or make an investment decision. Hence, it is a low-impact lagging indicator that does not bring much volatility in the currency markets.

Economic Reports

The Treasury Department and Office of Management and Budget of the United States maintain the government budget reports on their official websites. Internationally, the World Bank and International Monetary Fund maintain the budget data for most countries.

Sources of Government Budget Value

Treasury department of the United States – Budget Reports and Office of Management and Budget – USA detail the budget reports

Government budget values for most countries are available on Trading Economics.

How Government Budget Value Release Affects The Price Charts

In the US, the Department of the Treasury is responsible for the release of the Monthly Treasury Statement. This statement contains the Federal Budget Balance, which is synonymous to the Government Budget Value. It measures the difference in value between the federal government’s income and spending during the previous month. The most recent release was on August 12, 2020, at 2.00 PM ET and can be accessed from Investing.com here. A more in-depth review of the Monthly Treasury Statement can be accessed at the US the Department of the Treasury here.

The screengrab below is of the monthly government budget value from Investing.com. On the right is a legend that indicates the level of impact the fundamental indicator has on the USD.

As can be seen, the government budget value data is expected to have a medium impact on the USD upon its release.

The image below shows the recent changes in the monthly government budget value in the US. In July 2020, the government budget value changed from a deficit of $864 billion to $63 billion, beating analysts’ expectations of a $193 billion deficit. This change is positive and, in theory, should make the USD stronger compared to other currencies.

Now, let’s see how this release made an impact on the Forex price charts.

EUR/USD: Before the Monthly Government Budget Value Release 
on August 12, 2020, Just Before 2.00 PM ET

Before the budget data release, the EUR/USD pair was trading in a subdued uptrend. As seen in the above chart, the 15-minute candles are forming closer to the 20-period Moving Average, whose steepness is decreasing.

EUR/USD: After the Monthly Government Budget Value Release 
on August 12, 2020, at 2.00 PM ET

After the data release, the pair formed a 15-minute bullish candle, indicating that the USD weakened against the EUR contrary to the expectation. However, the data release was not significant enough to cause a shift in the trading pattern. The pair traded in a neutral trend with candles forming around a flat 20-period Moving Average.

AUD/USD: Before the Monthly Government Budget Value Release 
on August 12, 2020, Just Before 2.00 PM ET

Before the data release, the AUD/USD pair traded in a steady uptrend with candles forming above a rising 20-period MA.

AUD/USD: After the Monthly Government Budget Value Release 
on August 12, 2020, at 2.00 PM ET

The pair formed a 15-minute bearish “hammer” candle after the data release. Similar to the EUR/USD, AUD/USD subsequently traded in a neutral trend with the 20-period MA flattening.

NZD/USD: Before the Monthly Government Budget Value Release 
on August 12, 2020, Just Before 2.00 PM ET

NZD/USD: After the Monthly Government Budget Value Release 
on August 12, 2020, at 2.00 PM ET

NZD/USD pair showed a similar steady uptrend as observed with the AUD/USD before the data release. The pair formed a 15-minute bearish candle. It subsequently traded in the neutral pattern observed with the other pairs.

Bottom Line

For economists, the monthly government budget value is an invaluable indicator showing the trends in government budget deficit, revenue, and expenditures. However, in the forex market, this fundamental indicator does not produce significant price action changes, as observed in the above analyses.

Categories
Forex Fundamental Analysis

Importance of ‘Consumer Spending’ as an Economic Indicator

Introduction

Consumer Spending is a significant contributor to the annual GDP of an economy. It is released ahead of GDP numbers and hence is widely used by traders and investors alike to make investment decisions. Consumer Spending is what drives the economy mostly. Imagine if consumers stopped spending on anything apart from the basic needs, it would result in the closure of many businesses and services. Hence, understanding the importance and impact of this advanced indicator is crucial for our Fundamental Analysis.

What is Consumer Spending? 

Consumer Spending refers to the amount spent to meet their daily needs and personal expenses. In other words, it refers to the money paid for goods and services by the general public. The products and services can include all that we, as an individual, consume to live our lives. The groceries, the movies, the drinks, the internet, phones, etc. all these are part of our lives that the Consumer Spending measures.

The money we SPEND on CONSUMPTION of goods and services by CONSUMERS is Consumer Spending. A nation in its core is its people, and what those people spend on is what runs the market. What you and I spend on is what will drive the market. Consumer Spending makes up 66% of the total Gross Domestic Product in the United States, and business and government spending contribute to the rest.

Consumer Spending depends on the macro scale on the below vital factors:

Mortgages and Debt: In the United States, almost all the citizens have debt in one form or another, be it student loan, education loan, house mortgage, or healthcare insurances. The more the debt, the lesser the consumer has left for his spending, thereby tightening his pocket on extra expenditures.

Disposable Income: It refers to the remaining part of an individual’s income left after deductions of all federal taxes. It is the difference between the average salary and tax deductions—higher the charges lesser the money available for spending.

Per Capita Income: It tells us the income per individual within the country. Only when the overall income per person is sufficiently large enough to exceed meeting the basic requirements only then will people have a budget for spending. Rising Per Capita Income indicates that the standard of living is improving, which automatically enhances consumer spending.

Income Disparity: The imbalance in the wages of different sections of society is bad for the economy. A sufficiently rich person’s increase in income will not lead to higher spending as he or she will tend to invest or save to accumulate more wealth. Only when the wages of the lower sections of the society increase will the spending increase as they are the ones cutting back on expenditures due to lack of money. Reformation can be brought about in the country if the government focuses more on benefiting the lower sections more than other parts of the society.

Consumer Sentiment: It is the people of the nation who know better than traders and investors about the economic prospects as they are the ones working on the ground and going about their daily routine facing all kinds of situations. Whatever analysts, investors, and traders assess a nation’s economy, it cannot beat the first-hand experience of the people themselves. The Consumer Sentiment tells what the general people feel about the prospects of their jobs, growth, and security.

If a consumer feels his income will increase steadily and is secure, he will tend to spend more now. Conversely, if the consumer is not sure of his job status and not confident about his future employment status, then he or she will tend to save more to meet their needs during times of unemployment. Thereby decreasing spending now and saving more for later.

How is the Consumer Spending Report obtained?

The Bureau of Economic Analysis releases monthly reports on the percentage of changes in the average Consumer Spending titled “Personal Consumer Expenditures.” BEA releases this report at a national level on a quarterly and annual basis. The Bureau of Labor Statistics also releases a report titled Consumer Expenditure Survey in August every year with little variations. They calculate using the statistics form the United States Census Bureau to arrive at this survey report.

Is Consumer Spending important?

It is one of the most significant indicators to predict GDP. It is an advanced indicator meaning it predicts future economic conditions rather than reflecting current or past industrial activities. Since it is a significant driver for the Gross Domestic Product, it is one of the top economic indicators amongst all. Consumer Spending tells us about the strength of the economy and the standard of living of the country’s citizens.  It almost drives 70% of the GDP figure; hence there is no doubt that it is a must for Fundamental Analysis.

Below is a plot of the percentage change in Consumer Spending vs. Real GDP from the St. Louis FRED website to demonstrate this indicator’s importance in comparison to the rest.

(Chart Source)

How can Consumer Spending be Used for Analysis?

What the consumers are willing to spend on can make or break the markets. By analyzing the spending trends and recognizing what sector of goods and services consumers purchase can tell us which market is going to flourish and stagnate. Consumer Spending represents the demand side of the supply-demand market, where supply is the providers or manufacturers of the goods.

When Consumers increase spending, this increases demand, which leads to business growth, increased employment, improved wages to meet the demand. This increase will again lead to increased spending by the newly employed and adjusted salaries, and all this becomes a positive feedbacking loop and continues till it saturates. When demand outpaces supply, we will have inflation, which is terrible for the economy as the increasing prices will make consumers increase spending now than later it will again result in price inflations. The primary job of the Federal Reserve is to prevent this vicious cycle of price inflation.

On the other end, low consumer spending reduces demand for goods and services, which stagnates business and hence the economy contracts and results in lower levels of GDP, which is also not good.

Traders can use the Consumer Spending Surveys, Indices to relatively compare economic situations of nations and also with previous periods to assess currency valuation or devaluation direction in the coming months. Investors can make investment decisions based on which sectors are experiencing increased demand looking at the spending patterns. Consumer Spending can also direct us in Stock Market evaluations of different companies.

Sources of Consumer Spending Reports

We can obtain the Consumer Spending monthly releases from the BEA, and that data can be found here. For illustration, you can refer to this link to see what the U.S. population spends more on. You can also check the University of Michigan’s Consumer Sentiment Index here.  As discussed, it is a primary driver of Consumer Spending.

Impact of the ‘Consumer Spending’ news release on the price chart 

In this section of the article, we will analyze the impact of the Consumer Spending economic indicator on the value of a currency. As we understood in the previous that the Consumer Spending measures the change in the inflation-adjusted value of goods expenditures by consumers, now we shall see how important the data is for traders and investors. Consumer Spending is one of the major economic activities in a country. However, looking at the below image, it seems like traders do not give a lot of importance to the data (Yellow box indicates less important) and may not make significant changes to their positions in the currency. In any case, let us see how the market reacts to the data release.

Below is the image showing the latest Consumer Spending data of France, which will have an effect on the EURO. The National Institute of Statistics and Economic Studies collects and disseminates information on the French economy and society. A higher than expected reading is considered to be positive for the economy, and a lower than expected reading is taken to be negative.

EUR/AUD | Before The Announcement

We start our analysis with the EUR/AUD currency pair, and as we can see in the image above, the chart is a strong uptrend, and the market has retraced recently. One of the reasons behind the violent up move is that the market participants are expecting a better Consumer Spending data for the month of February. Since the market has retraced quite a bit, aggressive traders can go ‘long’ in the market before the news announcement due to optimism in the market.

EUR/AUD | After The Announcement

After the Consumer Spending data is released, the market falls, but it leaves a wick on the bottom, and the price forms a ‘Doji’ candlestick pattern, which essentially indicates indecision in the market. As the data was far below what was predicted, we should wait for more confirmation from the market to notice the change in volatility. We see that that the volatility expands on the upside and goes above the moving average. This is an indication that the news outcome is digested by the market and will continue its trend. Thus, we can enter for a ‘buy’ after the price potently moves higher with a stop loss below the ‘low’ of news candle.

EUR/CHF | Before The Announcement

EUR/CHF | After The Announcement

Next, we discuss the EUR/CHF currency pair where before the news announcement, the market is in a strong downtrend, exactly opposite to the above currency pair. As the volatility is high on the downside, we should not expect a positive Consumer Spending data to cause a reversal of the trend. Whereas, a ‘bad news’ may take the currency much lower. We cannot take any position at this point, not even a ‘buy’ as we are in a strong downtrend, and there are no signs of reversal.

After the numbers are released, it is evident from the ‘news candle’ that there is an increase in volatility on both sides, and finally, the price closes near its opening price. The long wick on top of the ‘news candle’ is an indication that selling pressure is high due to poor Consumer Spending data. Therefore, at this point, one can go ‘short’ in the pair with a stop loss above the recent ‘high.’

EUR/SGD | Before The Announcement

EUR/SGD | After The Announcement

The above images represent the EUR/SGD currency pair, where the characteristics of the chart appear to be similar to that of the EUR/AUD pair. One major difference is that the uptrend is not as resilient as in the case of EUR/AUD. Before the news announcement, the market is at the key area of resistance equals support. This is the place where most traders go ‘long’ in the market and join the uptrend. But since the volatility is high, it is recommended to wait for the news release and then act accordingly.

After the news announcement, some selling pressure is witnessed as a result of weak Consumer Spending data, and the candle closes in red. But later, the ‘news candle’ is immediately is taken over by a bullish candle. This means, due to the bad news, the market initially reacted as per expectations, but this was not sufficient enough to cause a reversal in the market. As the impact of the news was less, we can trade with the trend, by going ‘long.’

This completes our discussion on Consumer Spending and the impact of its news announcements on the Forex price charts. If you have any queries, please let us know in the comments below. Cheers.