Categories
Forex Fundamental Analysis

Why ‘Personal Spending’ is Considered a Crucial Fundamental Indicator?

Introduction

Personal Spending makes up one half of Consumer Spending. As consumer spending drives total GDP, tracking Personal Spending patterns and changes can help us better understand the direction of the economy’s health.

What is Personal Spending?

In the broader sense, Personal Spending generally refers to Consumer Spending, which is a significant economic indicator as it drives about 70% of the total GDP. Consumer Spending is made up of two main components: Personal Saving and Personal Spending. Consumer Spending refers to the amount spent to meet daily needs and personal expenses to conduct one’s lifestyle.

In other words, it refers to the money paid for goods and services by the general public. The products and services can include all that we, as an individual, consume to live our lives. The groceries, the movies, the savings, the internet bills, phones, etc. all these are part of our lives that the Consumer Spending measures. Personal Spending in this regard is the more specific component of Consumer Spending.

Consumer Spending = Personal Spending + Personal Savings

Economic Reports

The United States Commerce: Bureau of Economic Analysis measures personal Spending in the form of Personal Consumption Expenditure (PCE) or Consumer Spending Report. PCE report measures the goods and services purchased by individuals and NonProfit Institutions Serving Households (NPISHs)—who are resident in the United States.

PCE also includes purchases by military personnel stationed abroad, regardless of the duration of their assignments, U.S. government civilian, and by U.S. residents who are traveling or working abroad for one year or less.

BEA releases the PCE report in the last week of the month for the previous month. Quarterly and Annual reports, Seasonally adjusted versions of the same, along with Personal Saving Reports, are all available under the release titled “Personal Income and Outlays.”

Why Personal Spending?

Personal Spending is one-half of the Disposable Personal Income (the net amount left after all tax payments from the gross income), and it includes the necessities and personal expenditures. Hence, some may refer to Personal Spending to the expenses incurred by money spent on personal enjoyment like going to Restaurants, Trips, buying jewelry, clothing, movies, gaming, concerts, etc.

In this sense, Personal Spending takes a hit during job loss, tight monetary conditions, or recessionary periods as people cut back on personal comforts and tend to save more for the future. Decreased Personal Spending is not a  good sign for the economy as it withdraws money from the system and stays in people’s bank accounts or pockets only.

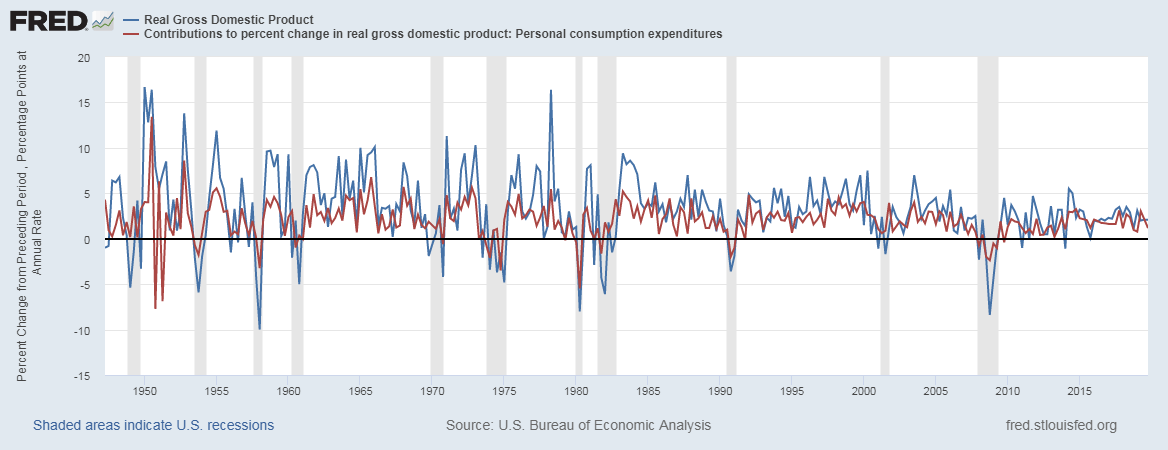
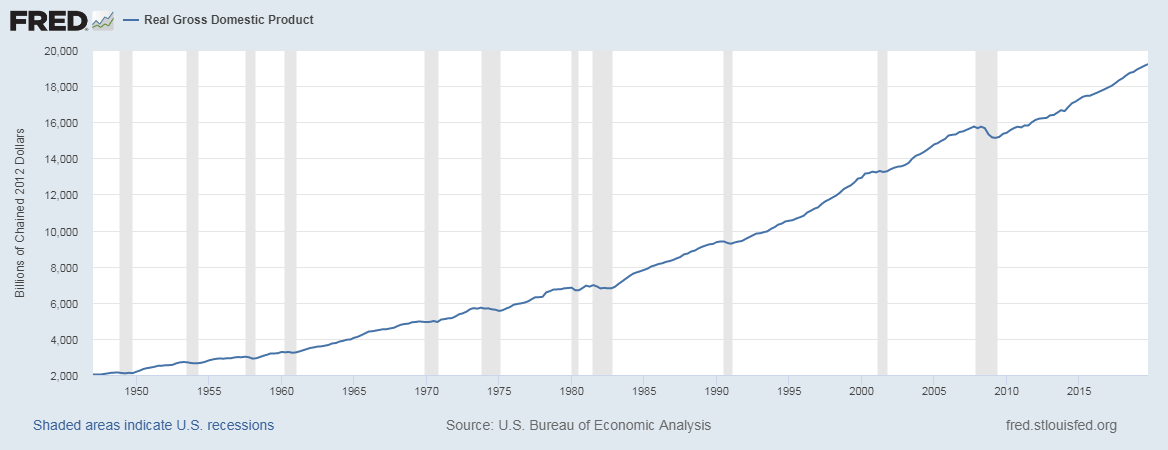
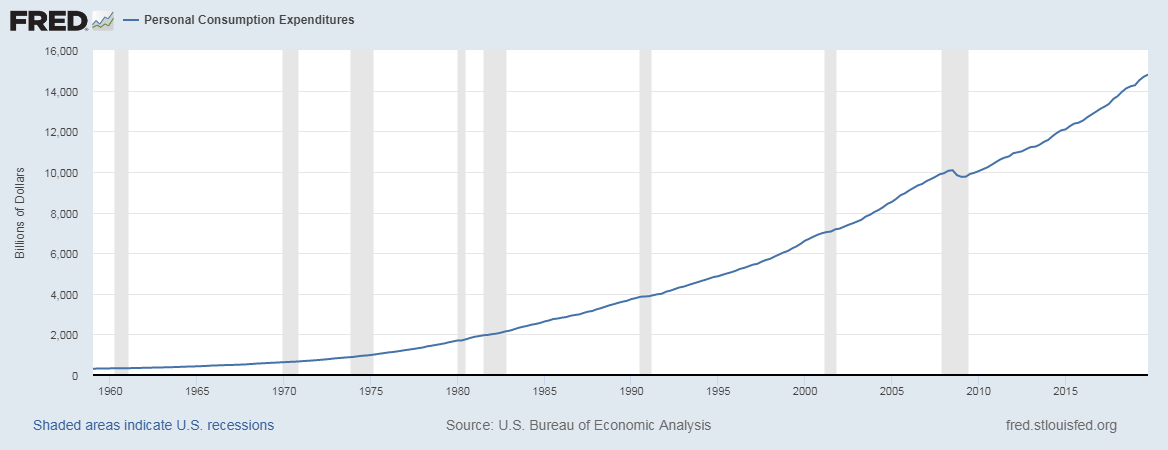
The correlation between Personal Spending and the GDP of a nation is strong. As we can see below, during recessions, the GDP and PCE (Personal Expenditures Report)  flat out from their usual and trend sideways or downwards (during more extended recessionary periods), otherwise steadily increase at the same pace.

Real Gross Domestic Product (In Billions)

Personal Consumption Expenditures (In Billions)

How can Personal Spending numbers be used for analysis?

Savings are for future consumption, and Personal Spending is for current use. Personal Savings are suitable for the long-term growth and health of the economy, while Personal Spending is more beneficial for short-term growth. Personal Spending becomes essential when an economy is going in or coming out of recession. It is during these periods of economic contraction-edges where changes in the spending numbers can be used to predict the trend of the economic recovery.

Investors can also monitor the Personal Spending sections of the PCE report and determine the spending patterns of people and predict sectorial growth or slowdowns. For example, a few decades ago, the service sector was not as dominant as it is today. Today about 64% of the expenses go towards services. This change in trend is easily observable through PCE. Through PCE, we can predict which markets are likely to see a boom or slowdown.

For illustration, see the below graphical representation extracted from the BEA official website, of the primary services that people are spending their money on. HealthCare and Housing Utilities make up a majority of the services that are chosen by people when compared to other services like Transportation, or Recreation. Such analysis is very useful for investors and stock traders to assess the industrial performance of different goods and service sectors.

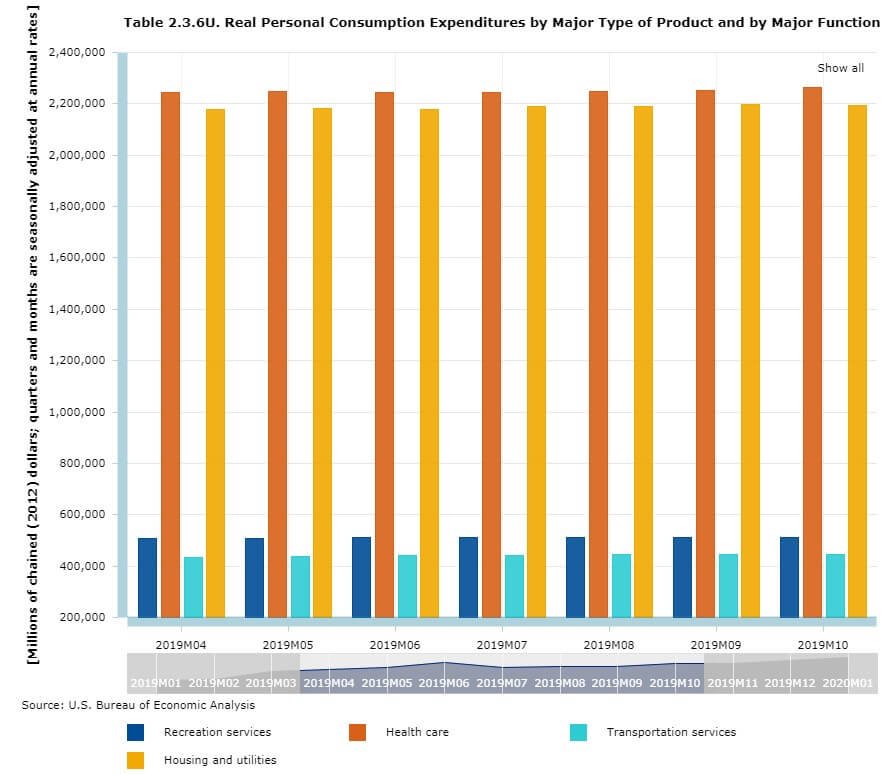
(Image Source – BEA official website)

Impact on Currency

Personal Spending is a proportional indicator. Higher numbers in the Personal Spending section signals a growing economy and hence is good for the currency. Dip in the figures results in currency depreciation. As drop signifies, people are spending less, which results in business slowdowns in the economy, which ultimately results in lower GDP print, which is depreciating for the currency.

Personal Spending is a mild impact indicator as the retail sales figures precede the PCE monthly reports where similar tradable conclusions can be drawn as that of PCE reports. A healthy and growing economy would be reflected in the Personal Spending numbers as the people make up the economy. It is important to remember that Personal Spending is a reflection of the present financial situations of the population and hence only shows what the current economic status of the nation is.

It is a coincident indicator in this sense and is dependent on macroeconomic factors like the government’s policies, Quantitative Easing, inflation, etc. which direct the money flow. Hence, it is the effect in the cause-and-effect equation. It reflects the results of an action rather than the act itself. 

Sources of Personal Spending

The monthly PCE numbers releases can be found on the official website of the Bureau of Economic Analysis – Personal Income and Outlays-PCE

As opposed to Personal Spending, you can find the Personal Saving Rate in these sources – Personal Saving Rate & Personal Income and Savings

Personal Spending data and statistics of various countries can be found here – Trading Economics – Personal Spending

Impact of the ‘Personal Spending’ news release on the price chart 

Now that we have a clear understanding of the Personal Spending economic indicator, we will now watch the impact of the indicator on the value of a currency. As Personal Spending measures the change in the inflation-adjusted value of all Spending by consumers, it accounts for a majority of overall economic activity. This report tends to have a mild to severe impact on the currency.

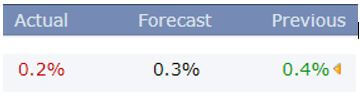
The below image shows the previous, forecasted, and latest Personal Spending data of the U.S., which is announced on a monthly basis. It is published by the Bureau of Economic Analysis and is the authoritative agency that conducts surveys across the country. A higher than expected reading is considered to be positive for the economy, while a lower than expected reading is considered to be negative. Let us examine the reaction of the market for the latest release.

USD/JPY | Before The Announcement

We will start analyzing the impact of Personal Spending data on the USD/JPY currency pair, where the above image shows the state of the chart before the news announcement. It very clear that the pair is in a strong downtrend, which means the U.S. dollar is extremely weak. One of the reasons behind weakness in the U.S. dollar is that the market participants are expecting lower Personal Spending figures for the month of February. At this point, aggressive traders can take ‘short’ positions in the market, owing to pessimism in the market, with a stop loss above the recent ‘high.’   

USD/JPY | After The Announcement

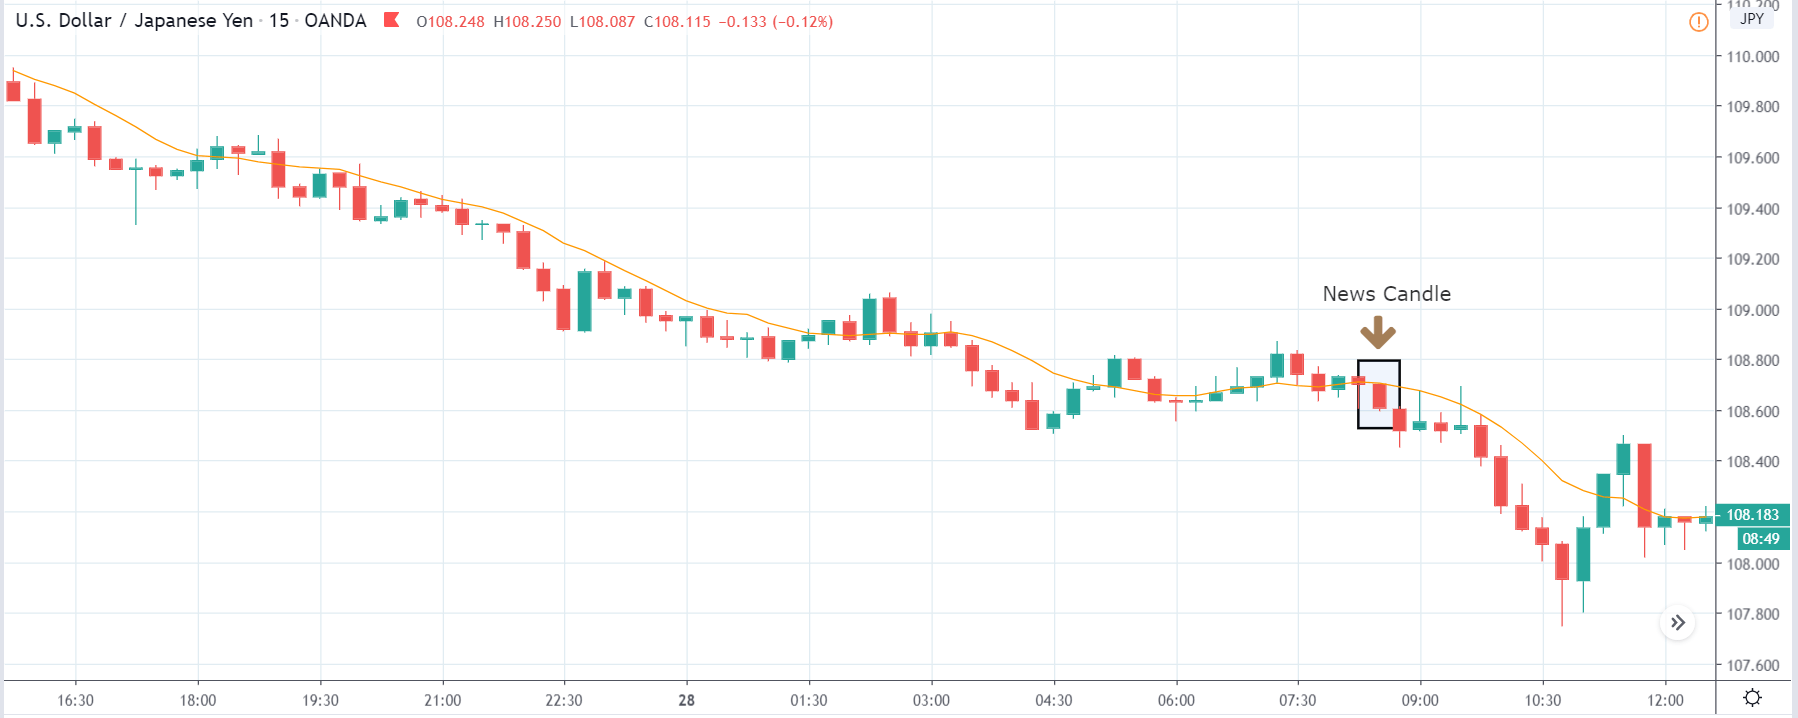
After the Personal Spending data is released, the market as expected goes lower, and volatility increases on the downside. The actual data came out to be lower than the forecasted data, and this made traders to further sell the currency pair. We can say that the poor Personal Spending data accelerated the downfall and took the currency much lower. This is the ideal and risk-free situation when it comes to taking a ‘short’ trade. Thus traders can sell the currency pair soon after the news release and have a much higher ‘take-profit‘ as the indicator has a severe impact.

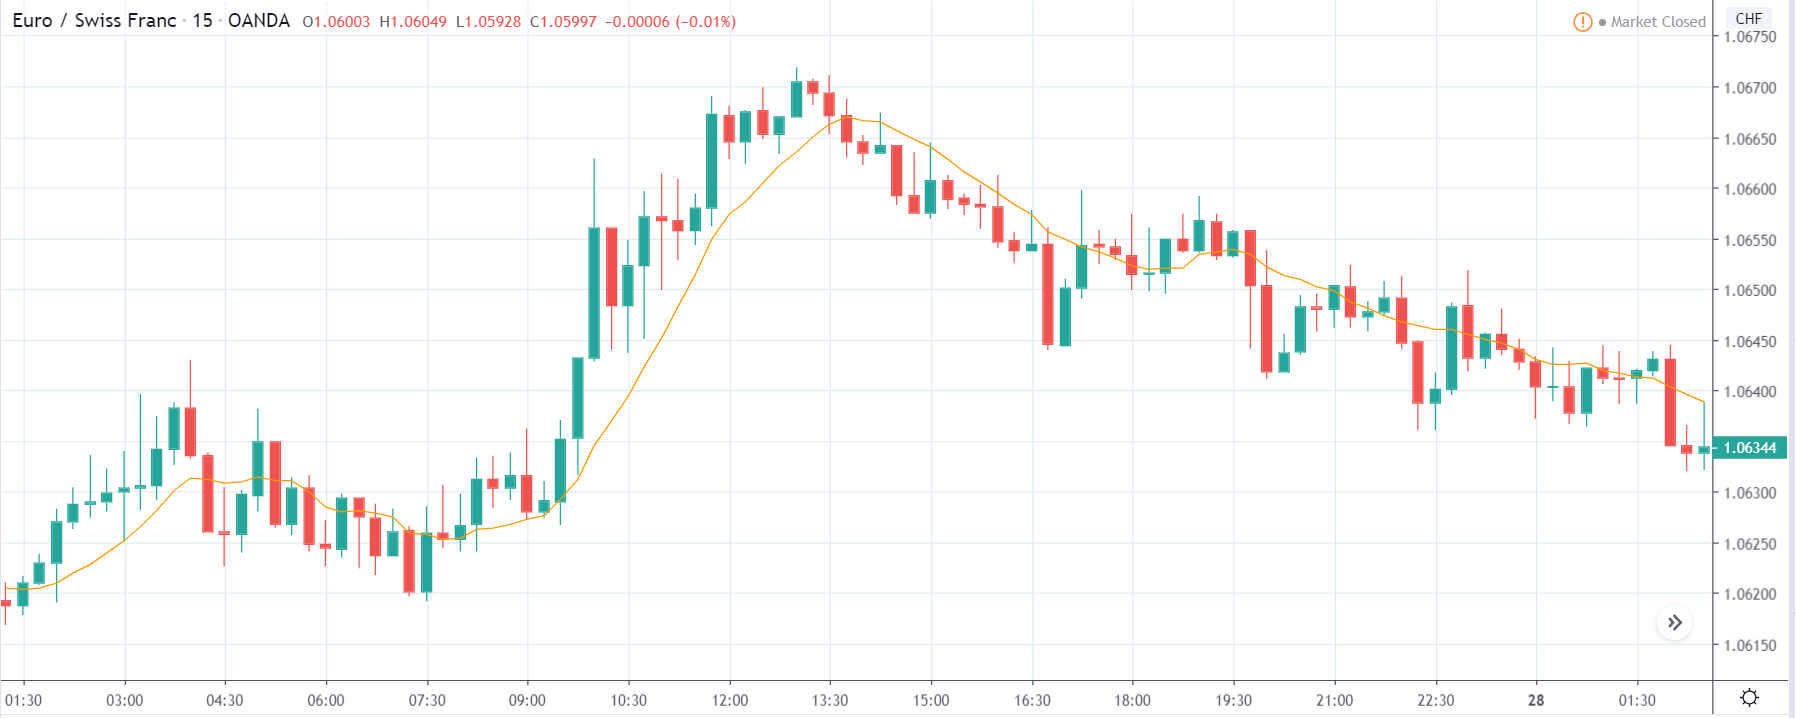
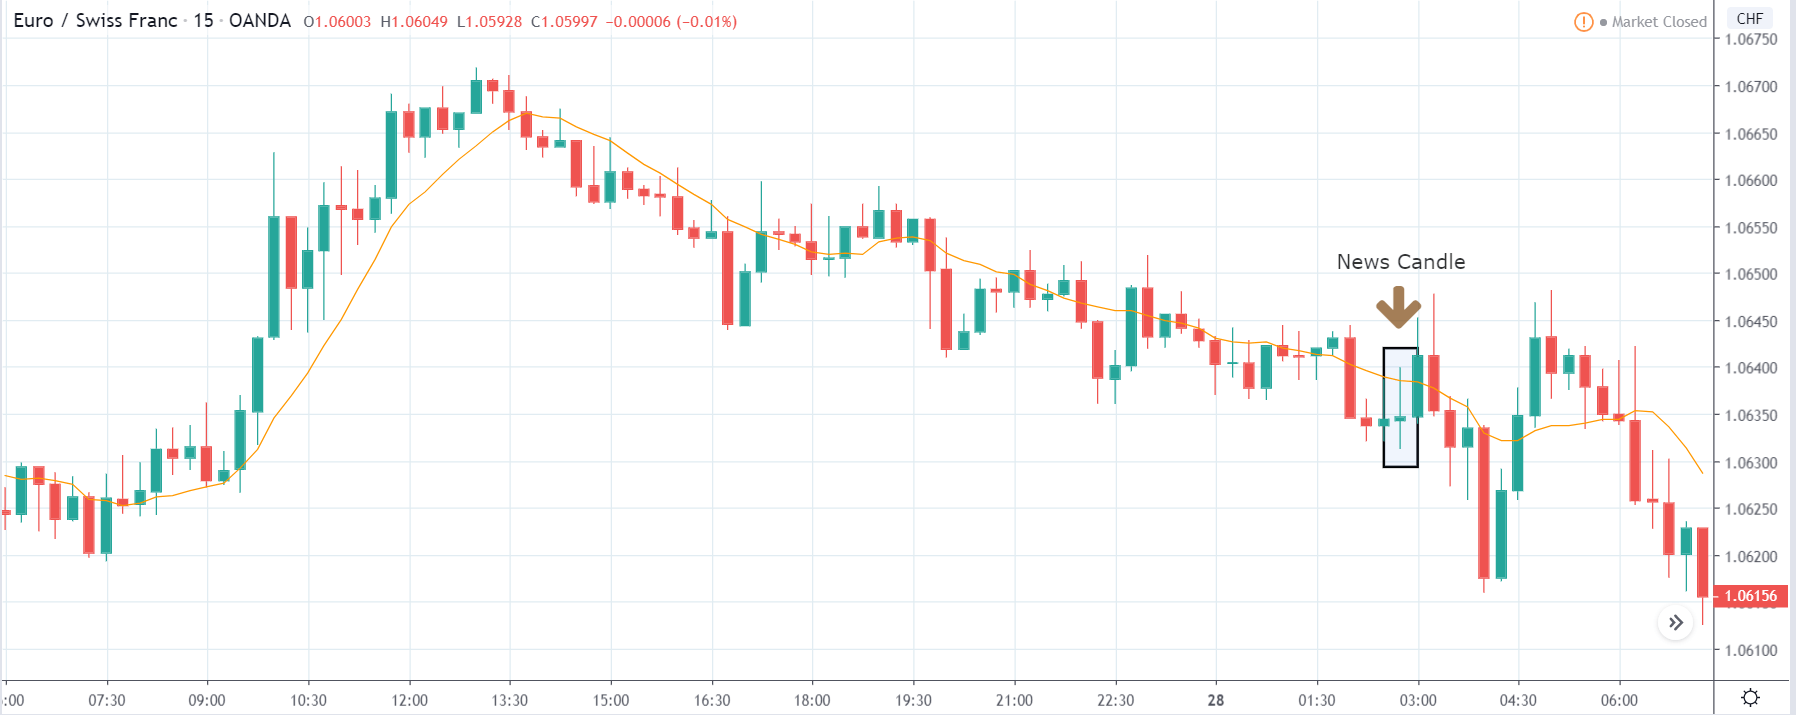
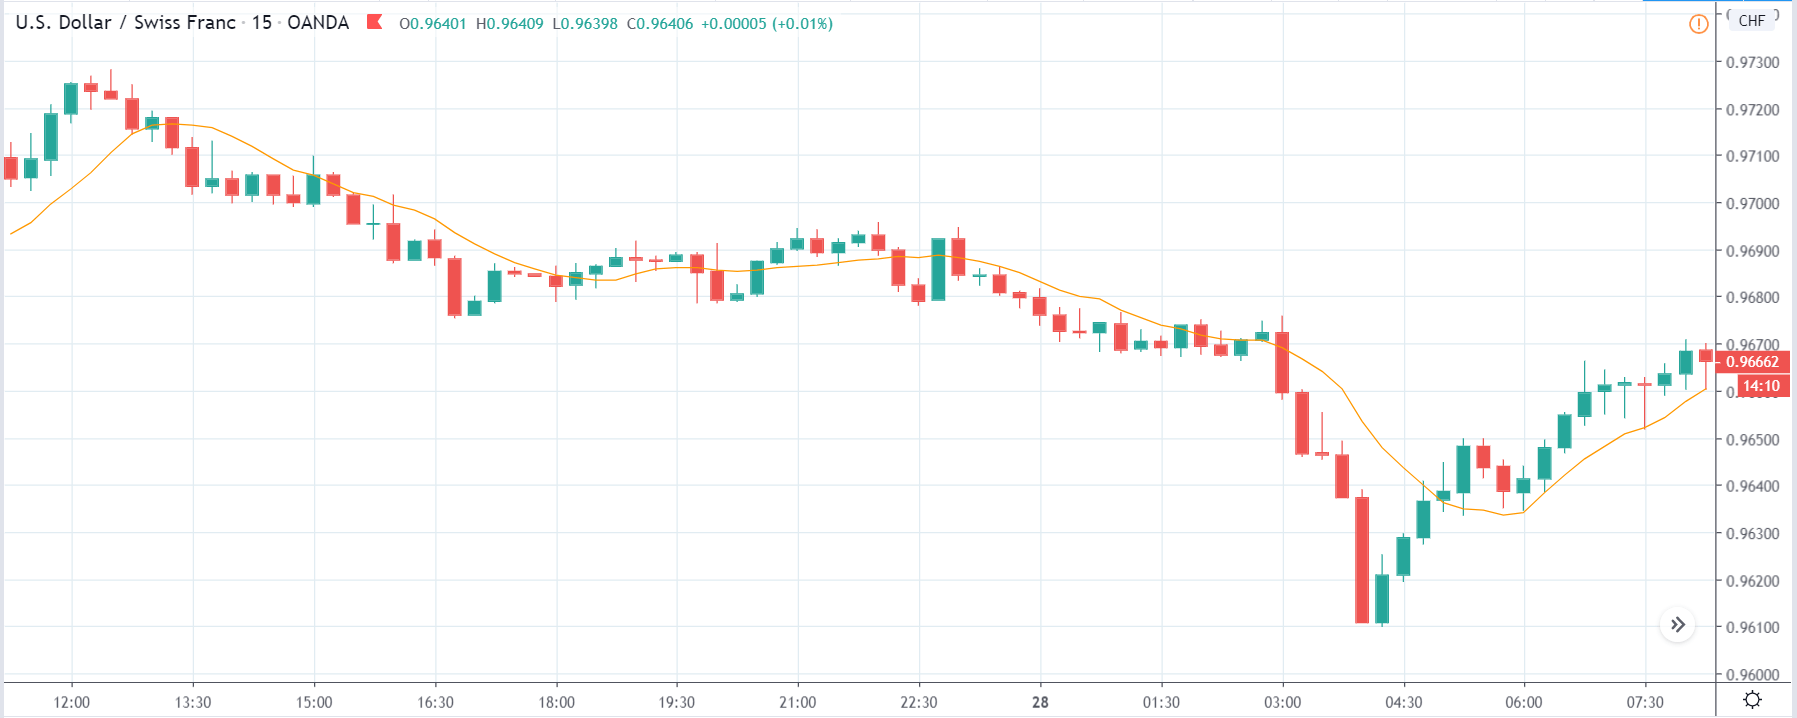
USD/CHF | Before The Announcement


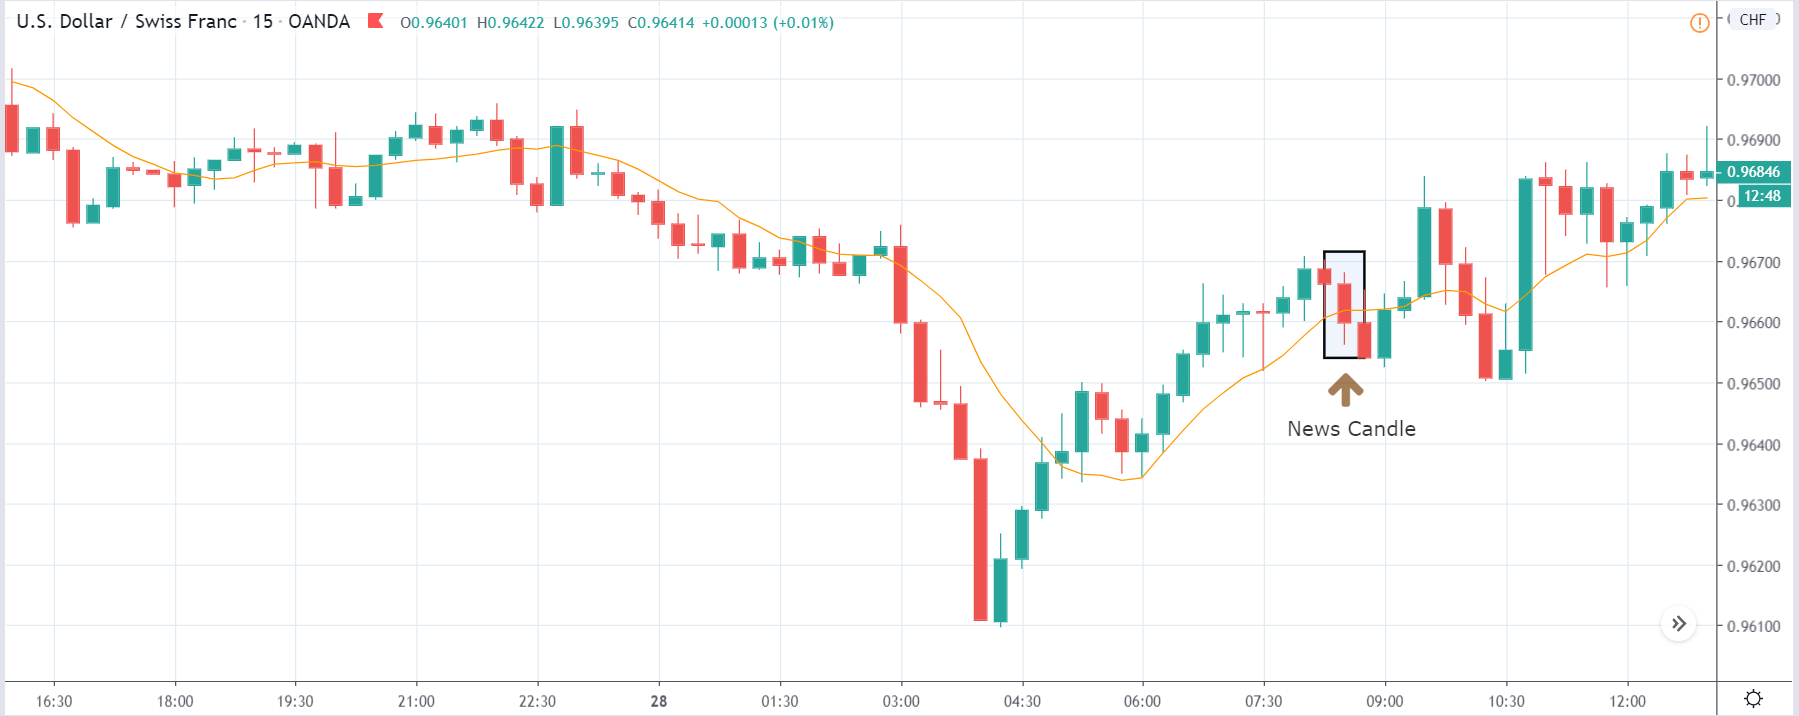
USD/CHF | After The Announcement

The above images represent the USD/CHF currency pair, where the behavior of the chart appears to be a little different from the previously discussed pair. A similarity in both the pairs is that the major trend is down. But here, the price has shown some signs of reversal before the news announcement. This could even possibly turn into an uptrend. As the volatility is high on both sides, it is advised not to carry positions in the market before the news release. One could even face issues such as high spreads and higher mark-to-market loss.

The news announcement resulted in a sudden price drop, and the market reacts negatively to the Personal Spending data. Thus the market here too gets bearish due to poor news data. As one does not see any trend continuation candlestick patterns after the news release, he/she shouldn’t be going ‘short’ in the market right after the announcement. Only after one sees such patterns, he/she can enter the market.

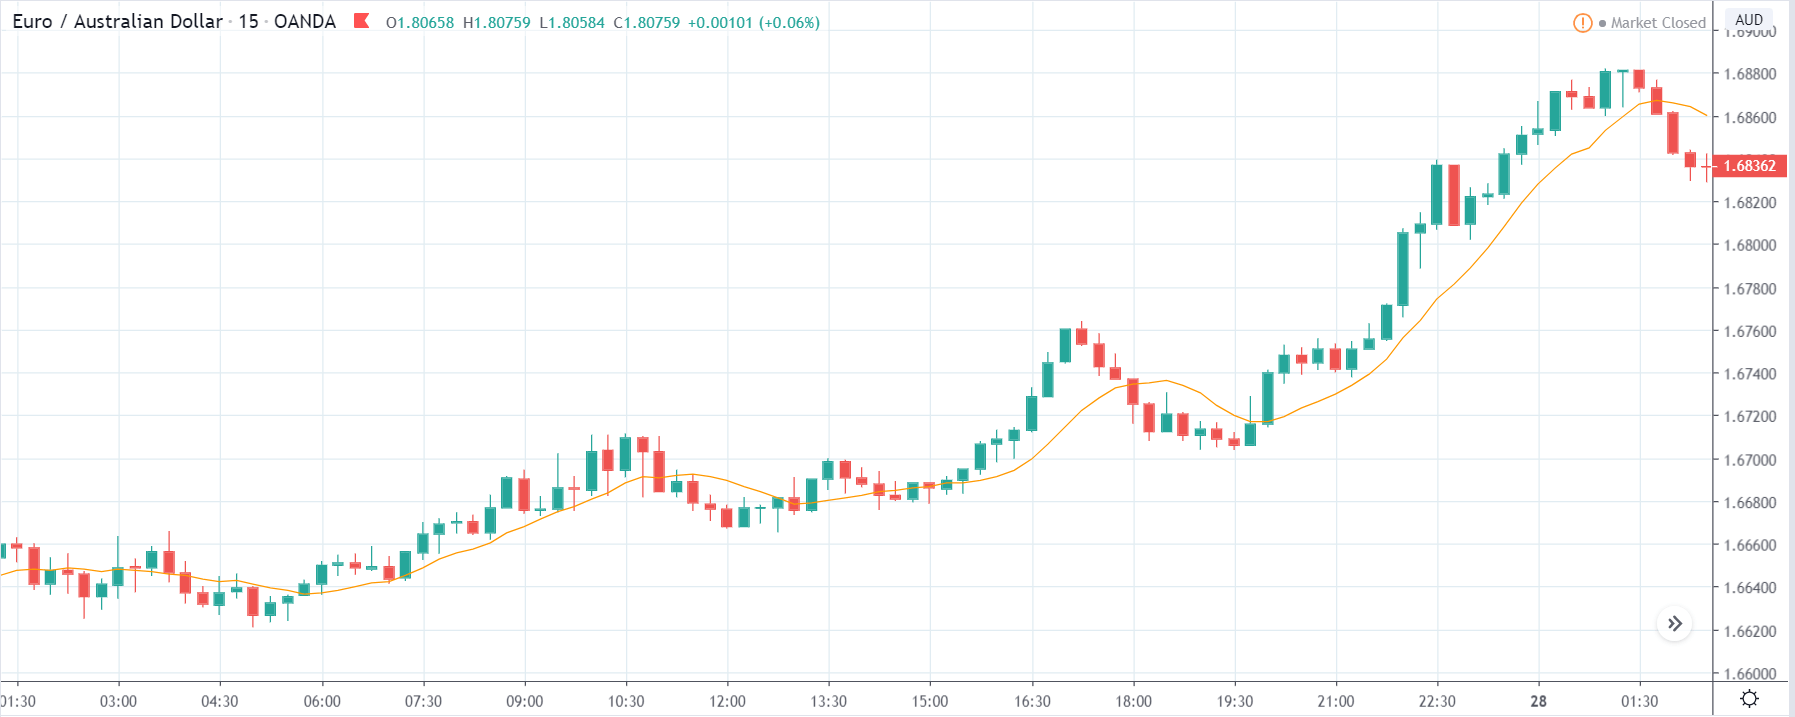
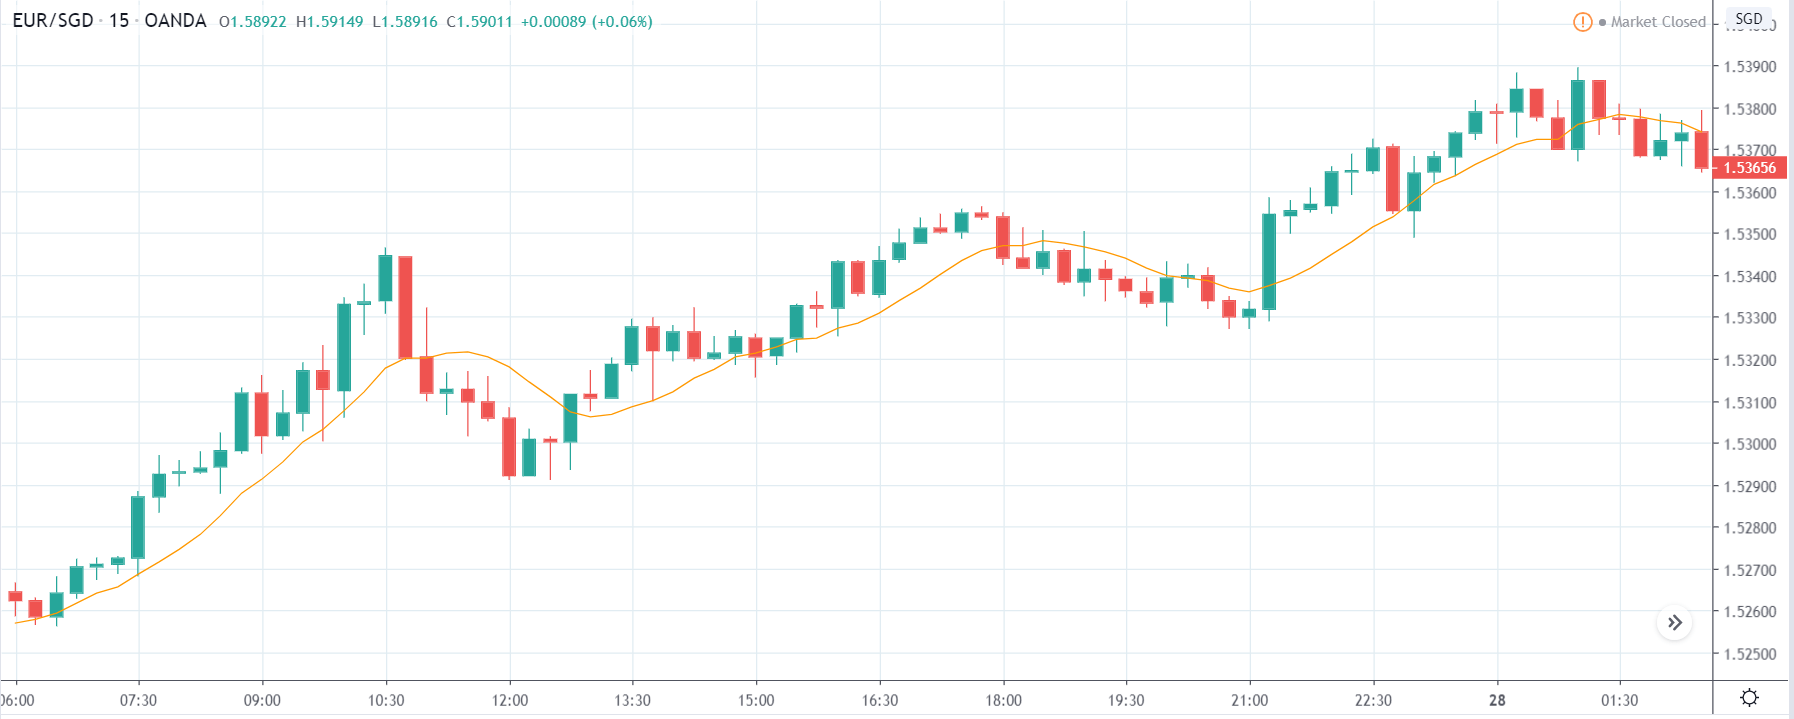
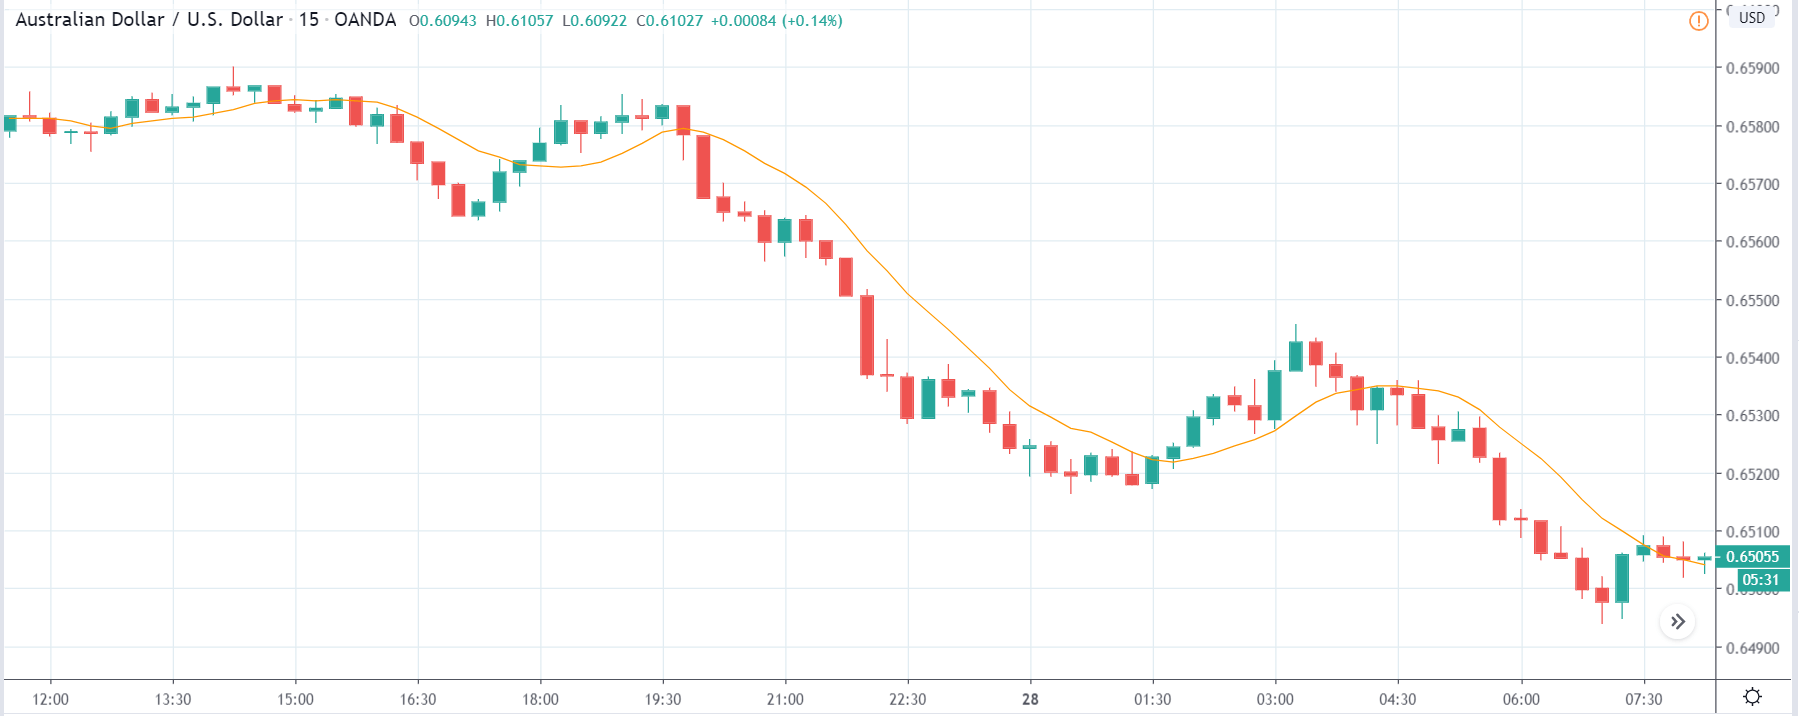
AUD/USD | Before The Announcement

AUD/USD | After The Announcement

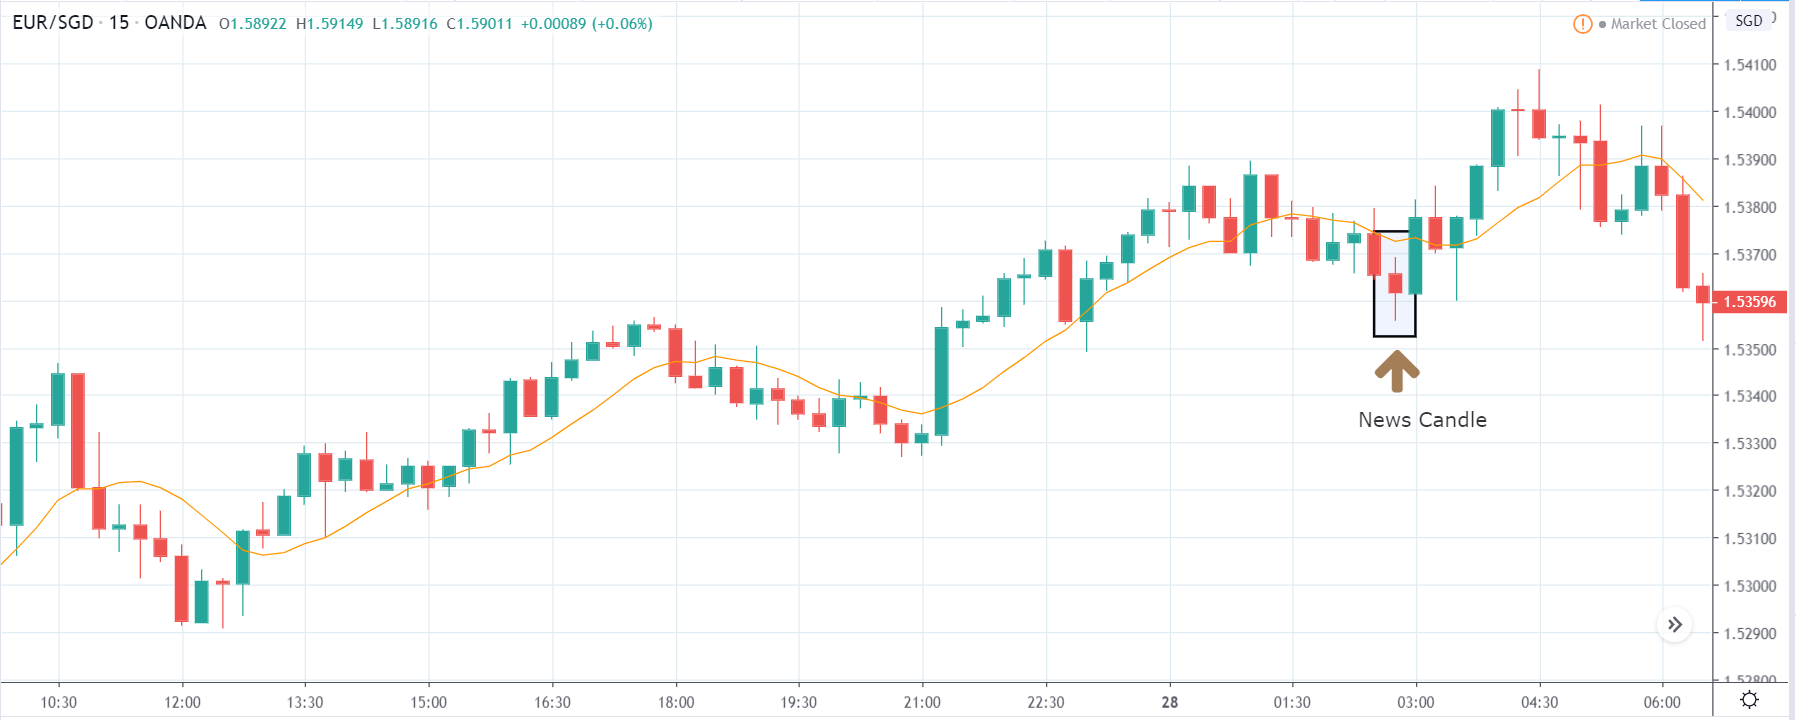
These are the images of the AUD/USD currency pair, where the characteristics of the chart are totally opposite from the above two pairs. Since the U.S. dollar is on the right-hand side, a down-trending market would mean strength in the U.S dollar. Therefore in this pair, the U.S. dollar is extremely strong contrary to the above pairs where it was extremely weak. When the volatility is so high on the downside, it is less certain that an even a negative news outcome can result in a reversal of the trend.

After the news announcement, the market moves a little higher, almost negligible, owing to bad Personal Spendings data of the U.S., but this gets immediately sold, and the ‘news candle’ closes with a  wick on the top. Therefore, we can say that the Personal Spendings data did not have a significant impact on this pair, and volatility increased on the downside.

This completes our discussion on Personal Spending and the impact of its news release on the Forex market. If you have any queries, please let us know in the comments below. Cheers.

Categories
Forex Fundamental Analysis

Importance of ‘Consumer Spending’ as an Economic Indicator

Introduction

Consumer Spending is a significant contributor to the annual GDP of an economy. It is released ahead of GDP numbers and hence is widely used by traders and investors alike to make investment decisions. Consumer Spending is what drives the economy mostly. Imagine if consumers stopped spending on anything apart from the basic needs, it would result in the closure of many businesses and services. Hence, understanding the importance and impact of this advanced indicator is crucial for our Fundamental Analysis.

What is Consumer Spending? 

Consumer Spending refers to the amount spent to meet their daily needs and personal expenses. In other words, it refers to the money paid for goods and services by the general public. The products and services can include all that we, as an individual, consume to live our lives. The groceries, the movies, the drinks, the internet, phones, etc. all these are part of our lives that the Consumer Spending measures.

The money we SPEND on CONSUMPTION of goods and services by CONSUMERS is Consumer Spending. A nation in its core is its people, and what those people spend on is what runs the market. What you and I spend on is what will drive the market. Consumer Spending makes up 66% of the total Gross Domestic Product in the United States, and business and government spending contribute to the rest.

Consumer Spending depends on the macro scale on the below vital factors:

Mortgages and Debt: In the United States, almost all the citizens have debt in one form or another, be it student loan, education loan, house mortgage, or healthcare insurances. The more the debt, the lesser the consumer has left for his spending, thereby tightening his pocket on extra expenditures.

Disposable Income: It refers to the remaining part of an individual’s income left after deductions of all federal taxes. It is the difference between the average salary and tax deductions—higher the charges lesser the money available for spending.

Per Capita Income: It tells us the income per individual within the country. Only when the overall income per person is sufficiently large enough to exceed meeting the basic requirements only then will people have a budget for spending. Rising Per Capita Income indicates that the standard of living is improving, which automatically enhances consumer spending.

Income Disparity: The imbalance in the wages of different sections of society is bad for the economy. A sufficiently rich person’s increase in income will not lead to higher spending as he or she will tend to invest or save to accumulate more wealth. Only when the wages of the lower sections of the society increase will the spending increase as they are the ones cutting back on expenditures due to lack of money. Reformation can be brought about in the country if the government focuses more on benefiting the lower sections more than other parts of the society.

Consumer Sentiment: It is the people of the nation who know better than traders and investors about the economic prospects as they are the ones working on the ground and going about their daily routine facing all kinds of situations. Whatever analysts, investors, and traders assess a nation’s economy, it cannot beat the first-hand experience of the people themselves. The Consumer Sentiment tells what the general people feel about the prospects of their jobs, growth, and security.

If a consumer feels his income will increase steadily and is secure, he will tend to spend more now. Conversely, if the consumer is not sure of his job status and not confident about his future employment status, then he or she will tend to save more to meet their needs during times of unemployment. Thereby decreasing spending now and saving more for later.

How is the Consumer Spending Report obtained?

The Bureau of Economic Analysis releases monthly reports on the percentage of changes in the average Consumer Spending titled “Personal Consumer Expenditures.” BEA releases this report at a national level on a quarterly and annual basis. The Bureau of Labor Statistics also releases a report titled Consumer Expenditure Survey in August every year with little variations. They calculate using the statistics form the United States Census Bureau to arrive at this survey report.

Is Consumer Spending important?

It is one of the most significant indicators to predict GDP. It is an advanced indicator meaning it predicts future economic conditions rather than reflecting current or past industrial activities. Since it is a significant driver for the Gross Domestic Product, it is one of the top economic indicators amongst all. Consumer Spending tells us about the strength of the economy and the standard of living of the country’s citizens.  It almost drives 70% of the GDP figure; hence there is no doubt that it is a must for Fundamental Analysis.

Below is a plot of the percentage change in Consumer Spending vs. Real GDP from the St. Louis FRED website to demonstrate this indicator’s importance in comparison to the rest.

(Chart Source)

How can Consumer Spending be Used for Analysis?

What the consumers are willing to spend on can make or break the markets. By analyzing the spending trends and recognizing what sector of goods and services consumers purchase can tell us which market is going to flourish and stagnate. Consumer Spending represents the demand side of the supply-demand market, where supply is the providers or manufacturers of the goods.

When Consumers increase spending, this increases demand, which leads to business growth, increased employment, improved wages to meet the demand. This increase will again lead to increased spending by the newly employed and adjusted salaries, and all this becomes a positive feedbacking loop and continues till it saturates. When demand outpaces supply, we will have inflation, which is terrible for the economy as the increasing prices will make consumers increase spending now than later it will again result in price inflations. The primary job of the Federal Reserve is to prevent this vicious cycle of price inflation.

On the other end, low consumer spending reduces demand for goods and services, which stagnates business and hence the economy contracts and results in lower levels of GDP, which is also not good.

Traders can use the Consumer Spending Surveys, Indices to relatively compare economic situations of nations and also with previous periods to assess currency valuation or devaluation direction in the coming months. Investors can make investment decisions based on which sectors are experiencing increased demand looking at the spending patterns. Consumer Spending can also direct us in Stock Market evaluations of different companies.

Sources of Consumer Spending Reports

We can obtain the Consumer Spending monthly releases from the BEA, and that data can be found here. For illustration, you can refer to this link to see what the U.S. population spends more on. You can also check the University of Michigan’s Consumer Sentiment Index here.  As discussed, it is a primary driver of Consumer Spending.

Impact of the ‘Consumer Spending’ news release on the price chart 

In this section of the article, we will analyze the impact of the Consumer Spending economic indicator on the value of a currency. As we understood in the previous that the Consumer Spending measures the change in the inflation-adjusted value of goods expenditures by consumers, now we shall see how important the data is for traders and investors. Consumer Spending is one of the major economic activities in a country. However, looking at the below image, it seems like traders do not give a lot of importance to the data (Yellow box indicates less important) and may not make significant changes to their positions in the currency. In any case, let us see how the market reacts to the data release.

Below is the image showing the latest Consumer Spending data of France, which will have an effect on the EURO. The National Institute of Statistics and Economic Studies collects and disseminates information on the French economy and society. A higher than expected reading is considered to be positive for the economy, and a lower than expected reading is taken to be negative.

EUR/AUD | Before The Announcement

We start our analysis with the EUR/AUD currency pair, and as we can see in the image above, the chart is a strong uptrend, and the market has retraced recently. One of the reasons behind the violent up move is that the market participants are expecting a better Consumer Spending data for the month of February. Since the market has retraced quite a bit, aggressive traders can go ‘long’ in the market before the news announcement due to optimism in the market.

EUR/AUD | After The Announcement

After the Consumer Spending data is released, the market falls, but it leaves a wick on the bottom, and the price forms a ‘Doji’ candlestick pattern, which essentially indicates indecision in the market. As the data was far below what was predicted, we should wait for more confirmation from the market to notice the change in volatility. We see that that the volatility expands on the upside and goes above the moving average. This is an indication that the news outcome is digested by the market and will continue its trend. Thus, we can enter for a ‘buy’ after the price potently moves higher with a stop loss below the ‘low’ of news candle.

EUR/CHF | Before The Announcement

EUR/CHF | After The Announcement

Next, we discuss the EUR/CHF currency pair where before the news announcement, the market is in a strong downtrend, exactly opposite to the above currency pair. As the volatility is high on the downside, we should not expect a positive Consumer Spending data to cause a reversal of the trend. Whereas, a ‘bad news’ may take the currency much lower. We cannot take any position at this point, not even a ‘buy’ as we are in a strong downtrend, and there are no signs of reversal.

After the numbers are released, it is evident from the ‘news candle’ that there is an increase in volatility on both sides, and finally, the price closes near its opening price. The long wick on top of the ‘news candle’ is an indication that selling pressure is high due to poor Consumer Spending data. Therefore, at this point, one can go ‘short’ in the pair with a stop loss above the recent ‘high.’

EUR/SGD | Before The Announcement

EUR/SGD | After The Announcement

The above images represent the EUR/SGD currency pair, where the characteristics of the chart appear to be similar to that of the EUR/AUD pair. One major difference is that the uptrend is not as resilient as in the case of EUR/AUD. Before the news announcement, the market is at the key area of resistance equals support. This is the place where most traders go ‘long’ in the market and join the uptrend. But since the volatility is high, it is recommended to wait for the news release and then act accordingly.

After the news announcement, some selling pressure is witnessed as a result of weak Consumer Spending data, and the candle closes in red. But later, the ‘news candle’ is immediately is taken over by a bullish candle. This means, due to the bad news, the market initially reacted as per expectations, but this was not sufficient enough to cause a reversal in the market. As the impact of the news was less, we can trade with the trend, by going ‘long.’

This completes our discussion on Consumer Spending and the impact of its news announcements on the Forex price charts. If you have any queries, please let us know in the comments below. Cheers.