Categories
Forex Course Forex Daily Topic

149. Trading The Fakeouts In The Most Conservative Way

Introduction

Breakout trading is prevalent among all types of traders. Professional traders make a lot of cash by trading these breakouts, while some novice traders fail to effectively trade them. While trading these breakouts, the pretty basic strategy is to pull the trigger when the price breaks above or below any significant level. But many times, the price tends to reverse its direction and cause immediate losses. This is one of the most frustrating experiences breakout traders go through.

Did this ever happen to you, and did you wonder why this happens? The reason is that you have no pre-planned entries. You are just reacting to the price action and chasing the markets purely based on your feelings, but you must accept that the market has no feelings.

How to Trade the fakeouts?

❶ Primarily, find the confluence level on the price chart. This is a place where most of the indicators point towards one direction.

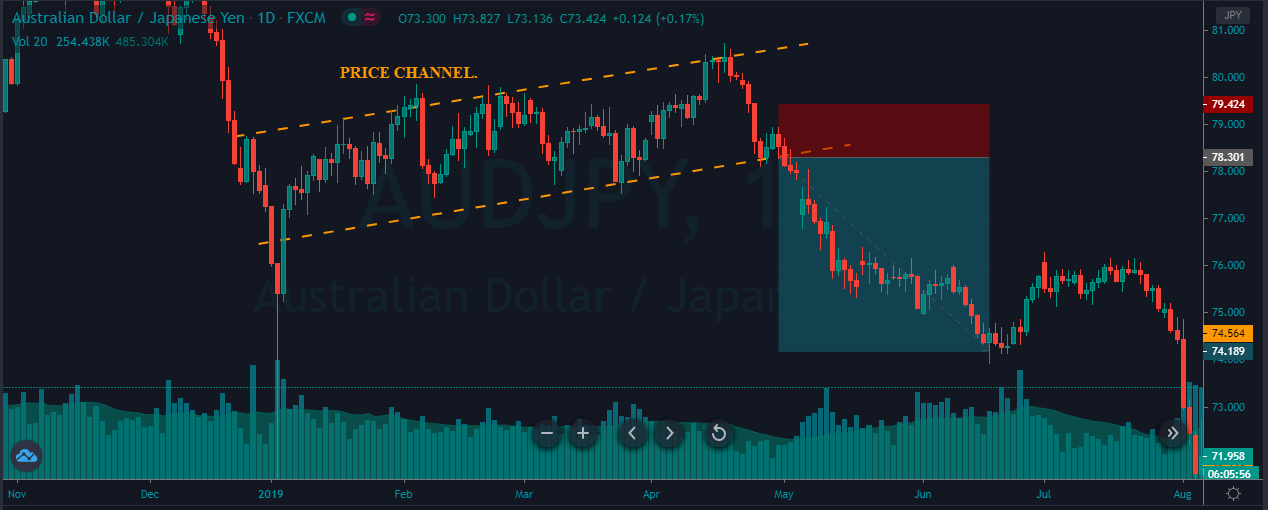
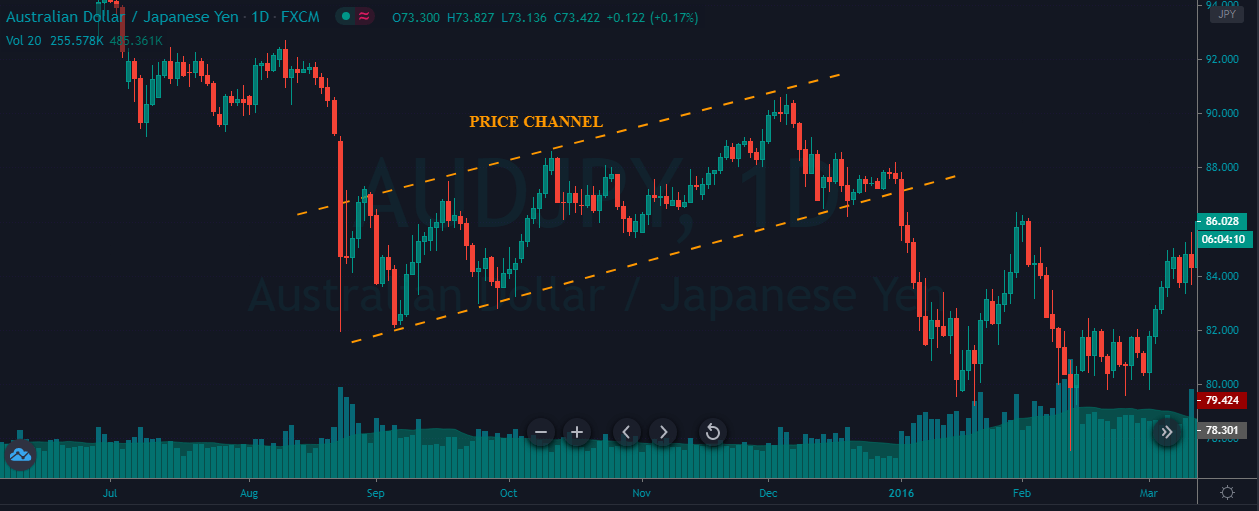
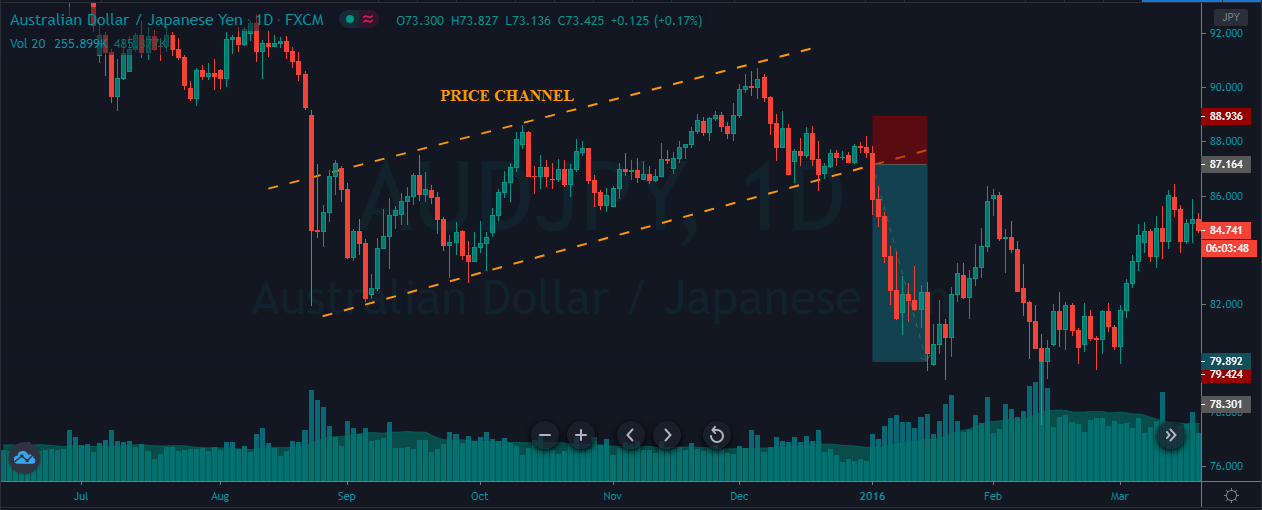
❷ Avoid trading range breakouts as both the parties hold equal power when the market is ranging. In this state of the market, the chance of spikes is very high. So it is always advisable to trade breakouts only in a trending market.

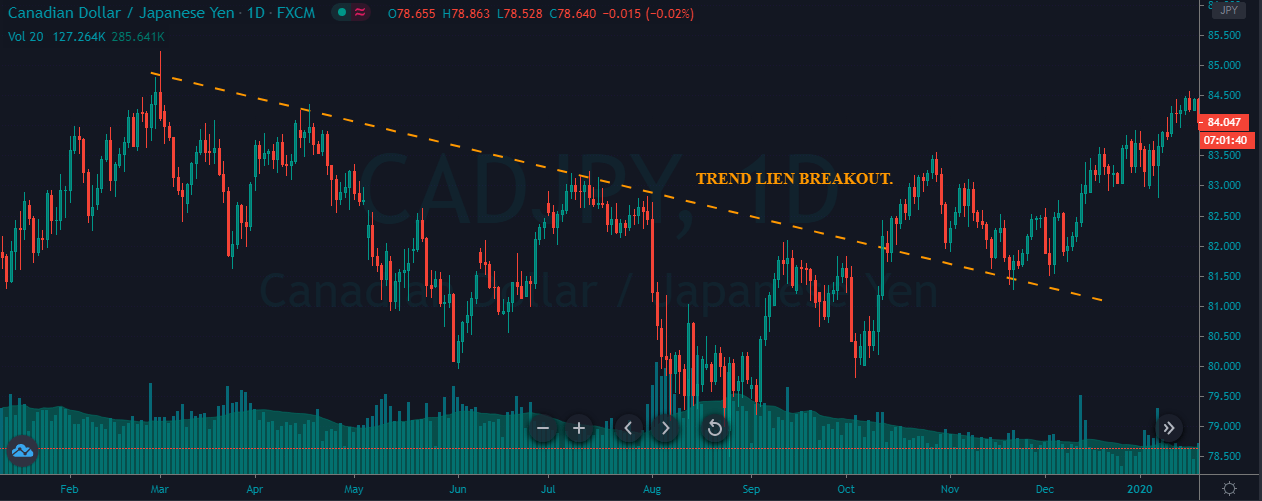
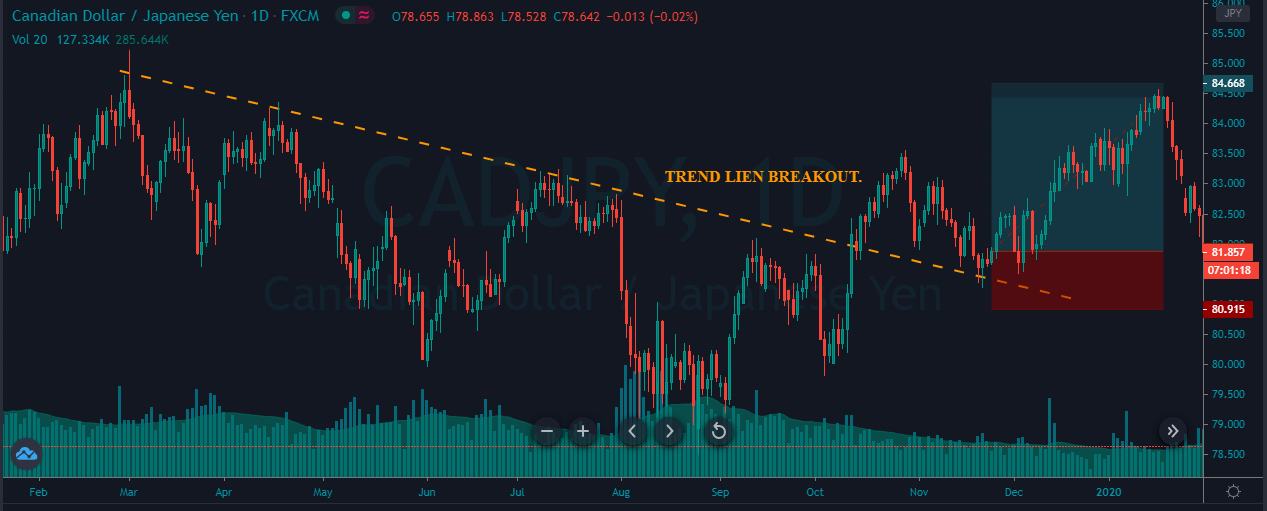
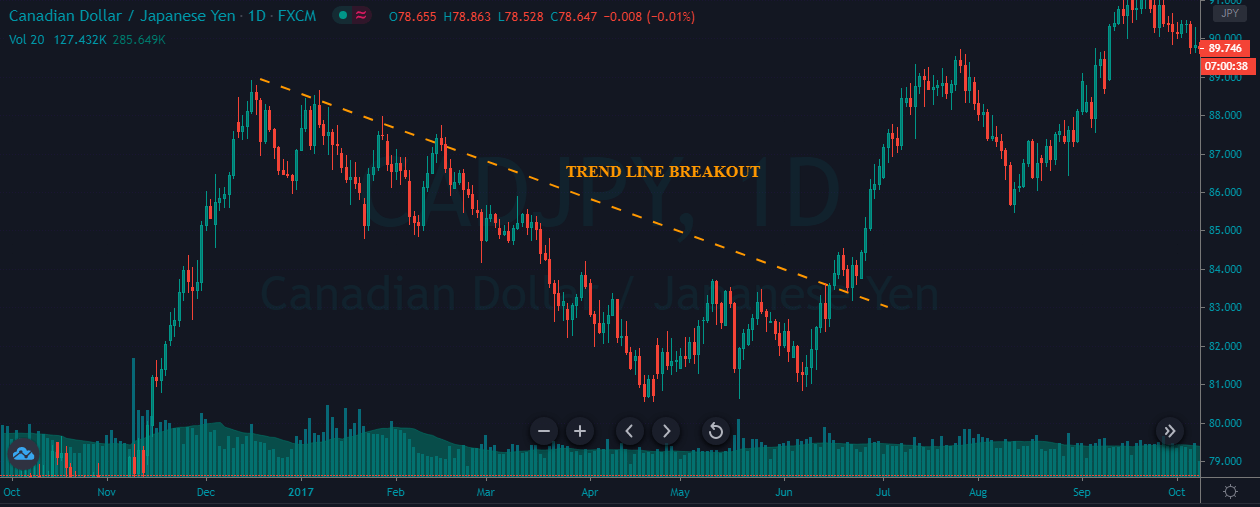
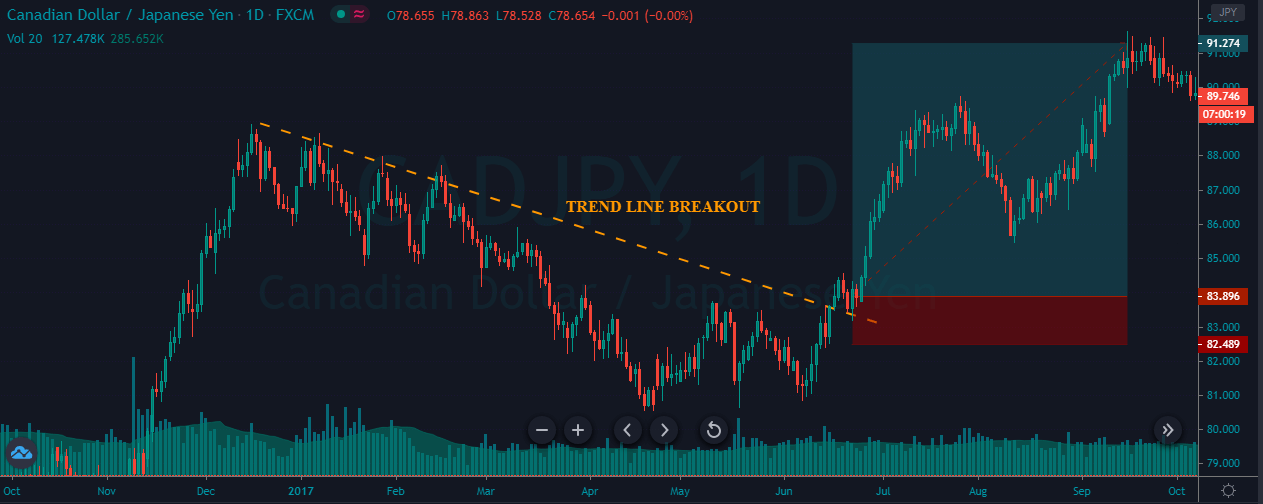
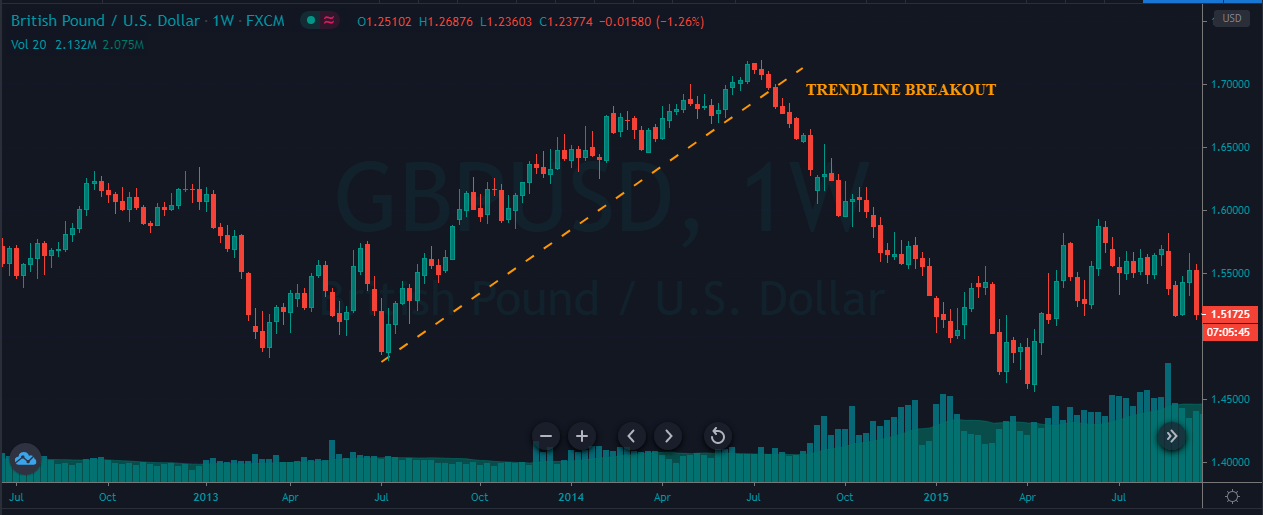
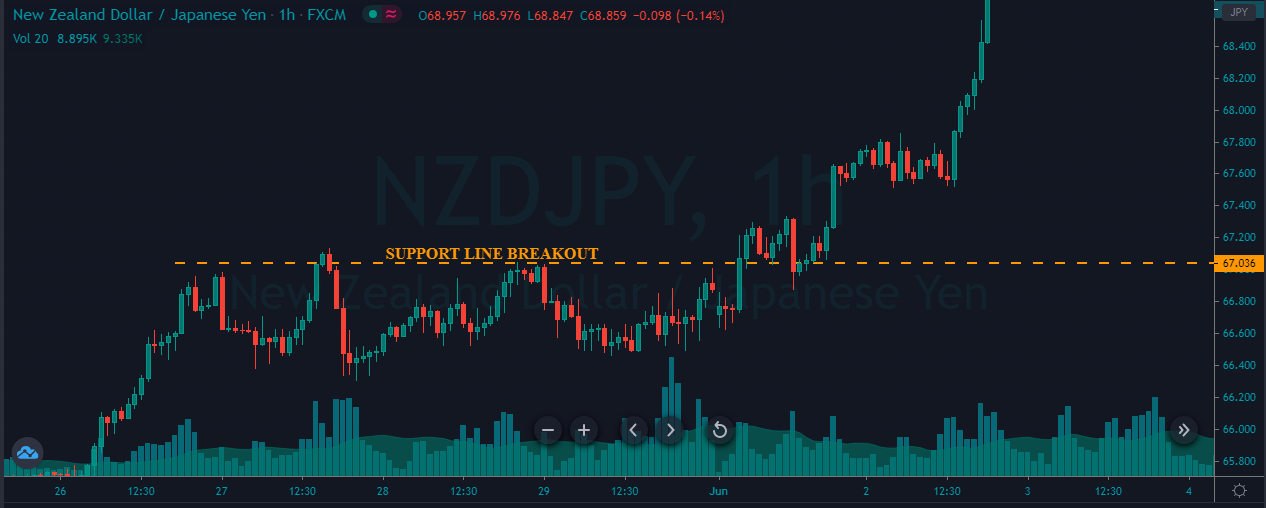
❸ Wait for the price to break above any significant level in an uptrend and break below any major level in a downtrend.

❹ Right after the breakout, wait for the price to test above or below any major level to confirm the breakout’s authenticity.

Trading Strategies

Buy Example

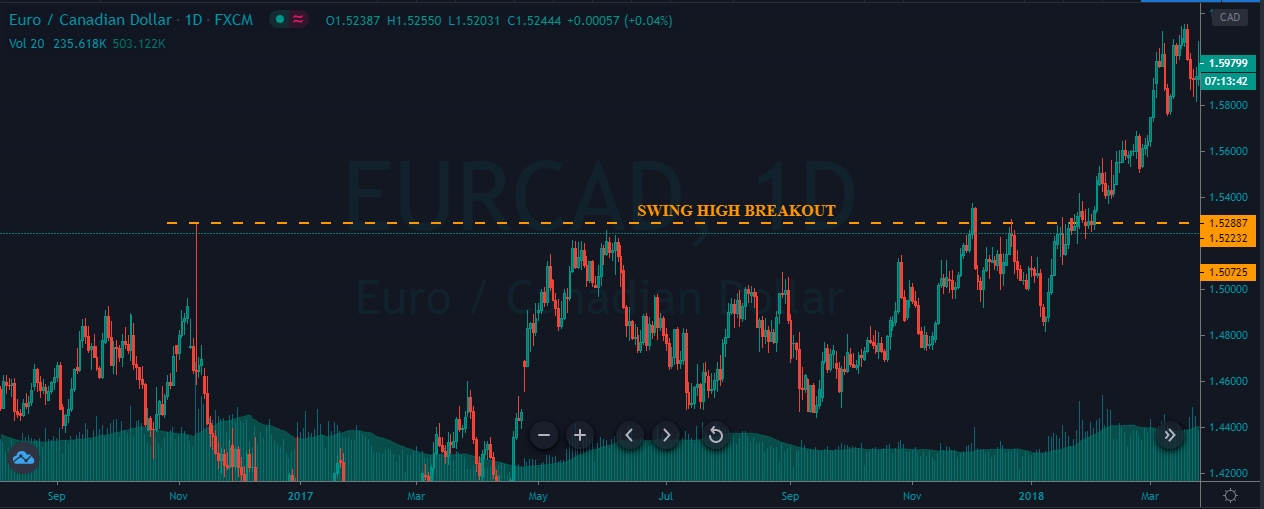
The image below represents a breakout in the EUR/CHF Forex pair.

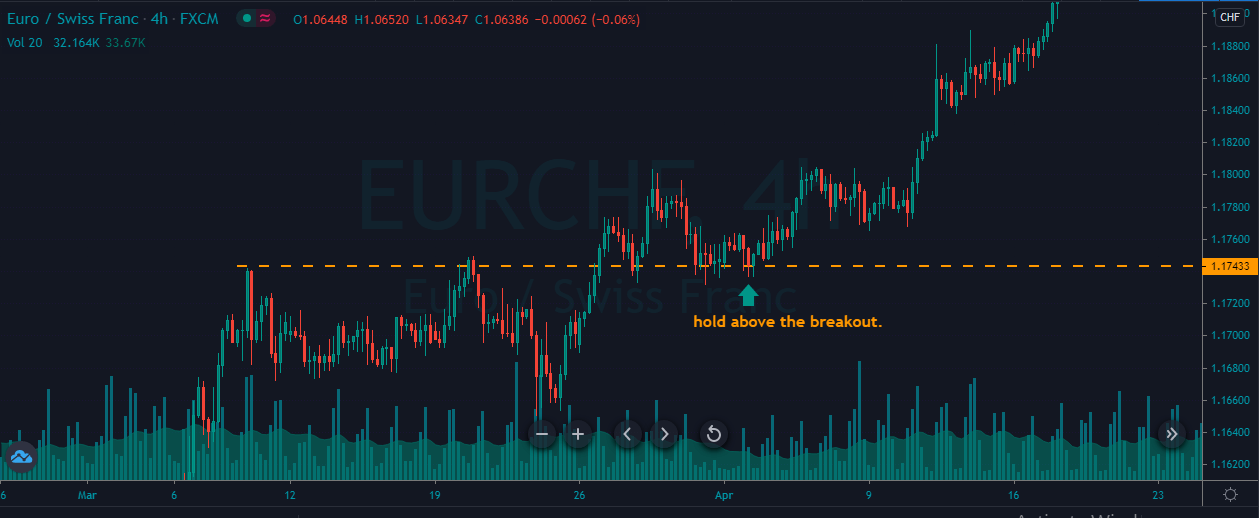
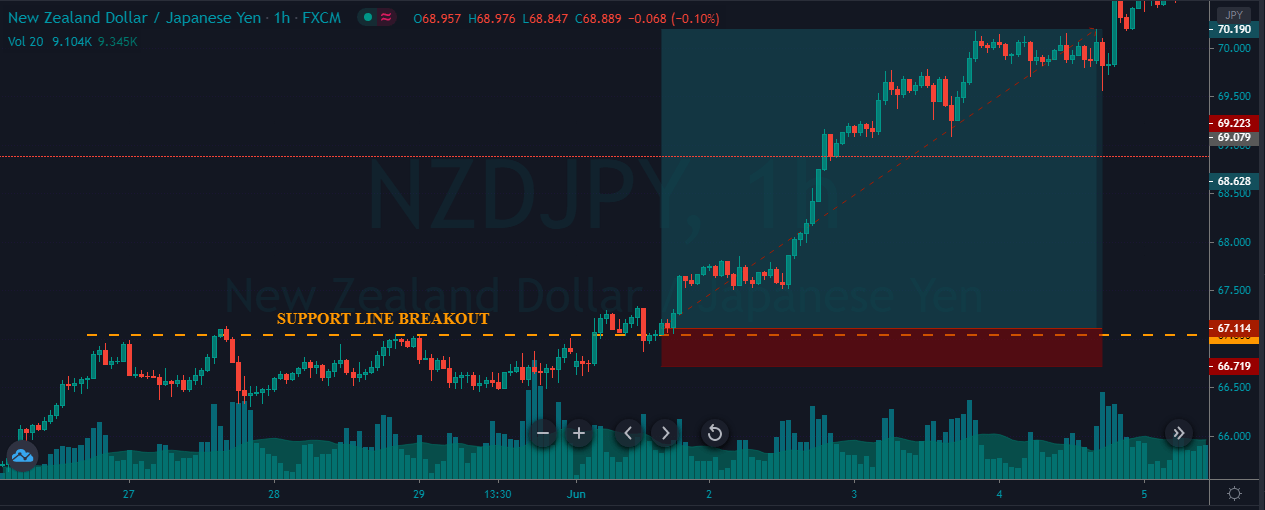
As you can see in the below chart, we waited for the price action to holds above the breakout line. We have only entered the market after we confirmed the breakout. If the price action fails to hold, it simply means that it was a fakeout, and we can ignore it completely.

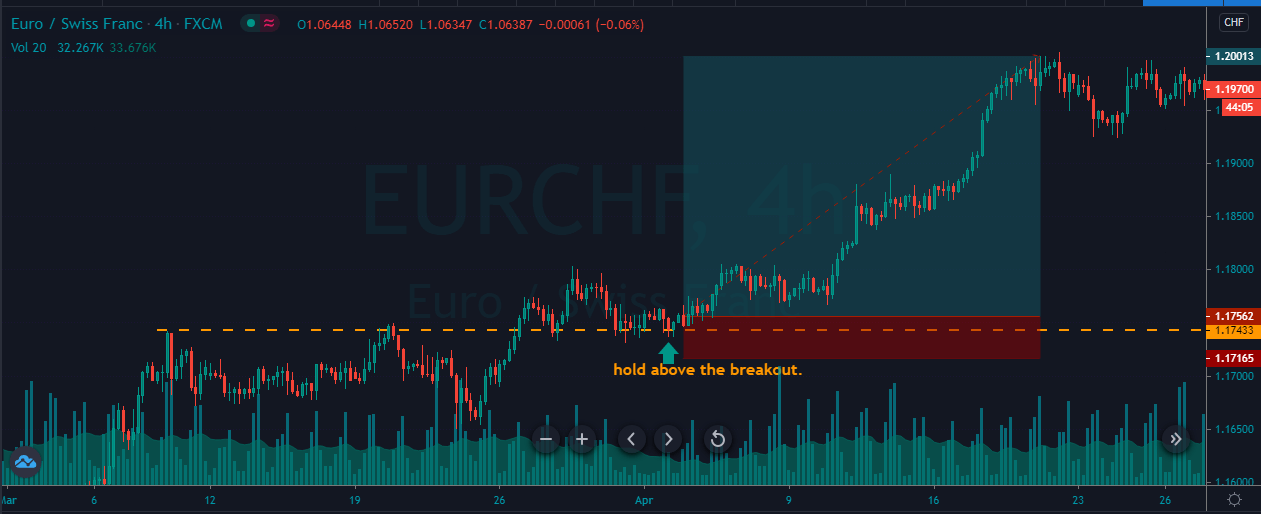
In this example, prices held above the breakout, which confirms the validity of the breakout. We took entry at the breakout line and chose to go for a brand new higher high. The exit was purely based on the higher timeframe’s significant resistance area, and the stop loss was just below our entry.

Sell Example

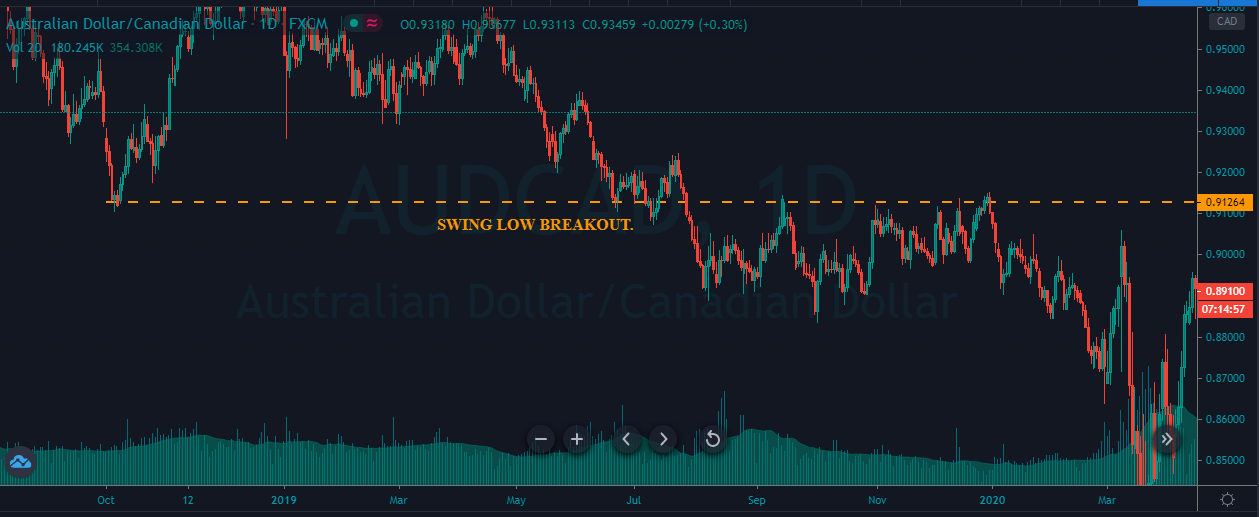
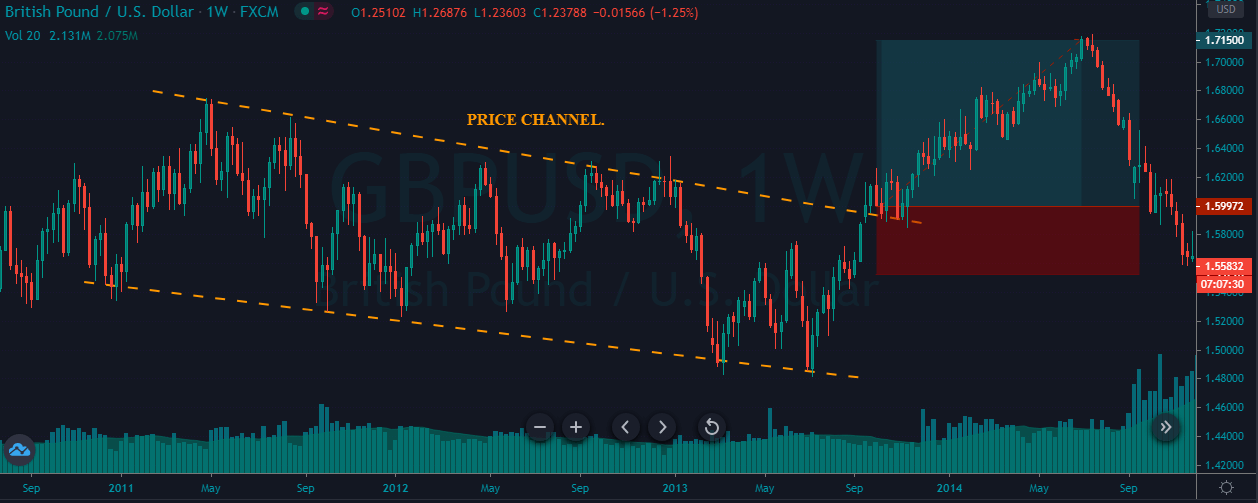
The image below represents a sell breakout in the GBP/NZD forex pair.

In the below image, we can see the price holding below the significant resistance level, which confirms the breakout. Our entry was at the red candle at the significant resistance level. The price sharply rejects to go any higher. Now we can see a brand new lower low forming after our entry.

The stop-loss is placed just above the entry as the seller response was quite aggressive. When the price started to struggle and failed to go down further, we chose to close our trade.

This is one of the best ways to trade the fakeouts in the most conservative way. We hope you got a clear understanding of this concept. Please let us know if you have any questions in the comments below. Cheers!

[wp_quiz id=”92087″]
Categories
Forex Course

145. Trading The Triangle Pattern Breakouts

Introduction

Breakouts trading and trading the triangle chart pattern are two different trading tools. A breakout occurs when the price goes above or below the significant support resistance area. It indicates that the price is ready to move in the direction of the breakout, and any entry near the breakout will be fruitful. This is the reason why breakout trading is considered a leading method of trading in the industry as it helps the traders to anticipate the trend and ride the potential moves.

On the other hand, the Triangle is a technical chart pattern. The best description of the triangle chart pattern is as a horizontal continuation chart pattern, which helps the traders in finding the best entry on the price chart. At the beginning of the pattern, it is widest, and as the market continues the ranging move, the price starts to move in a limited, narrow range, and as a result, we witness the point of the Triangle on the trading chart.

The Trading Strategies

There are two types of triangle chart patterns. The first one is ascending chart pattern, and the second is the descending chart pattern.

Ascending Triangle Chart Pattern

Ascending Triangle is a bullish chart pattern that helps traders to take buy trade in an ongoing uptrend. The image below represents the formation of an Ascending Triangle chart pattern in the CAD/JPY Forex pair.

The image below represents our entry, exit, stop-loss, and take-profit in the CAD/JPY forex pair. As you can see, in an uptrend, when the price broke above the chart pattern line, it is a sign that the buyers are strengthening. Therefore, if the price is holding above the support line, it is an indication for us to go long in this pair.

Right after our entry, we can see that the price smoothly ran towards the north, and printed a brand new higher high. We can close our trade based on any nearest support area, and we also can use any indicator for the exit. The stop-loss order was placed just below the entry. In a strong trending market, the smaller stops are good enough to ride the trend.

Descending Triangle Chart Pattern

The Descending Triangle is a bearish chart pattern that helps traders in taking sell trades in an ongoing downtrend. The image below indicates the formation of a Descending Triangle pattern in the GBP/CAD Forex pair.

The below price chart of the GBP/CAD pair represents our entry, exit, and stop-loss. In a downtrend, when the price breaks below the support area, it’s a sign that the strong buyers failed to push the price higher, and any hold below the resistance line is an indication to go short. Soon after our entry, price blasted down south, printing a brand new lower low.

The descending Triangle is simple and easy to trade Forex chart pattern. Most of the time, this pattern offers excellent risk to reward entry trades. So when you see the pattern on the price chart, don’t forget to scale your position for more significant gains.

That’s about trading the ascending and descending Triangle chart pattern breakouts. Take the below quick quiz before you go. Cheers.

[wp_quiz id=”85881″]
Categories
Forex Course

144. Trading The Channel Breakouts In The Forex Market

Introduction

Breakout trading is one of the easiest and most common and smartest ways to trade the market. It doesn’t matter whether you are a scalper, intraday trader, investor, or a swing trader; you can always make money in the market if you master the breakout trading only.

Breakout trading is an attempt to enter in the market when the price action moves outside the significant price range, most of the time it takes an immense amount of power to break the significant areas, and you will always witness the spikes, fake-outs near the breakouts, this is because both of the parties tries to dominate the shows.

What is a Price Channel?

A price channel is a state of the market that connects the swing high and swing higher lows in an uptrend. Conversely, in a downtrend, it connects the swing low and lower low. The upper trend lines act as a resistance to the price action, and the lower trend lines act as a support line on the price chart. The price respects these areas by staying inside the price channel. When the opposite party becomes dominates, then we witness the breakout in a channel.

Trading Channel Breakouts

Buy Trade 1

The price chart below represents a channel breakout in the CAD/JPY forex pair.


As we can see, the sellers are getting weaker in the channel, and as a result, soon after the breakout price action changed its trend. So, around 81.55, the price action broke to the north and printing a brand new higher high.

Buy Trade 2

The image below represents the formation of a price channel in the CAD/JPY forex pair.

As we can see, the below price chart represents our entry-exit and stop loss in this pair. So during the downtrend, both buyers and sellers were holding equal power. Near to the 78.00 area, price action broke to the north, and after the breakout, we took a buy-entry. After our entry, the price made a brand new higher high, but the hold at the most recent higher high convinced us to close our trade at the 88.37 level.

Sell Trade 1

The image below represents the formation of a Price channel in a downward trend.


The image below represents our entry, stop loss, and take profit in this Forex pair. The channel is typically formed when there is no trend, or when the trend is about to end. On a lower timeframe, we can trade inside the Channel, but on this timeframe, the break below the 78.30 level indicates that the sellers stole the show, and are ready for a brand new lower low.

Sell Trade 2

The image below represents a channel breakout in the AUD/JPY Forex pair.

Right after the price action approaches the most recent support area, it just got shot down and broke below the Channel. The strong red breakout candle is an indication for us to go short in this pair and right after our entry, we have witnessed a brand new lower low.

Trading channel breakouts is this simple. But minute details like drawing channel lines accurately is crucial. Let’s learn more breakout trading techniques in the upcoming lessons. For now, don’t forget to take the quiz.

[wp_quiz id=”85204″]
Categories
Forex Course

143. Trading Breakouts Using Trend lines

Introduction

In our previous course lessons, we saw how to trade breakouts in an effective manner. As we know, Breakout trading is one of the most common ways of trading the financial markets. Most of the other trading tools tend to fail in accurately identifying a trading signal, or they lag a lot in doing so. But that’s not the case with breakout trading. If done accurately, it helps traders in making consistent cash from the market.

In this lesson, let’s learn how to trade breakouts using trendlines. Trendlines are one of the simplest tools you can use to trade the breakouts on both lower and higher timeframes.

Trendline and it’s working!

A trend line highlights the ongoing trend by connecting the swing lower highs in an uptrend and swing higher lows in a downtrend. Just like S&R levels, trendlines also signify the appropriate areas to enter the market. The only difference is that support and resistance levels are horizontal areas while trendlines are sloping. Now let’s get to the topic.

Trading Breakouts Using Trendlines

Upward Trendline

An upward trend line connects a swing high to swing low from the lowest point to the highest point in an ongoing trend.

Buy Trade 1

The price chart below represents a trendline Breakout on the daily chart.


By looking at the market, it is clear that the sellers had a hard time going down as the buyers continue to give a strong fight. After a couple of months, sellers gave up, and buyers took the show to break above the trend line. The hold above the trendline confirms the buying entry in this pair. After riding the uptrend for a bit, we understood that the buyers got weak. Hence we decided to close our positions at the most recent higher high.

Buy Trade 2

The image below represents a trendline breakout in the CAD/JPY forex pair.

The pair was in a strong uptrend, and during the pullback phase, when the price action broke above the trend line, it indicates that the buyers are ready to lead the market again. The hold above the trendline confirms our buy entry. The original trend was quite strong, so the stop below the trend line was good enough to ride a new trend.

Downward Trendline

Downward trend line connects a swing low to swing high from the highest point in a trend to the lowest point in a trend.

Sell Trade 1

The chart below represents a trendline breakout in the GBP/USD Forex pair.

As we can see, the buying trend was quite strong, and the price action closely followed the trendline. A breakout below the trendline is a clear indication for us to go short in this pair.

Sell Trade 2

The price chart below represents the breakout of a trend line in the GBP/USD Forex pair.

We can see the pullback on a weekly chart, and during the pullback, the price broke below the trendline. This shows that the sellers are desperate to take the price down. After our entry, the price went down and turned sideways. After a few weeks, it again goes down, and we choose to close our trade at the most recent lower low.

This attempt is to give you an understanding of how to trade trendline breakouts in most of the scenarios. In our upcoming lessons, let’s delve deeper into this concept. Cheers!

[wp_quiz id=”83527″]
Categories
Forex Course

142. Different Types Of Breakouts & How To Trade them?

Introduction

As discussed in the previous lesson, a breakout is the price action that goes above or below a significant level on the price chart. As a breakout trader, we must enter a long position after the price breaks above the resistance, and enter a short position after a price action breaks below the support. After the breakout, the volatility of the price tends to increase as most of the traders prefer entering the market to ride the upcoming trend.

There are different types of breakouts, such as channel breakout, head and shoulder breakout, triangle breakout, flag pattern breakout, etc. In this lesson, we have shared a few of the breakout strategies that you can use to trade the Forex market effectively.

Resistance Breakout

The below price chart represents a Resistance breakout on the NZD/JPY Forex pair.

It is evident that the market was quite volatile, and after the breakout, it just goes down. So during the breakout, there was no entry. The price action then came back to the resistance area, and we ended up going short in this pair. The take-profit was placed at the most recent lower-low. We chose the most recent lower low because both the parties were strong, and we expected another buying push. You can go for a brand new lower low or higher high as well. Always place the stops just above the support area.

Support Line Breakout

The below charts represent our buy entry in the NZD/JPY Forex pair.

As you can see below, we took a buy entry when the price action broke above the significant support area. Right after our entry, the market just blasted to the north, printing a brand new higher high. The reason why the market moved so much is because of the overall buying trend being super strong.

It is a common perception that support and resistance are just significant levels, but they do not provide good trading opportunities, but this is not true. If we filter out all the bad signals and only trade the S/R signals when the price action is strong enough, those trades often provide an excellent risk to reward ratio trades.

Swing High Breakout

The image below represents a swing high breakout on the daily chart.


Swing high Forex strategy is specially developed for the higher timeframe traders. We look for the breakout of the most recent higher high. Most of the time, the higher timeframes takes nearly 2 to 3 months for a complete pullback. So to break the most recent higher high, the price action needs a lot of power in order to print a new higher high.

The moment we get a new higher high, it indicates the strength of the buyers, and we must expect the formation of a brand new higher high. In the below image, we took the trade at the breakout of the higher high, and trade it took nearly two months to hit the take profit.


Swing Low Breakout

The image below represents the breakout of the swing low on the AUDCAD Forex pair.

As you can see, we took a sell-entry in this pair when the price action broke the most recent lower low. After our entry, price action didn’t blast to the north. Instead, it goes sideways for a couple of months and finally printed a brand new lower low.

Flag Pattern Breakout

The image below represents the price breaking the Flag pattern in the EUR/CAD Forex pair.

The Flag pattern is the most common and widely used to trade potential breakouts. Basically, the appearance of Flag indicates a trending market situation, and a breakout of the pullback will be a great idea to go for the brand new higher high. As we can see, after our entry at breakout, price action went north and prints a brand new higher high.

Channel Breakout

The image below represents a channel breakout in the GBPUSD Forex pair.

We can see the price struggling to make any significant moves and hence formed a channel. After the buy-side breakout, the price went in the north direction, forming a brand new higher high. While trading channel breakouts, it is good enough to place the stops below the breakout line. Since the breakout line acts as a dynamic support and resistance level, the price it needs an immense amount of power to break that level. So placing our SL-order there, is a great idea.

That’s about different types of breakouts and how to trade them. If you have any questions, please let us know in the comments below. Don’t forget to take the quiz before you go!

[wp_quiz id=”82725″]