Introduction
Breakout trading is one of the easiest and most common and smartest ways to trade the market. It doesn’t matter whether you are a scalper, intraday trader, investor, or a swing trader; you can always make money in the market if you master the breakout trading only.
Breakout trading is an attempt to enter in the market when the price action moves outside the significant price range, most of the time it takes an immense amount of power to break the significant areas, and you will always witness the spikes, fake-outs near the breakouts, this is because both of the parties tries to dominate the shows.
What is a Price Channel?
A price channel is a state of the market that connects the swing high and swing higher lows in an uptrend. Conversely, in a downtrend, it connects the swing low and lower low. The upper trend lines act as a resistance to the price action, and the lower trend lines act as a support line on the price chart. The price respects these areas by staying inside the price channel. When the opposite party becomes dominates, then we witness the breakout in a channel.
Trading Channel Breakouts
Buy Trade 1
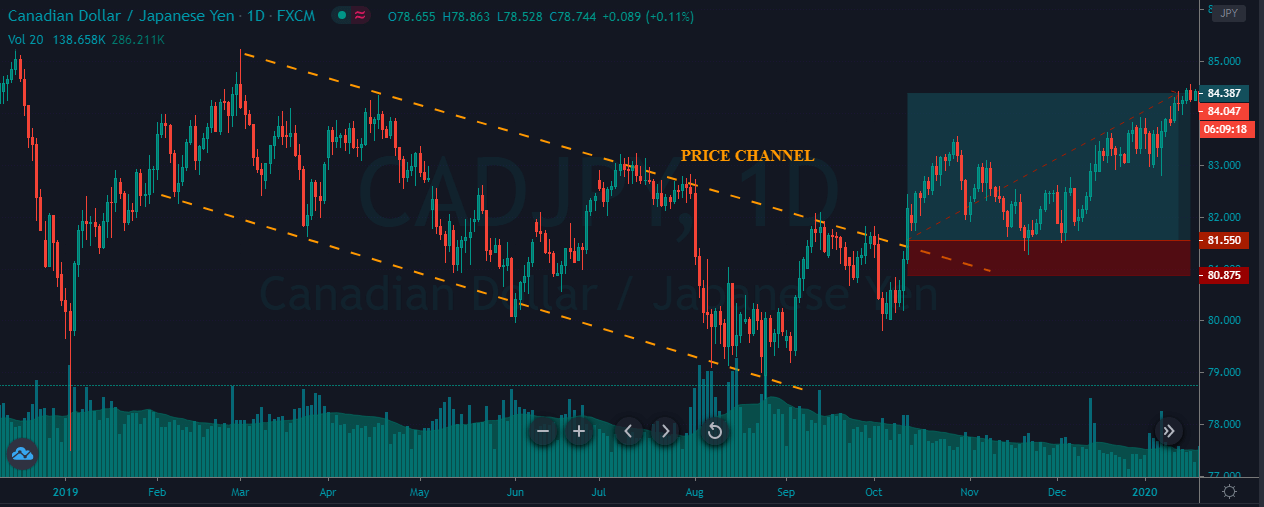
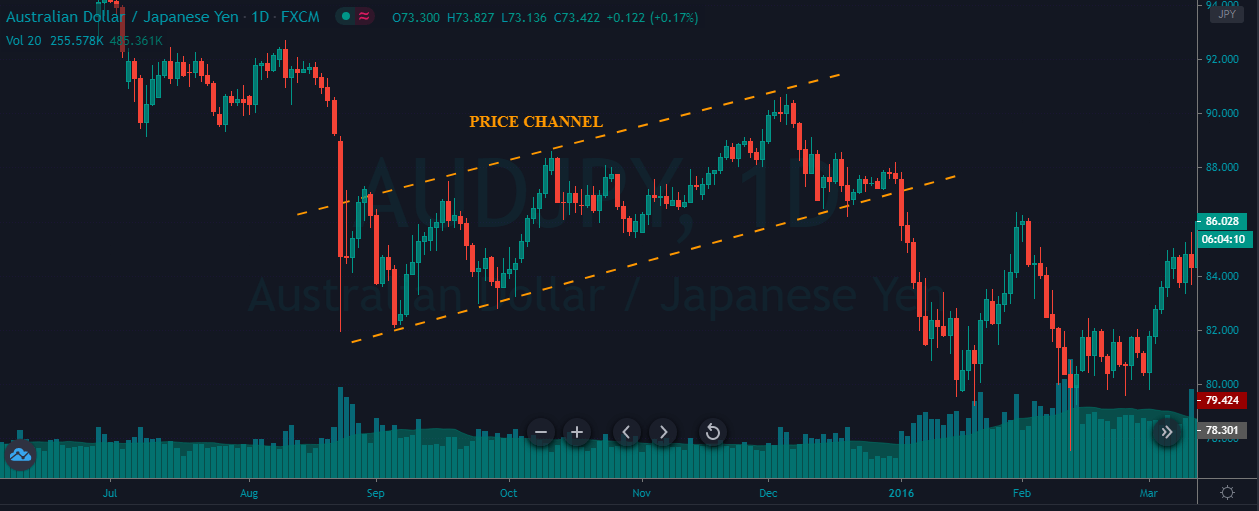
The price chart below represents a channel breakout in the CAD/JPY forex pair.
As we can see, the sellers are getting weaker in the channel, and as a result, soon after the breakout price action changed its trend. So, around 81.55, the price action broke to the north and printing a brand new higher high.
Buy Trade 2
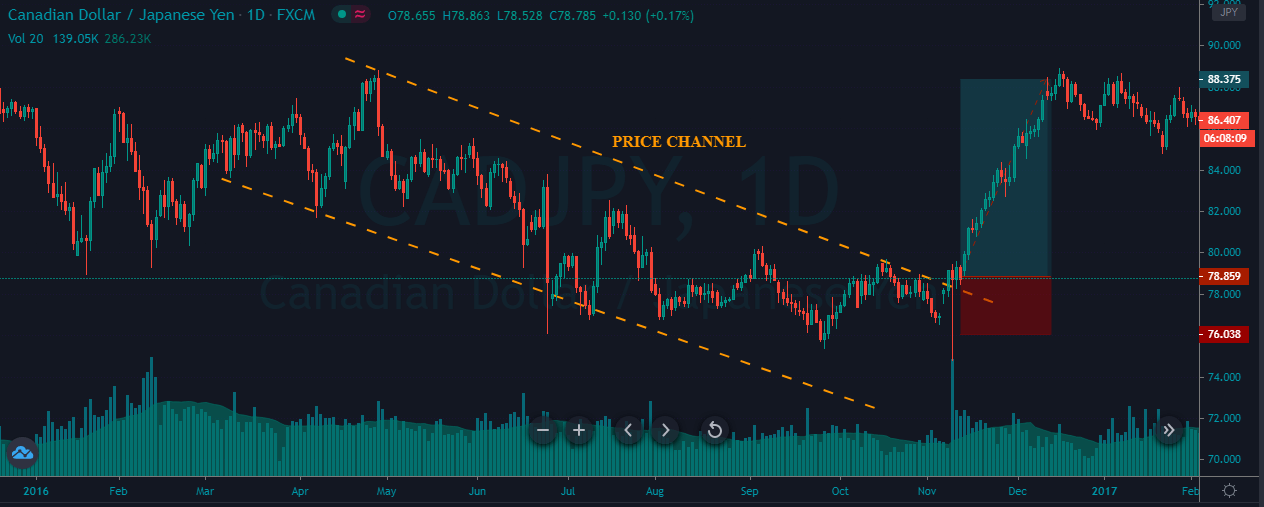
The image below represents the formation of a price channel in the CAD/JPY forex pair.
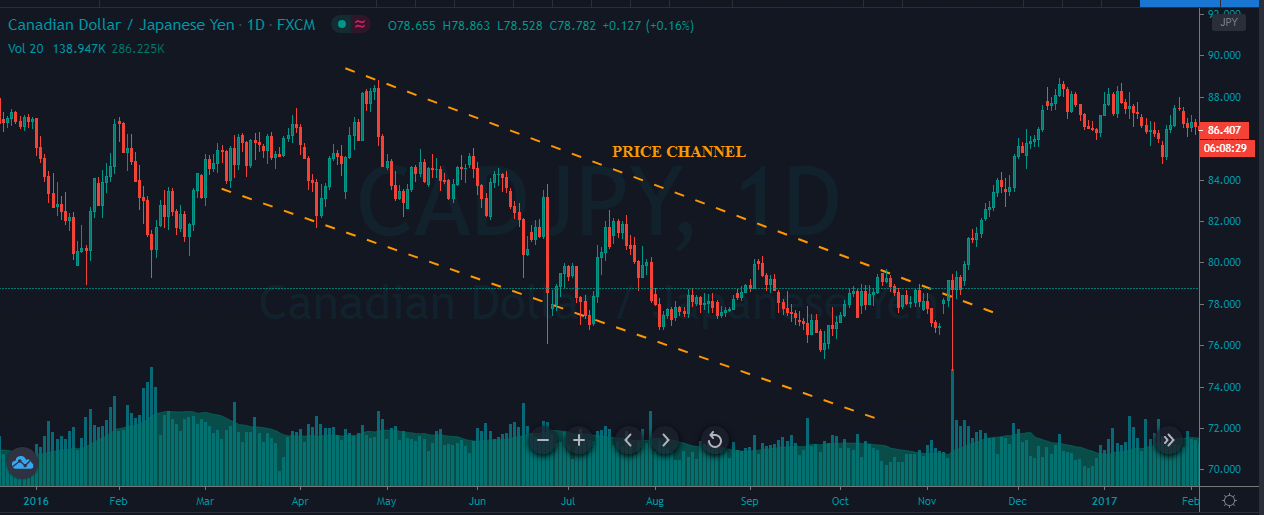
As we can see, the below price chart represents our entry-exit and stop loss in this pair. So during the downtrend, both buyers and sellers were holding equal power. Near to the 78.00 area, price action broke to the north, and after the breakout, we took a buy-entry. After our entry, the price made a brand new higher high, but the hold at the most recent higher high convinced us to close our trade at the 88.37 level.
Sell Trade 1
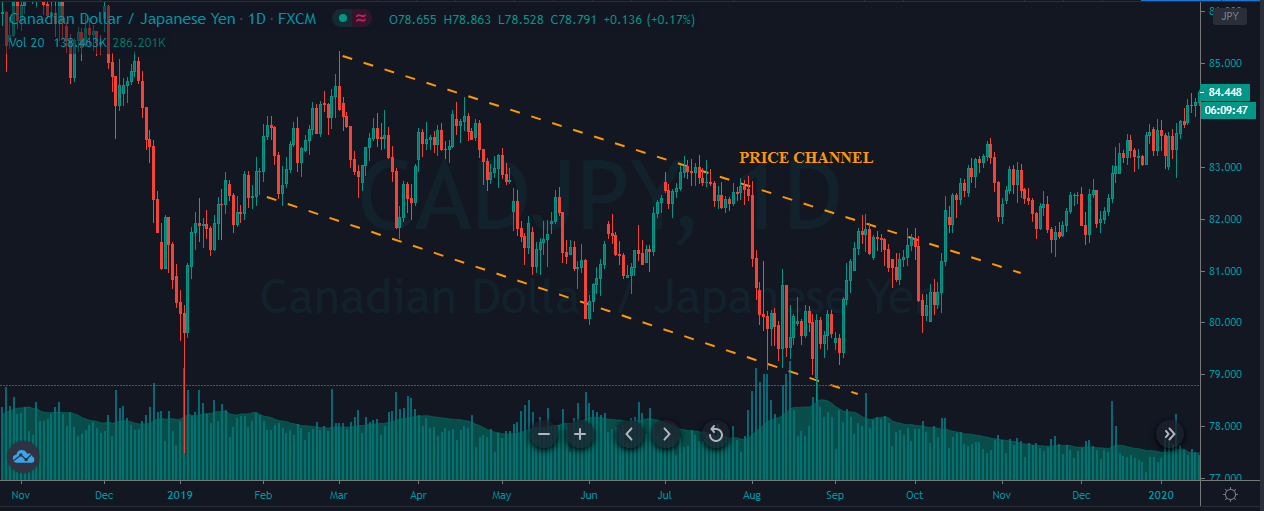
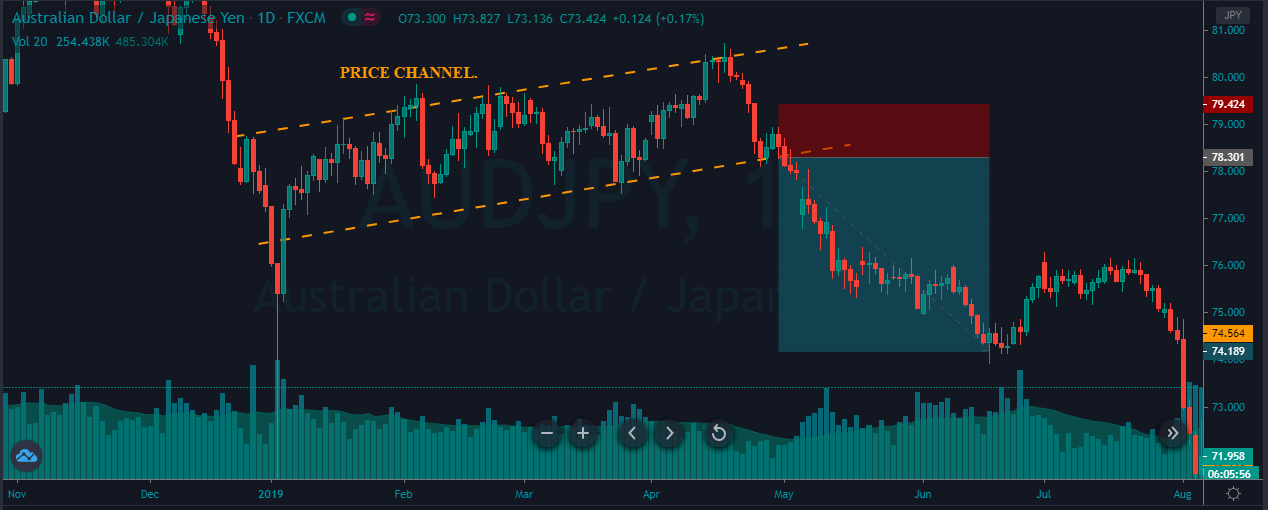
The image below represents the formation of a Price channel in a downward trend.

The image below represents our entry, stop loss, and take profit in this Forex pair. The channel is typically formed when there is no trend, or when the trend is about to end. On a lower timeframe, we can trade inside the Channel, but on this timeframe, the break below the 78.30 level indicates that the sellers stole the show, and are ready for a brand new lower low.
Sell Trade 2
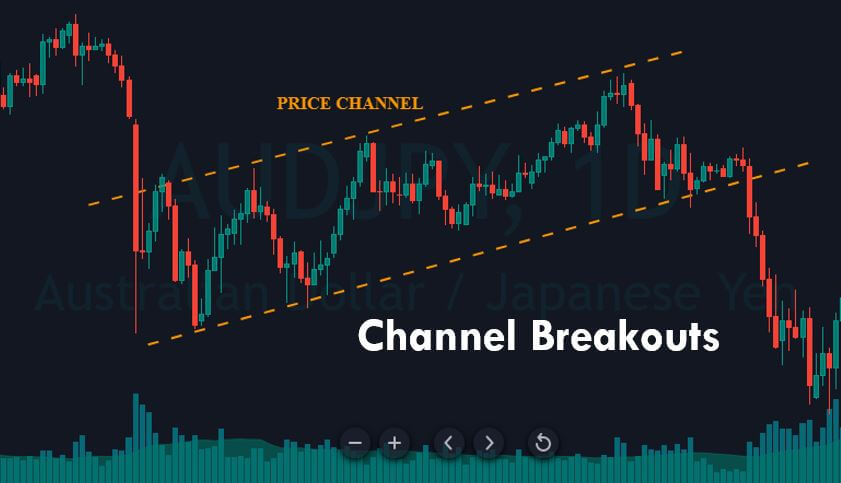
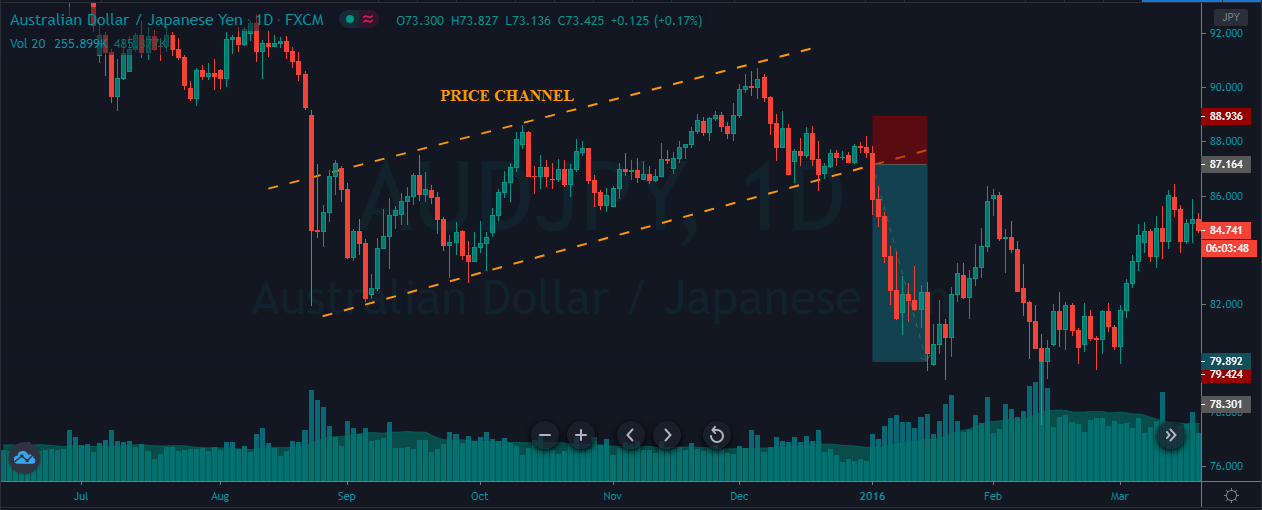
The image below represents a channel breakout in the AUD/JPY Forex pair.
Right after the price action approaches the most recent support area, it just got shot down and broke below the Channel. The strong red breakout candle is an indication for us to go short in this pair and right after our entry, we have witnessed a brand new lower low.
Trading channel breakouts is this simple. But minute details like drawing channel lines accurately is crucial. Let’s learn more breakout trading techniques in the upcoming lessons. For now, don’t forget to take the quiz.
[wp_quiz id=”85204″]