In today’s lesson, we are going to demonstrate an example of a chart that made a long bearish move obeying a bearish trendline. The price after forming a bearish trendline does not offer entry to the sellers. It makes a breakout at the first trendline and then produces another bearish trendline ending up offering short entries. Let us now have a look at the chart and find out how it happens.
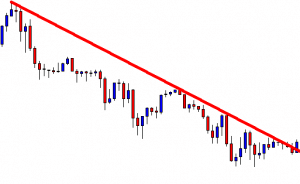
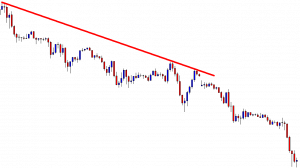
The chart shows that it makes two swing lows trending from two swing highs. By joining those points, we can draw a trendline shown in the above chart. The sellers may wait for the price to go back at the trendline’s resistance and produce a bearish reversal candle to go short in the pair. However, the price action has been choppy around the trendline’s resistance. The last candle comes out as a bullish engulfing candle. It does not look good for the sellers.
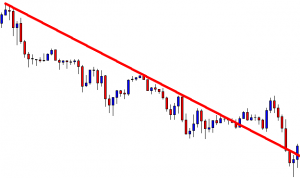
The price makes a breakout at the trendline’s resistance. It heads towards the North and then makes a strong bearish move. Such price action may puzzle traders. Do you notice something interesting here? Have a look at the next chart.
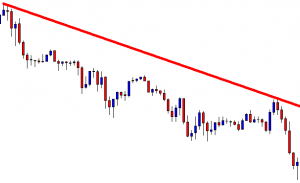
The sellers may draw another bearish trendline by joining two swing lows. As long as the price makes new lower lows, we can draw a bearish trend line by joining two higher highs. We know what sellers are to do here. Yes, they are to wait for the price to go back to the trendline’s resistance and produce a bearish reversal candle to go short in the pair.
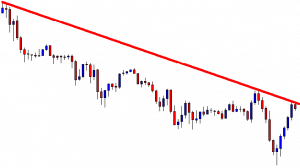
The chart produces a bearish inside bar. It is not a strong reversal candle. However, it is produced at a trendline’s resistance. The sellers may keep their eyes in the pair to go short according to their trading strategies. The price may find its next support at the last swing low. The chart shows that the price has enough space to travel towards the South.
The price heads towards the South at a moderate pace. It makes a long bearish wave, though, by making a breakout at the horizontal support. In the end, it comes out as an excellent trade for the sellers.
If we recap, the first drawn trendline is disobeyed by the price. It is breached, and the chart looks slightly bullish biased. It does not make any more bullish breakout but makes a long bearish move by making a breakout at the last swing low. It gives the sellers an opportunity to draw another bearish trendline, and that ends up offering an excellent entry.

