Categories
Forex Price Action

Trendline Trading: Major Chart’s Support/Resistance and Take-Profit Target

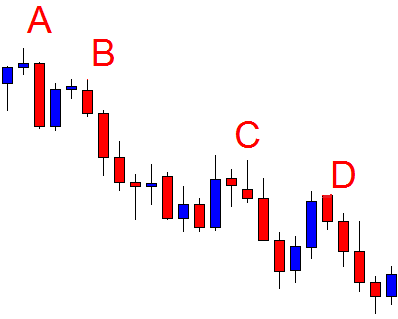
In today’s lesson, we are going to demonstrate an example of trendline trading where the price trends towards the South by obeying a down-trending trendline. In one of our lessons, we learned the importance of choosing a chart for trendline trading. In today’s example, we find out one more point to go with that. Let us get started.

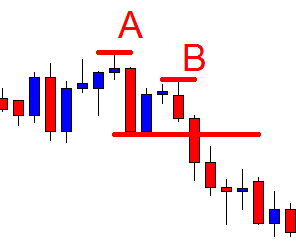
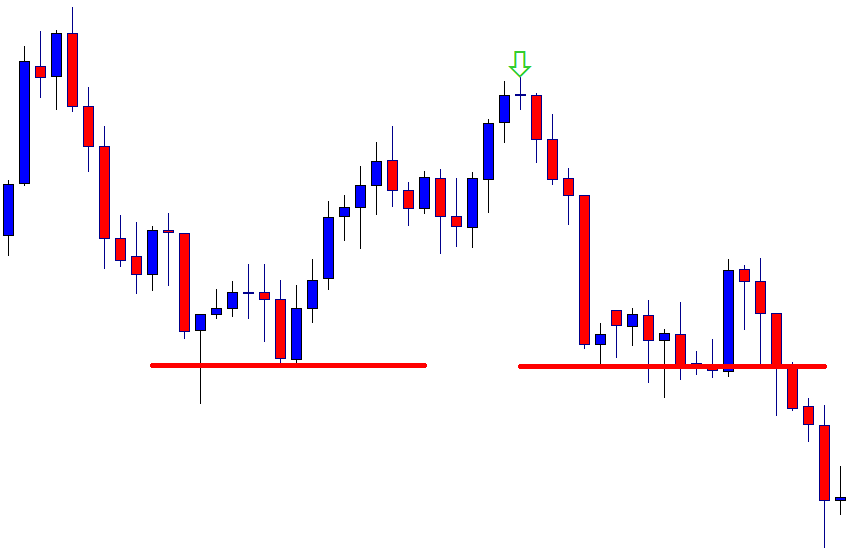
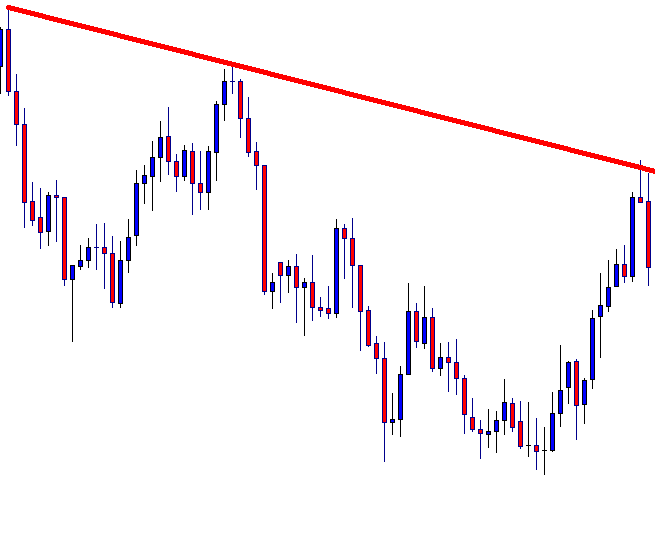
It is an H4 chart. The chart shows that the price heads towards the South by having a bullish correction. The chart shows that the price produces a double bottom. The buyers may keep their eyes on the chart to go long upon having a breakout at the neckline.

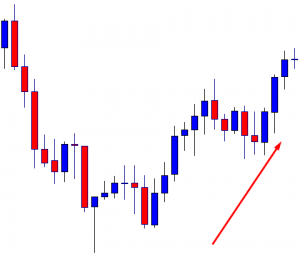
The price makes a breakout at the neckline and heads towards the North. It makes a bearish correction and resumes its bullish journey. The last wave suggests that the buyers may push the price towards the level, where the price made its bearish move earlier.

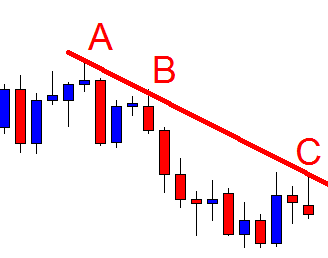
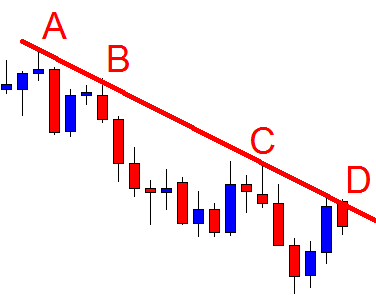
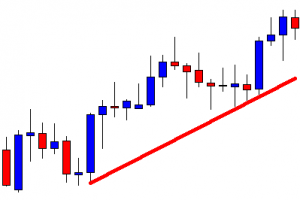
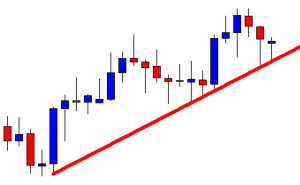
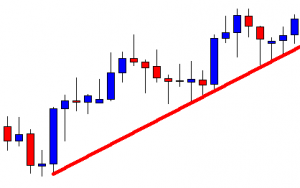
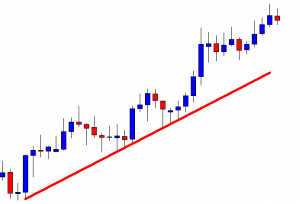
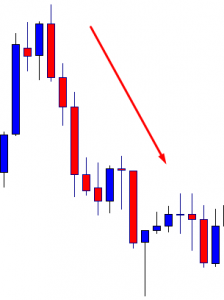
It does not. The price finds its resistance and makes a strong bearish move. It makes a breakout at the last swing low. What does that mean? It means we have two swing highs. With those, we can draw a down-trending trend line and wait for the price to go towards the trendline’s resistance to go short in the pair.

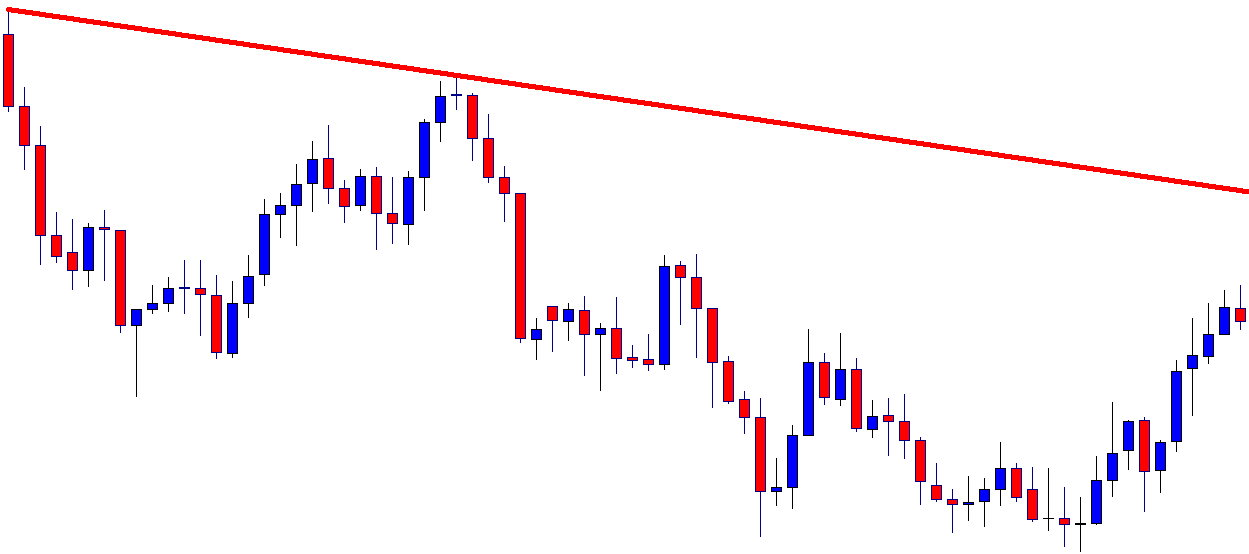
The price attempts to go towards the trendline’s resistance several times. However, it comes back to its horizontal support again. If we look at the horizontal support, the price bounces at the level three times. It becomes daily support, considering the number of H4 candles. On the other hand, the trendline’s resistance is an H4 resistance. The question is whether the H4 trendline traders should wait to go short from the trendline’s resistance or not? Let us proceed to the next chart and find more about it.

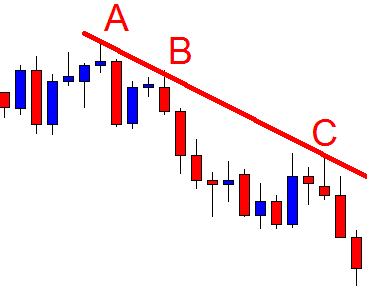
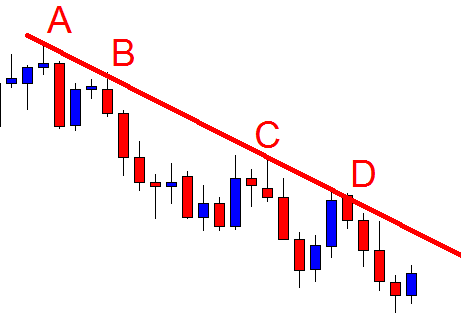
The chart produces a bearish engulfing candle. The price trends towards the South from the same trendline’s resistance. It produces another bearish reversal candle in the same chart.  Ideally, trendline traders should trigger a short entry right after the last candle closes by setting their take profit at the horizontal support. This is how the daily support is respected as well as the H4 sellers go short in the pair by using the trendline trading strategy. Let us see how the trade goes.

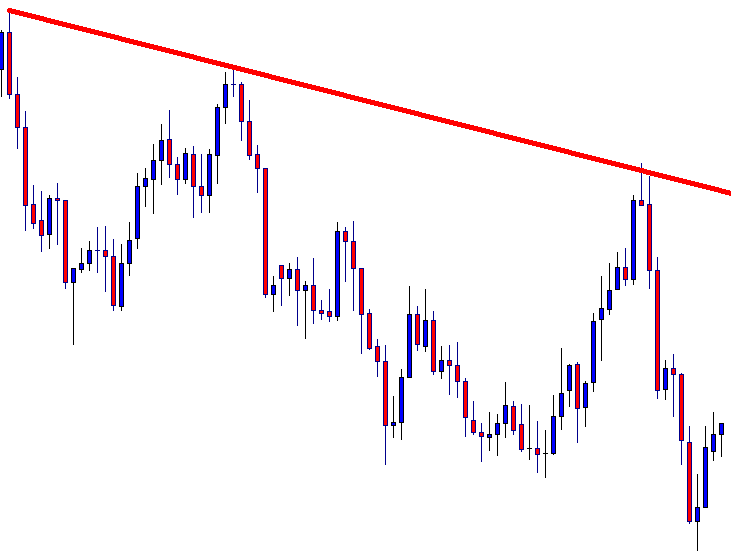
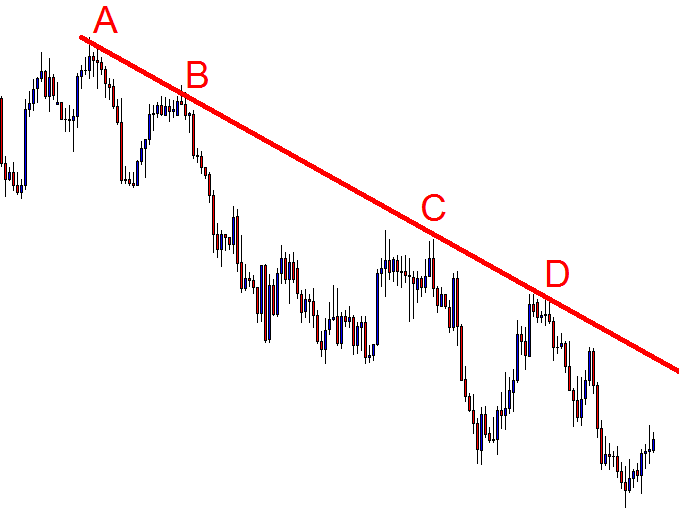
Wow! The price heads towards the South with good bearish momentum. It hits the target and makes a breakout at the horizontal support. It means the trendline is still active. The sellers may wait again for the price to go towards the trendline’s resistance and to get a bearish reversal candle to go short in the pair.

We must choose the right chart for trendline trading to take entry and we must remember the bigger time frame’s support/resistance to set take profit. If the risk-reward ratio is at least 1:1, we may take entry. If it is less than 1:1, we may skip taking entry and concentrate on some other charts.

Categories
Forex Price Action

Trend Line Trading: Establishment and Choosing the Chart Timeframe

In today’s lesson, we are going to learn how a trend line is established and how to choose the chart to trigger entry as far as trend line trading is concerned. Traders at the beginning often are carried away and select a wrong chart to trade with a trend line. The point is, we must choose the right time frame to make the best use of a trend line. Let us now find out how we can do that.

It is a daily chart. The chart shows that the price after making a bullish correction heads towards the South and makes new lower lows. We see four significant swing highs from where the price makes four swing low. If you are a trendline trader, you know from where you have to keep an eye on this chart, don’t you? Then again, let us explore it.

The price produces a spinning top followed by a bearish engulfing candle. It makes a bullish correction and finds its resistance at point B. The price makes a breakout at the last swing low and heads towards the South further. By joining two swing highs, we can draw a down-trending trend line.

The chart shows that the price is down-trending by obeying the drawn trend line with the first two points. Concentrate on the point C. This is where traders keep their eyes to get a bearish reversal candle to go short in the pair. The chart shows that the price produces an inverted hammer. The trend line sellers may go short below the last candle’s lowest low.

As expected, the price heads towards the South with good bearish momentum. The chart produces two consecutive bearish candles. Moreover, the chart makes a new lower low as well. This means the game is not over yet for the trend line sellers. They may wait to go short again from the resistance of the trendline upon getting a bearish reversal candle.

The chart produces a bearish inside bar. The sellers may go short again below the last candle’s lowest low. It seems that the sellers are having a feast here. This is the beauty of trend line trading.

The sellers again make a handful of pips. In fact, the price makes a breakout again at the last swing low. They may wait for the price to go towards the trendline and produce a bearish reversal candle at point E to go short again. Now, let’s flip over to the H4 chart and find out how it looks.

The chart shows that the price is down trending. However, it is tough to find out the signal candle. We get more than one bearish reversal candle at point B and C. At point D, it is extremely confusing were to trigger an entry. With the Daily chart, it is very explicit, though. To be able to choose the right chart that obeys a trend line, we may always concentrate on point B (2nd point) and calculate with which chart it responds more. We then keep our eyes on that particular chart to be able to take entry with precision.


Categories
Forex Daily Topic Forex Price Action

Trend Line Trading: It Takes at Least ‘two’ to Draw a Trend Line

In today’s lesson, we are going to demonstrate an example of trendline trading. We try to learn what steps traders need to take to trade using a trendline strategy. We are going to demonstrate a chart, which heads towards the North by obeying an up-trending trend line. With the trend line trading strategy, we must remember, “It takes at least ‘two’ lows to draw a trend line.” Let us proceed and find out how it works.

The chart shows that the price produces a double bottom and heads towards the North. The buyers may wait for the price to make a bearish correction and create a bullish reversal candle to go long in the pair. The last candle comes out as a bearish pin bar. The price may make a bearish correction from here.

The price makes a long bearish correction. It produces several Doji candles. However, it does not create any bullish momentum. It is an H4 chart. The correction takes more than six candles. The level of resistance becomes a daily resistance. Some buyers may skip eyeing on the chart to go long in the pair. Let us see what happens next.

The chart produces a bullish engulfing candle and heads towards the North by making a new higher high. Do you notice anything here? Yes, we can draw an up-trending trend line. Let us draw it.

Over here, we have two swing lows. At the second swing low, the price makes a breakout at the last swing high. It means as far as fundamentals of drawing a trend line is concerned, the chart offers the buyers to draw an up-trending trend line. We must remember that it takes at least two swing lows (price trending higher from those points) to draw a trend line. The buyers are to wait for the price to come at the level of support and produce a bullish reversal candle to go long in the pair.

The price comes at the level of support and produces a bullish pin bar. It is delivered right at the trendline’s support. The buyers may get ready to go long in the pair above the reversal candle’s highest high.

The next candle comes out like a spinning top, which breaks the reversal candle’s highest high. However, the price does not head towards the North according to the buyers’ expectations. Nevertheless, on the next day, the price makes bearish correction at intraday charts and heads towards the North. Let us proceed to the following chart to find out how the trade goes.

The price hits the first target in a hurry. It makes a breakout at the level and creates a new higher high as well. It means the buyers are going to keep their eyes on the chart to go long again from the trendline’s support, and this is the beauty of the trendline trading.