
In today’s lesson, we are going to demonstrate an example of trendline trading. We try to learn what steps traders need to take to trade using a trendline strategy. We are going to demonstrate a chart, which heads towards the North by obeying an up-trending trend line. With the trend line trading strategy, we must remember, “It takes at least ‘two’ lows to draw a trend line.” Let us proceed and find out how it works.
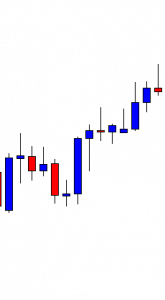
The chart shows that the price produces a double bottom and heads towards the North. The buyers may wait for the price to make a bearish correction and create a bullish reversal candle to go long in the pair. The last candle comes out as a bearish pin bar. The price may make a bearish correction from here.
The price makes a long bearish correction. It produces several Doji candles. However, it does not create any bullish momentum. It is an H4 chart. The correction takes more than six candles. The level of resistance becomes a daily resistance. Some buyers may skip eyeing on the chart to go long in the pair. Let us see what happens next.
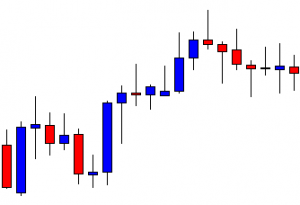
The chart produces a bullish engulfing candle and heads towards the North by making a new higher high. Do you notice anything here? Yes, we can draw an up-trending trend line. Let us draw it.
Over here, we have two swing lows. At the second swing low, the price makes a breakout at the last swing high. It means as far as fundamentals of drawing a trend line is concerned, the chart offers the buyers to draw an up-trending trend line. We must remember that it takes at least two swing lows (price trending higher from those points) to draw a trend line. The buyers are to wait for the price to come at the level of support and produce a bullish reversal candle to go long in the pair.
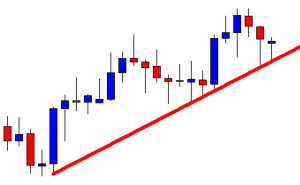
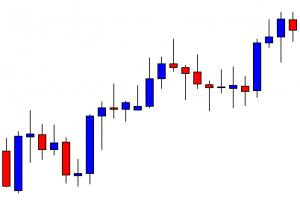
The price comes at the level of support and produces a bullish pin bar. It is delivered right at the trendline’s support. The buyers may get ready to go long in the pair above the reversal candle’s highest high.
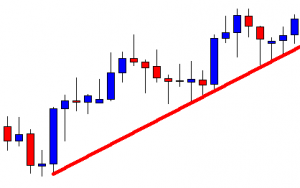
The next candle comes out like a spinning top, which breaks the reversal candle’s highest high. However, the price does not head towards the North according to the buyers’ expectations. Nevertheless, on the next day, the price makes bearish correction at intraday charts and heads towards the North. Let us proceed to the following chart to find out how the trade goes.
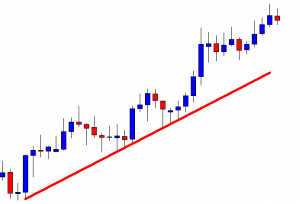
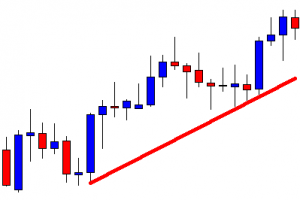
The price hits the first target in a hurry. It makes a breakout at the level and creates a new higher high as well. It means the buyers are going to keep their eyes on the chart to go long again from the trendline’s support, and this is the beauty of the trendline trading.