Forex charts often have price gaps. It usually occurs in minor time frames. However, it sometimes occurs in time frames such as the H1, H4, daily chart as well. Since price movement is the key factor determining its next move for the price action traders, thus price gap creates confusion in price action trading. Thus, it is best to skip taking entries on charts with a price gap. Let us demonstrate an example and find out the reason behind it.
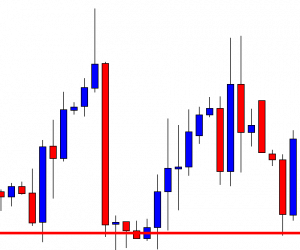
It is an H4 chart. The chart shows that the price produces a bullish engulfing candle right at a support level, where the price has several bounces. Thus, the H4-H1 combination traders may flip over to the H1 chart to go long in the pair.
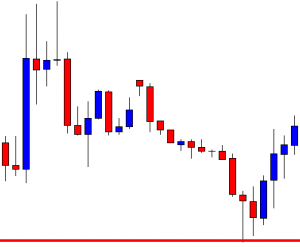
The H1 chart shows that the price heads towards the North with good bullish momentum. The buyers are to wait for the price to consolidate and produce a bullish reversal candle to offer a long entry.
The chart produces a bearish engulfing candle. It is a strong bearish candle. However, the buyers may wait for the price to be held at a key level and produce a bullish reversal candle. Let us proceed to find out what happens next.
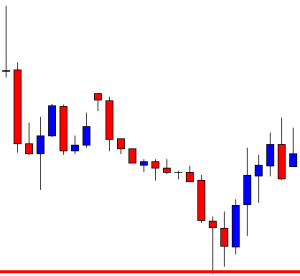
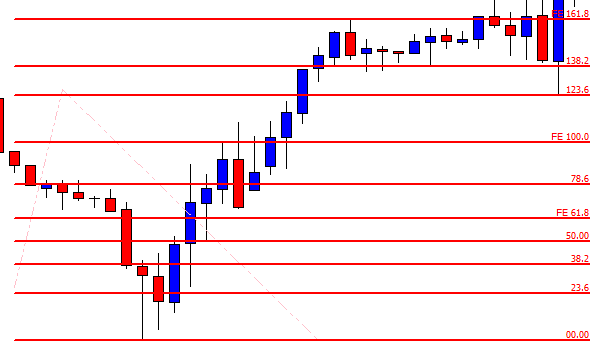
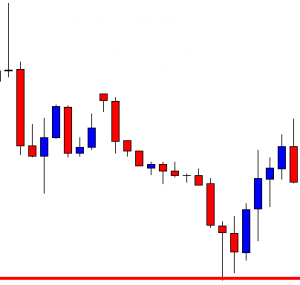
The chart produces a bullish reversal candle. It is an inverted hammer. Moreover, it is produced with a bullish price gap. Technically, the H4-H1 chart combination traders may trigger a long entry above the level of resistance. Here is an equation that must be considered if they are to determine risk-reward by using Fibonacci retracement. We find this out soon. Let us see how the price reacts now.
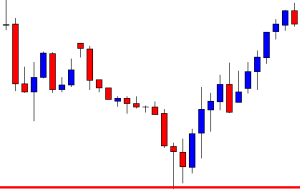
What a good bullish move it is! The price heads towards the North with very good momentum. The last candle comes out as a bearish candle. It suggests that the price may make a bearish correction. Let us now draw Fibonacci levels and explain the chart with some Fibonacci numbers.