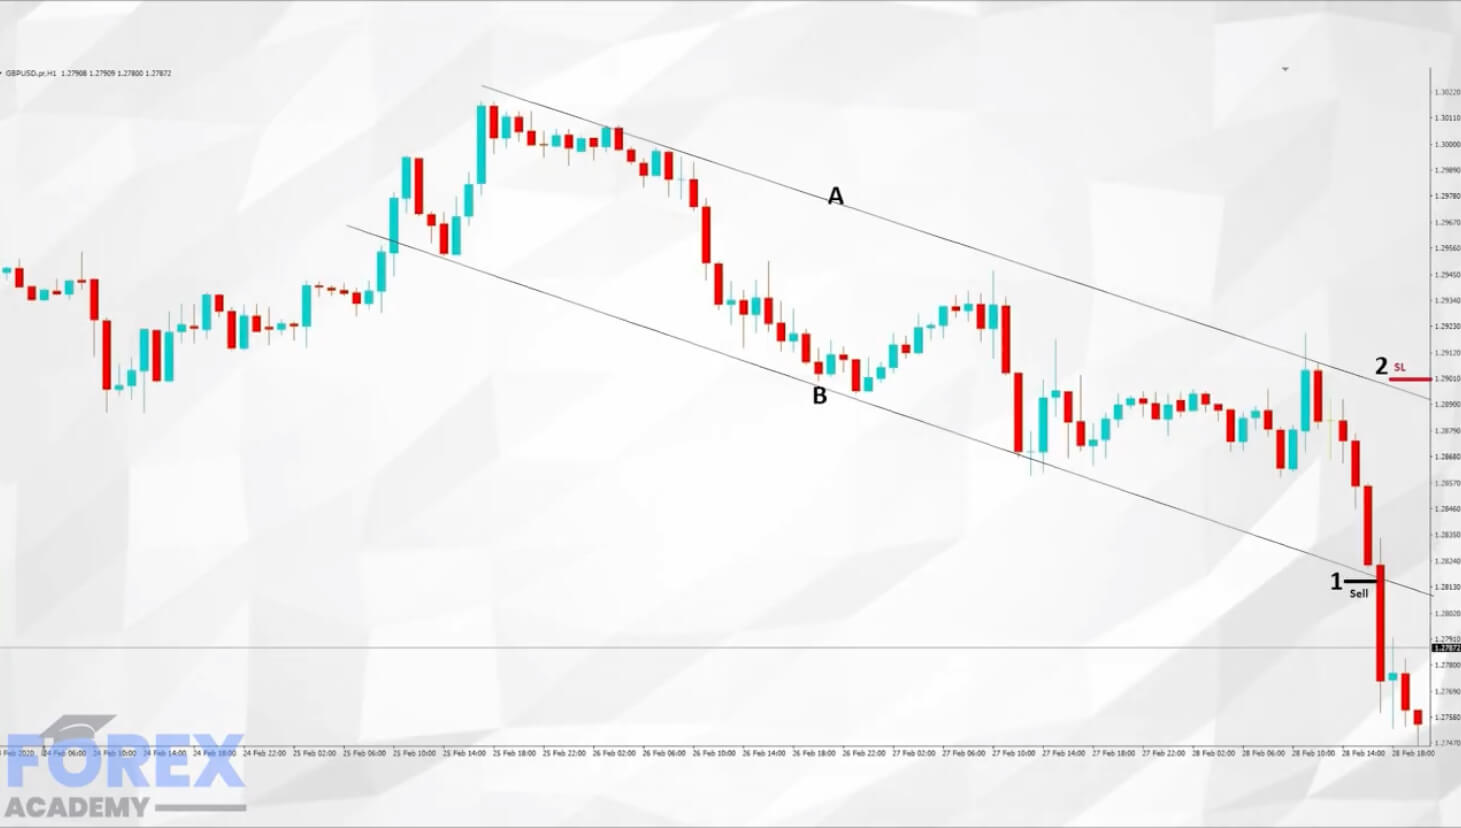
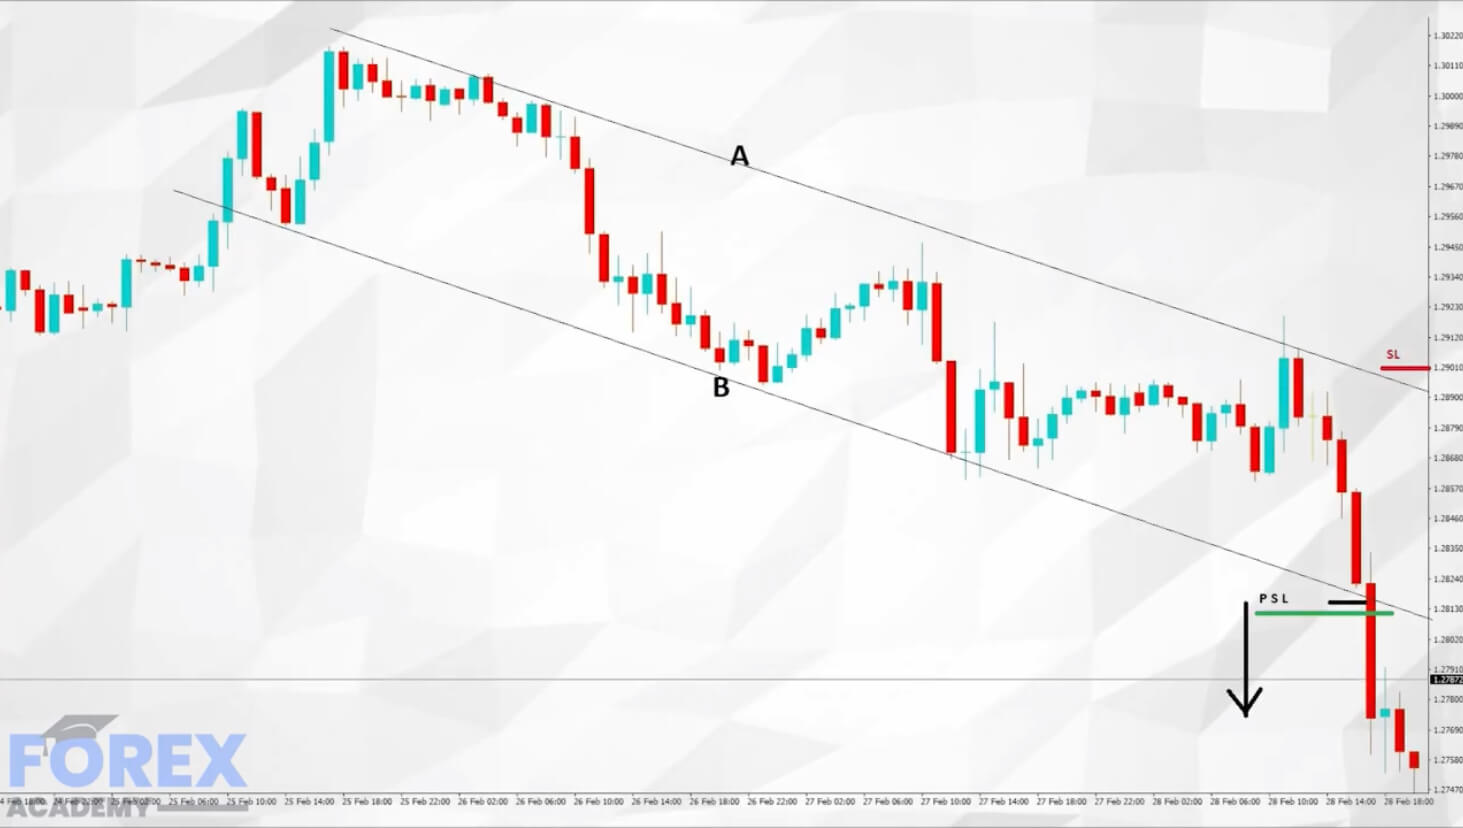
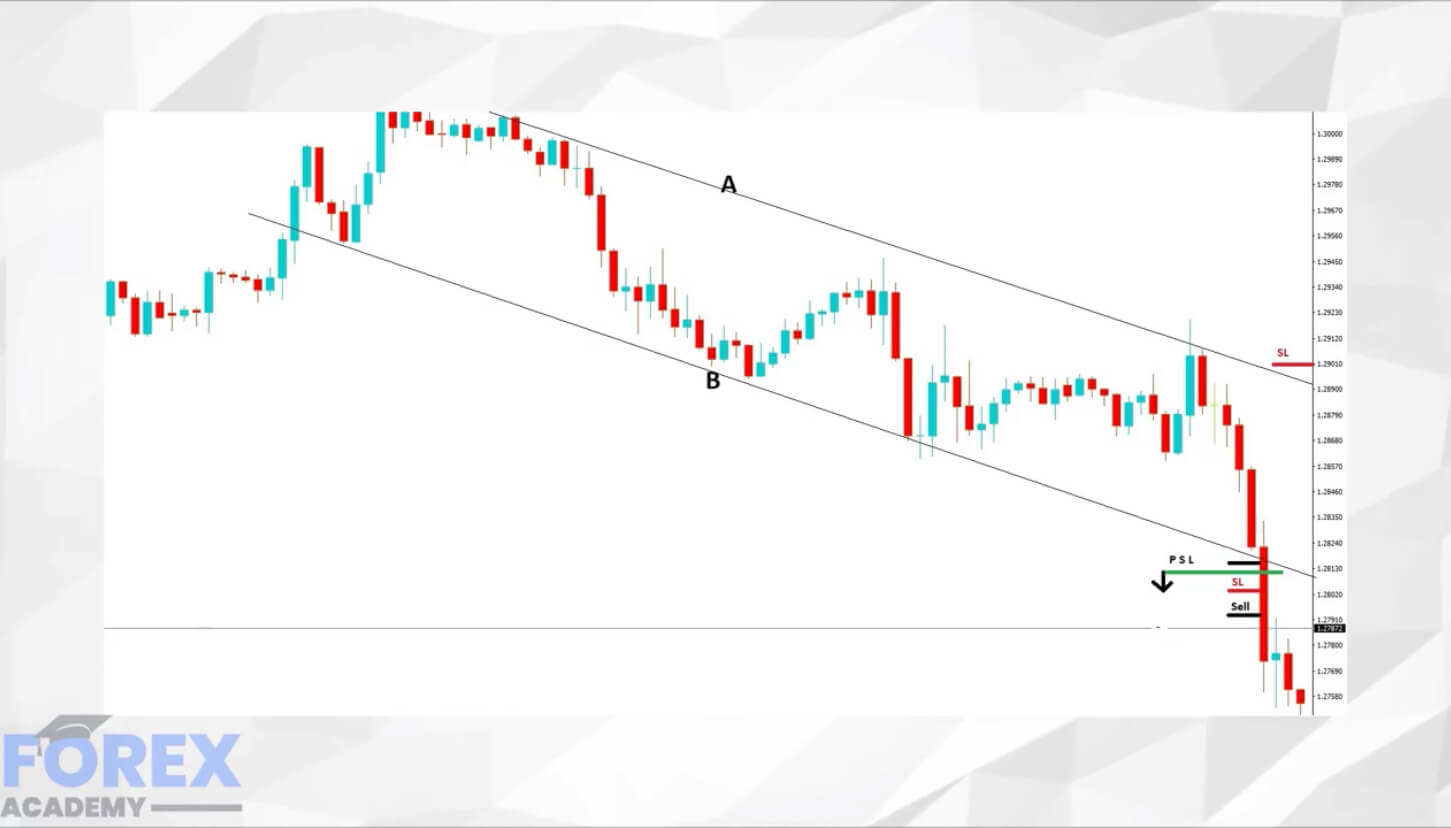
Introduction
In the previous educational article, we presented the contracting triangles and the restricting group. In this last part of our four-part series, we’ll show the non-restrictive contracting triangles and the expanding triangles with its variations.
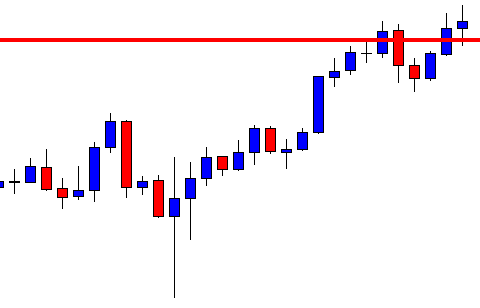
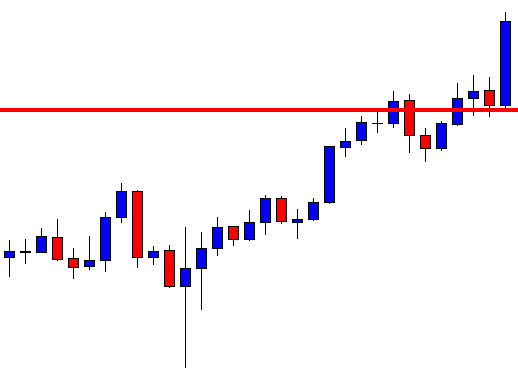
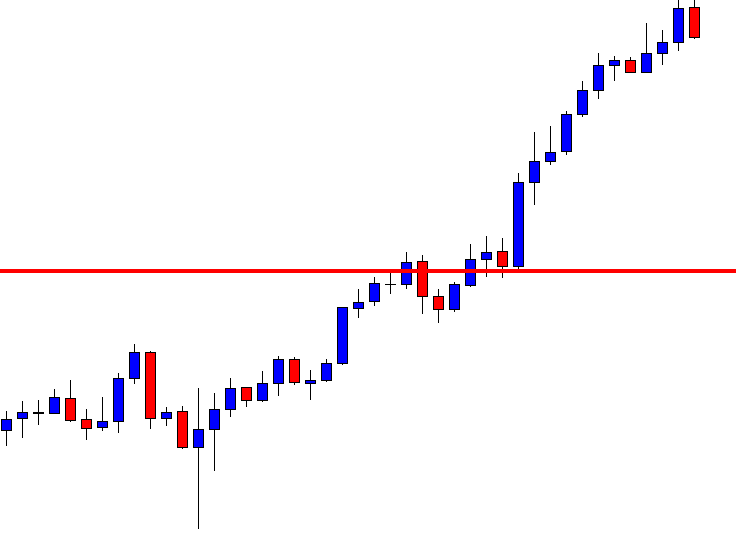
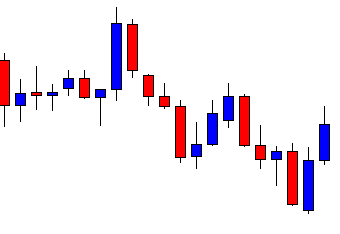
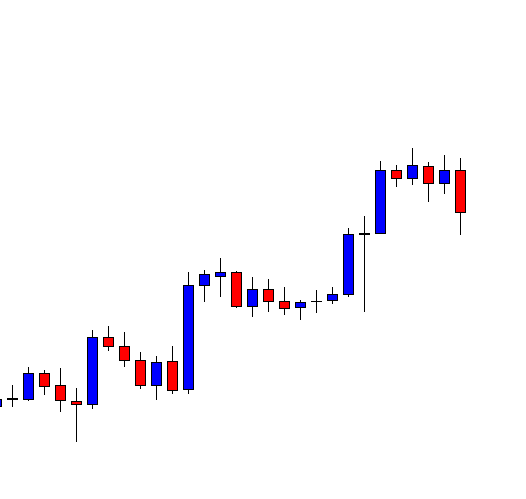
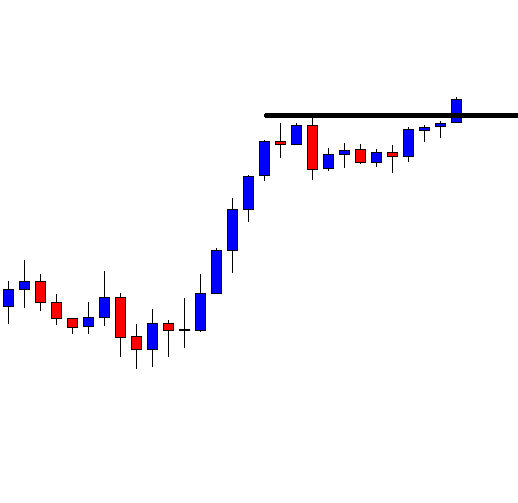
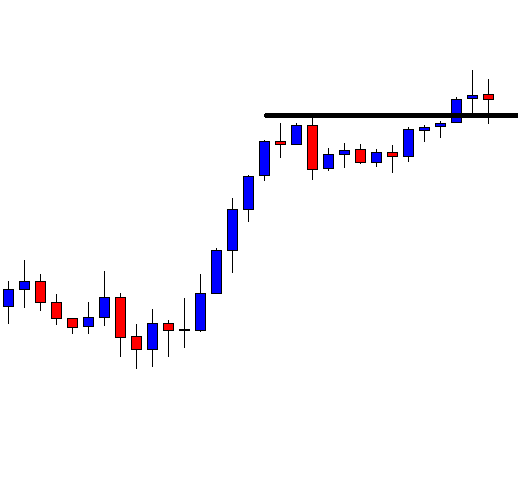
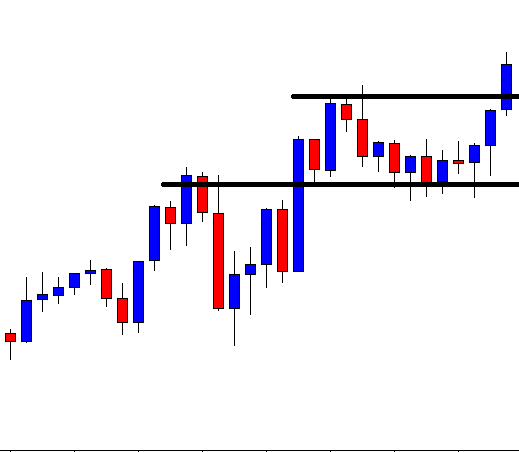
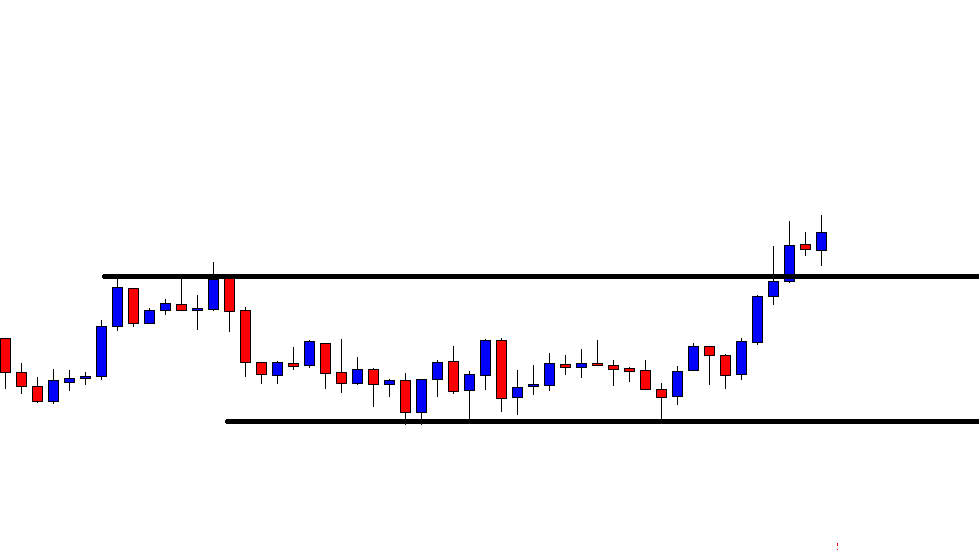
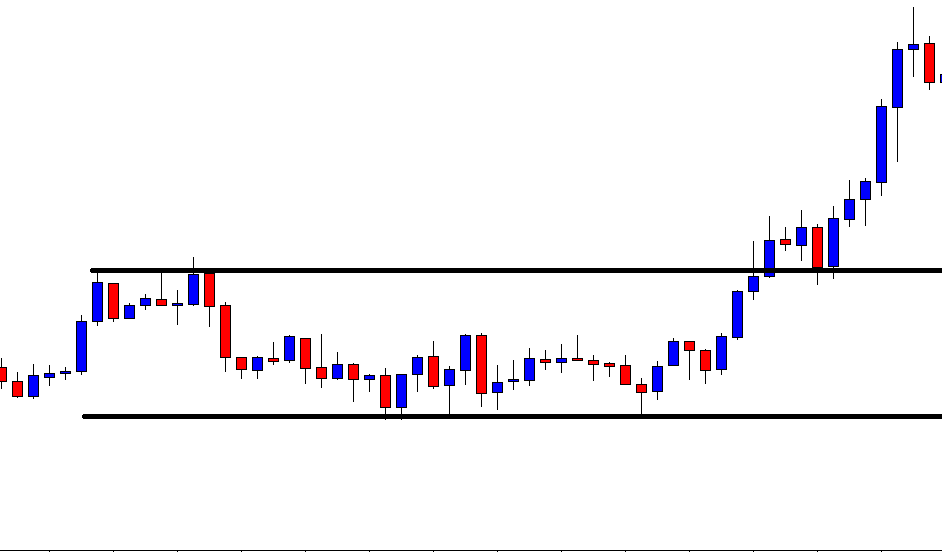
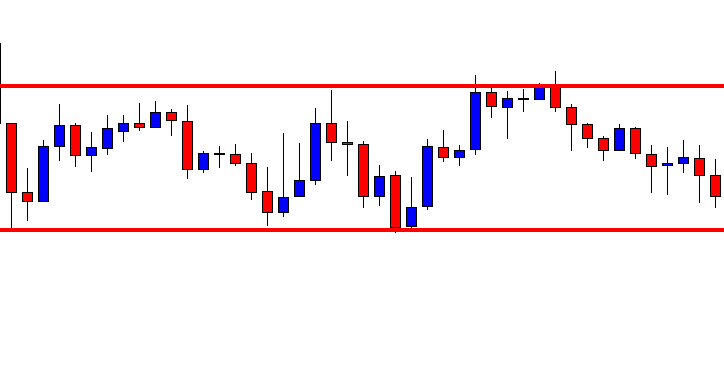
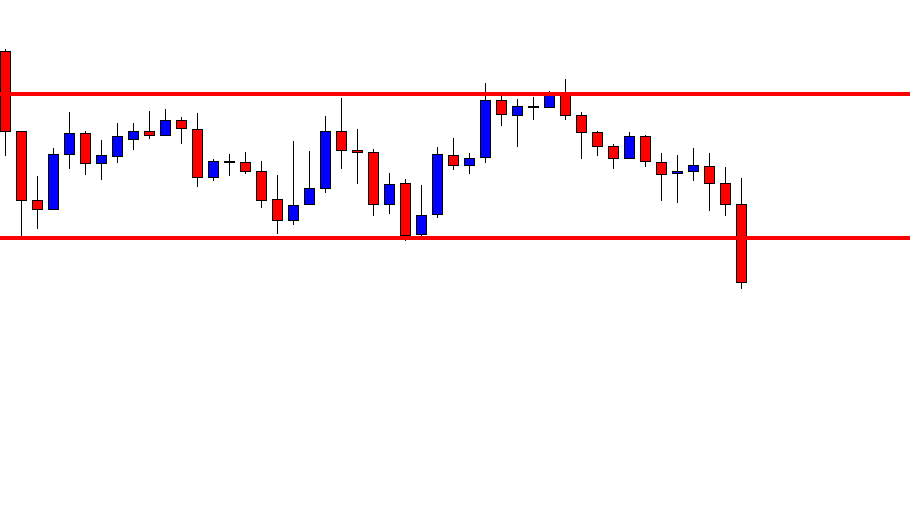
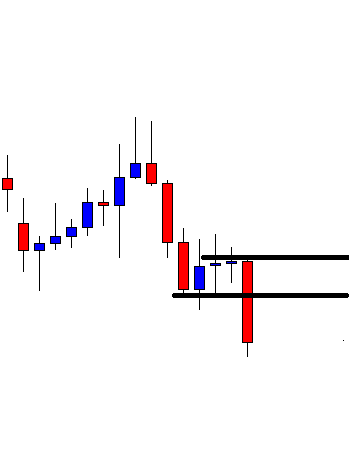
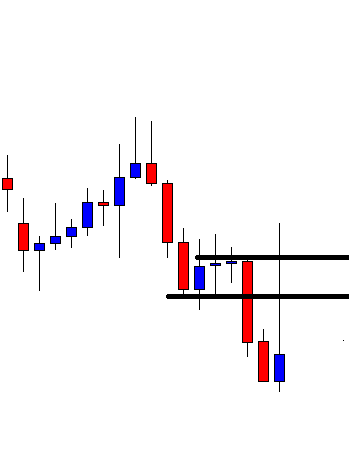
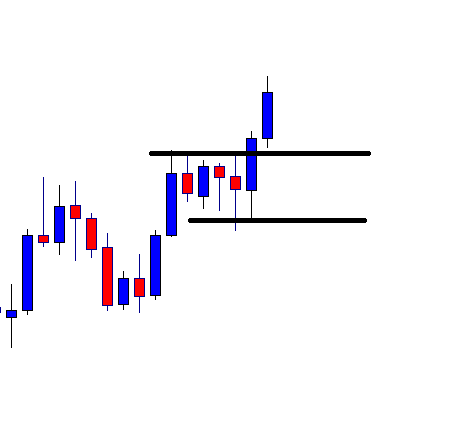
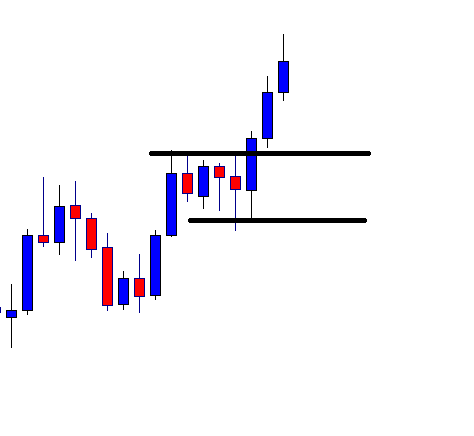
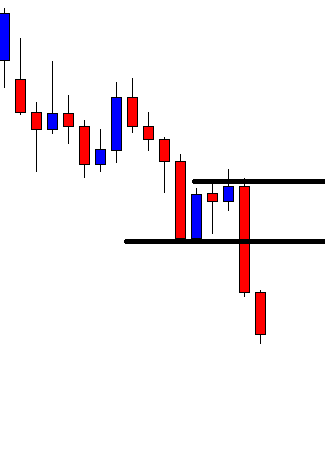
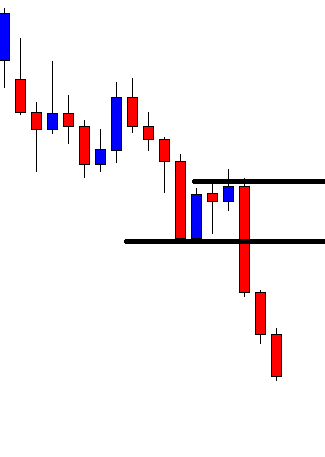
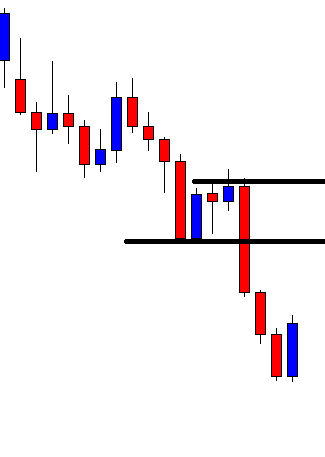
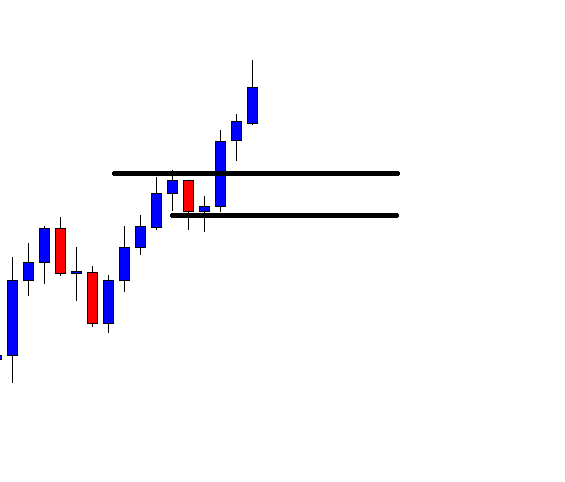
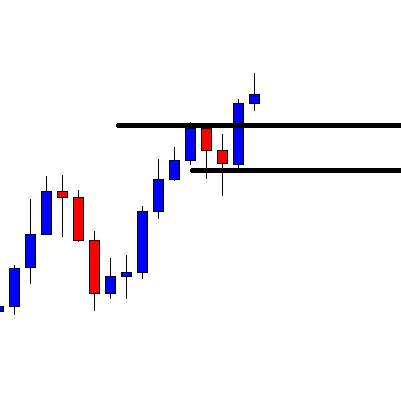
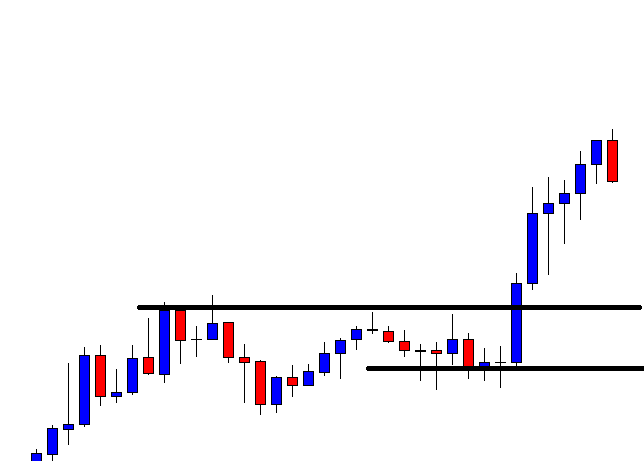
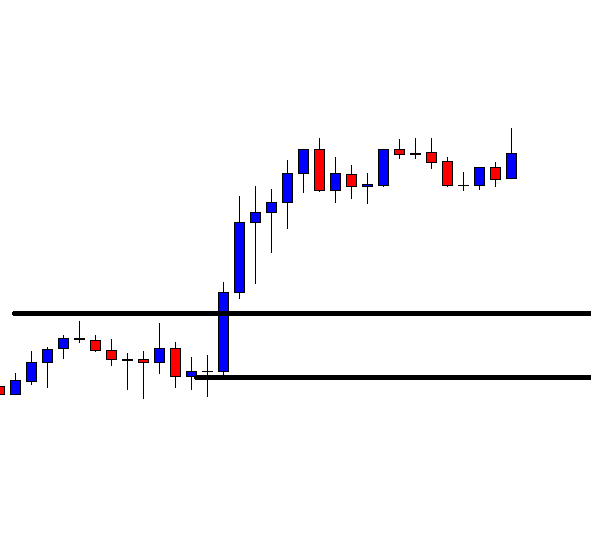
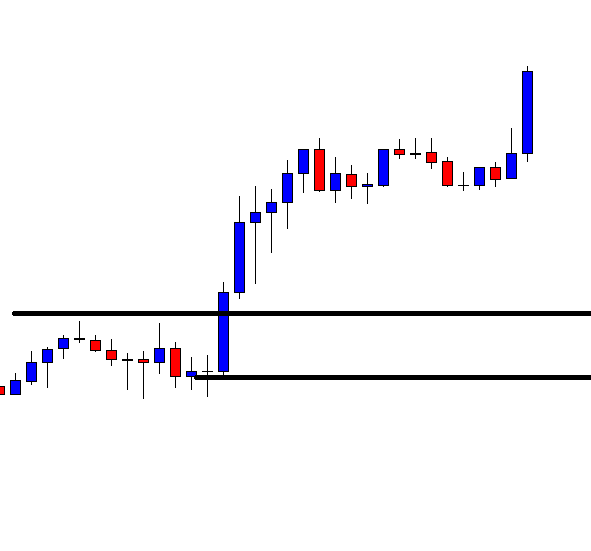
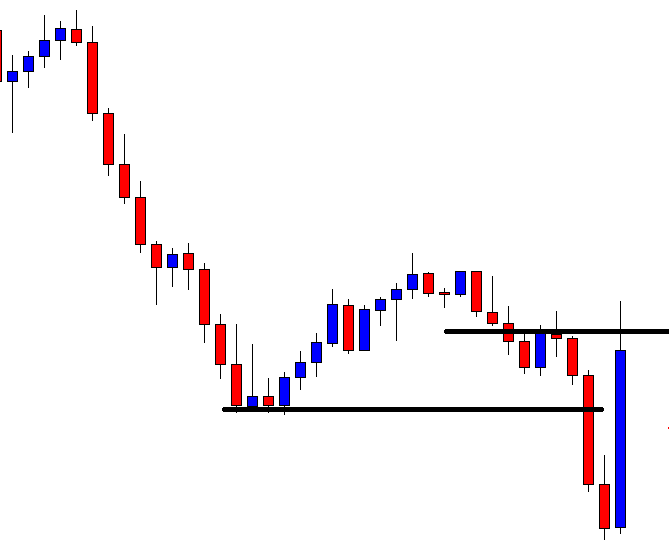
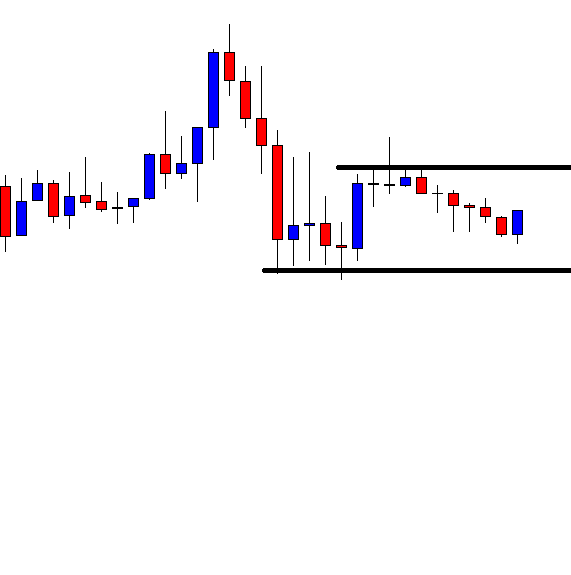
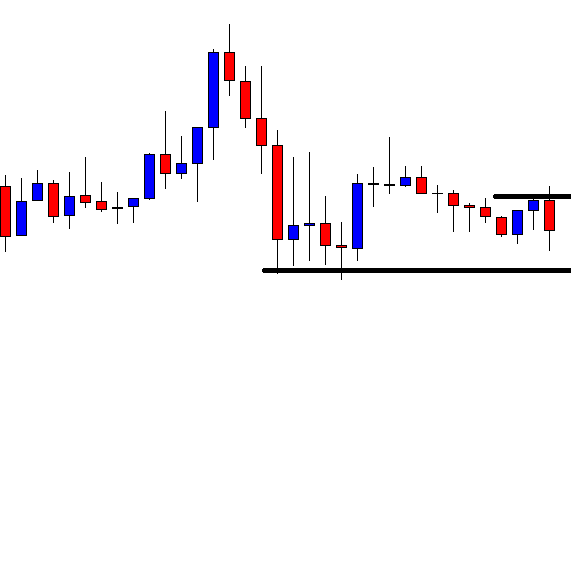
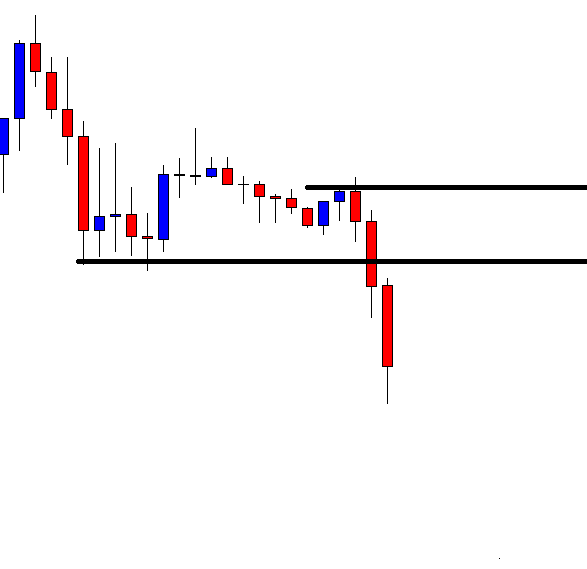
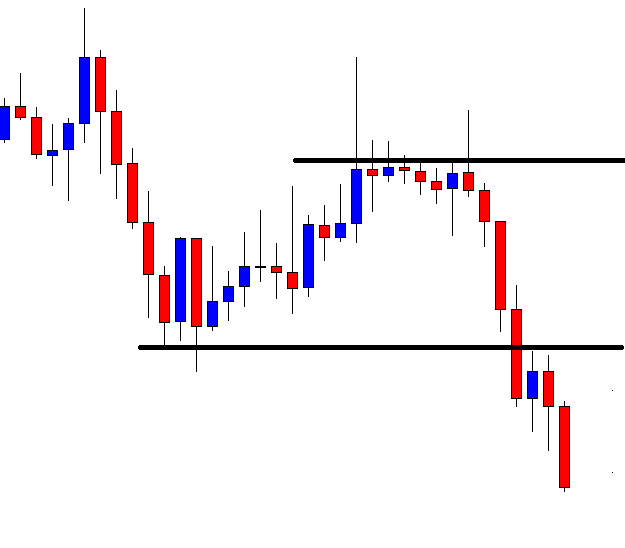
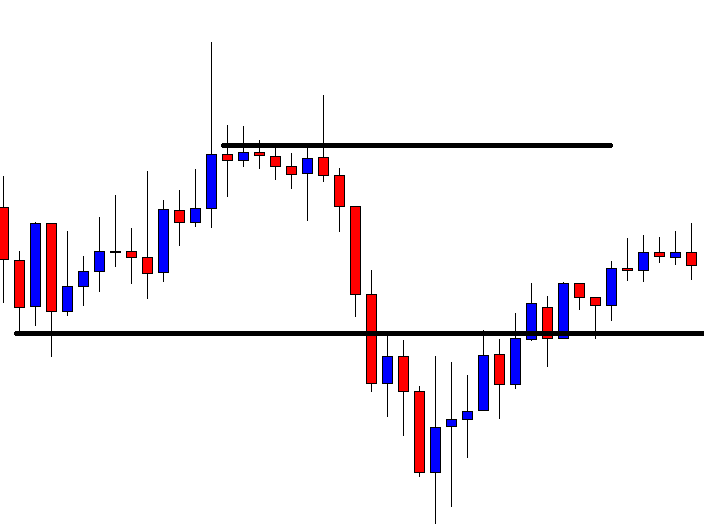
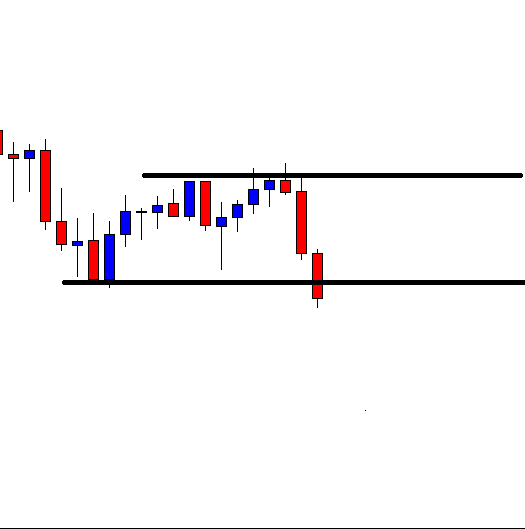
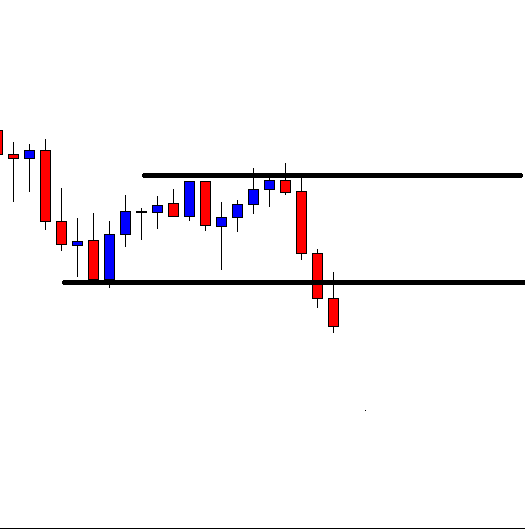
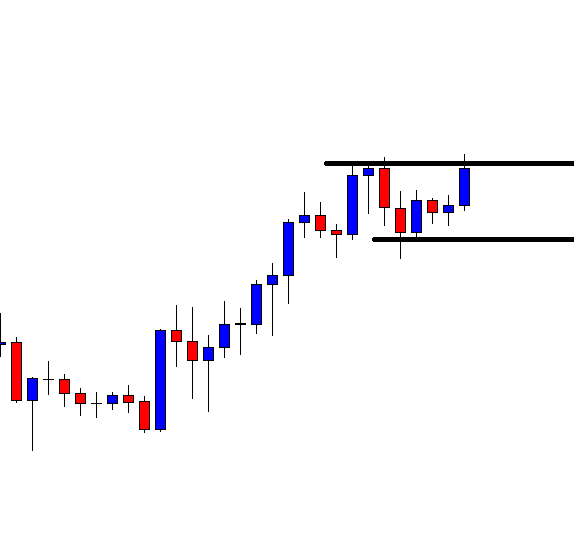
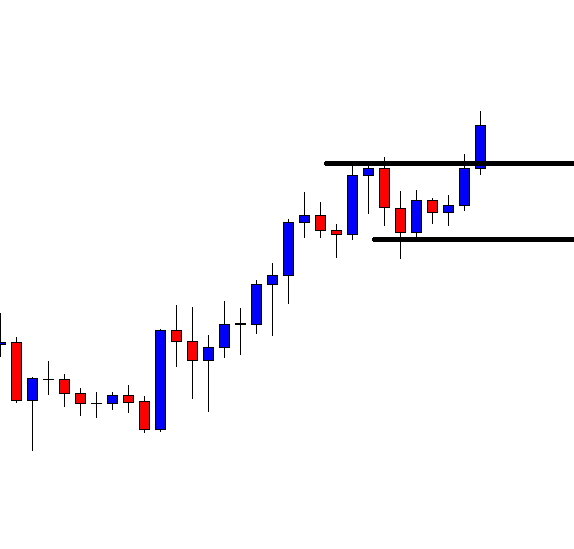
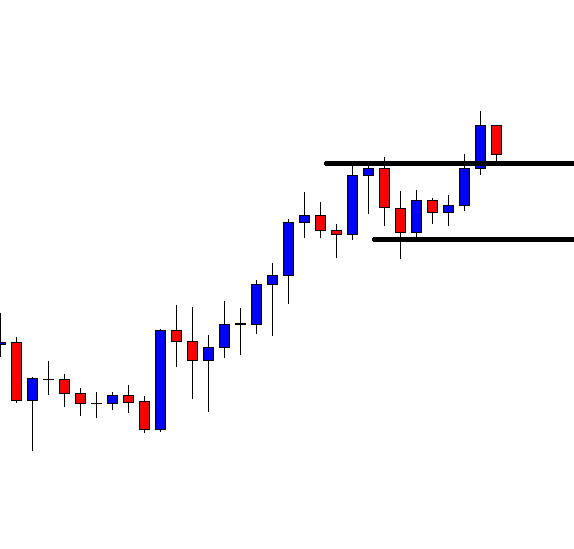
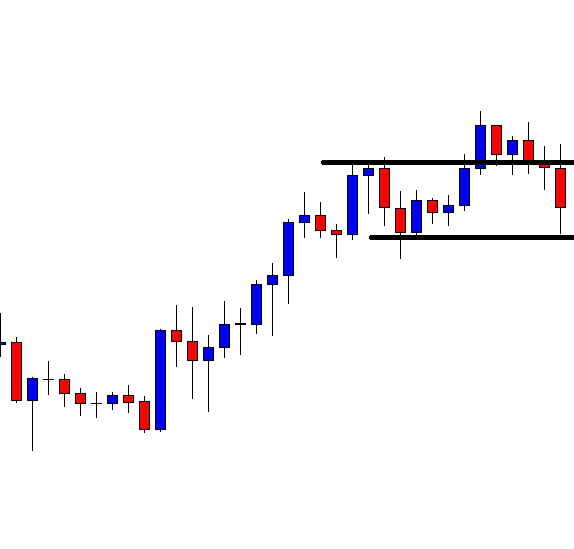
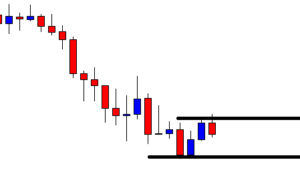
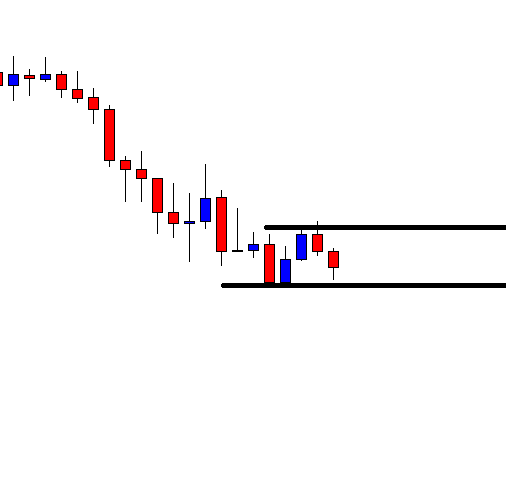
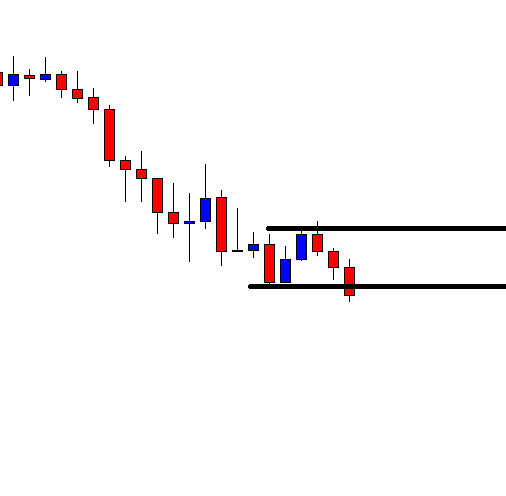
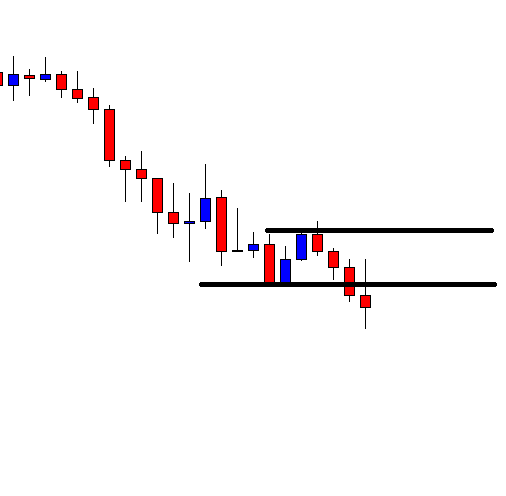
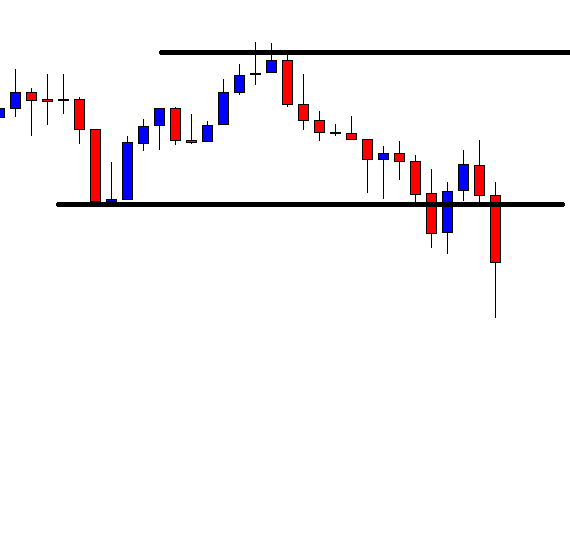
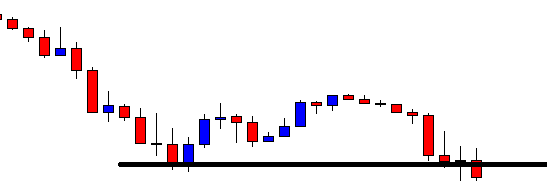
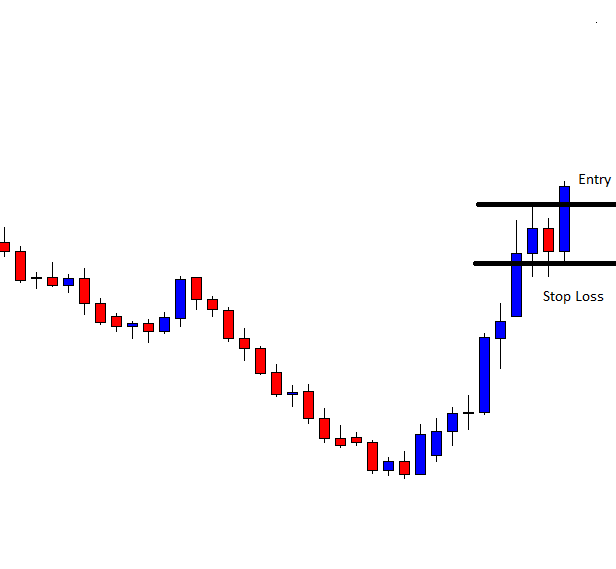
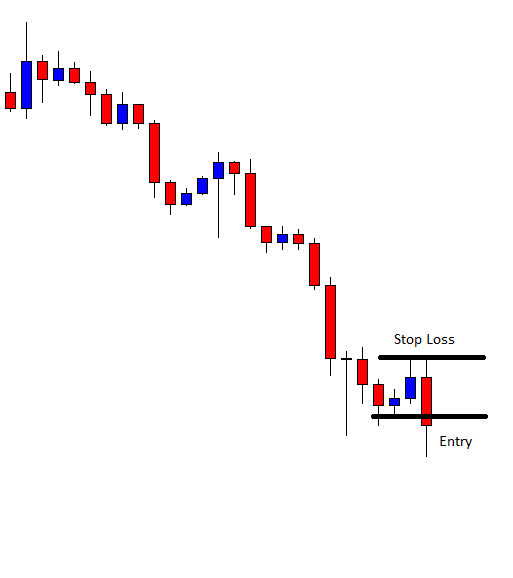
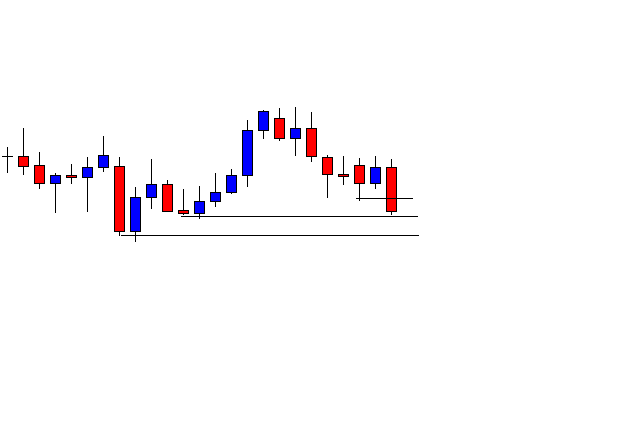
Non-Restrictive Triangles
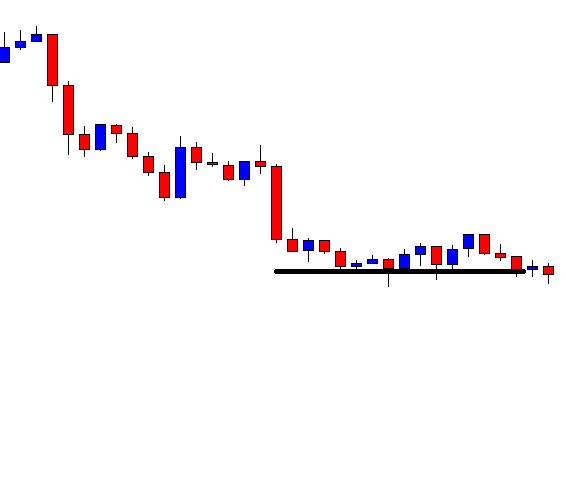
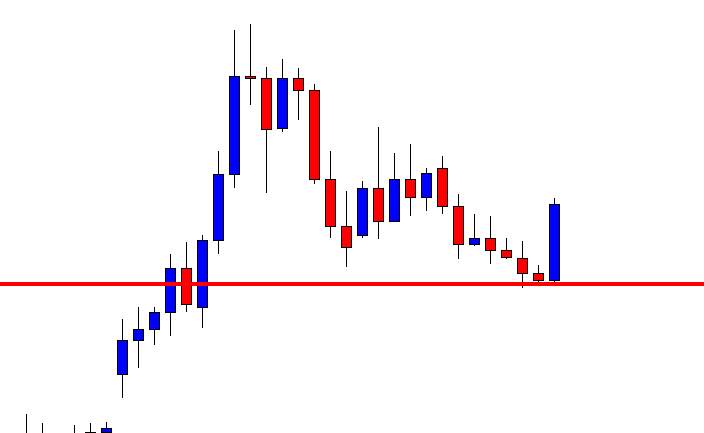
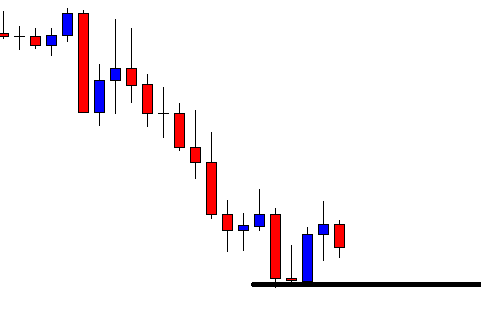
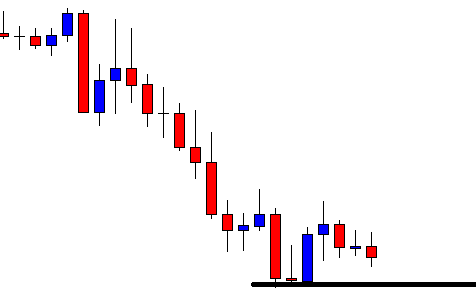
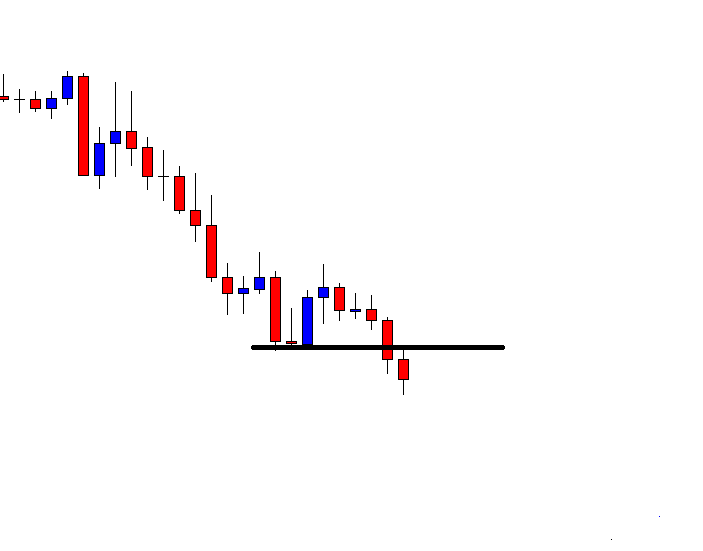
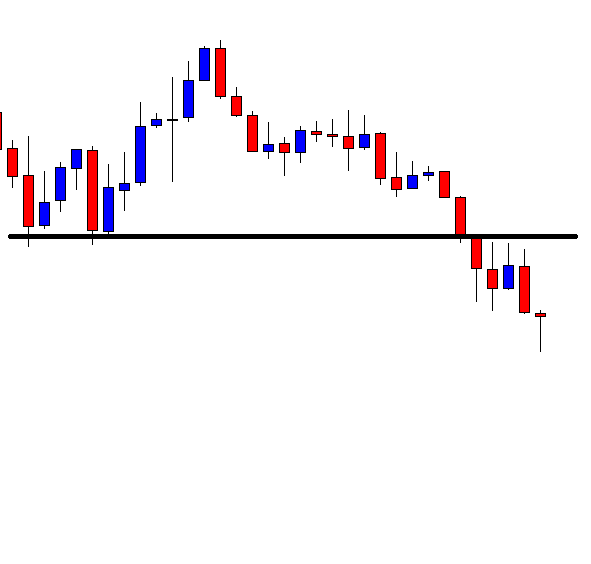
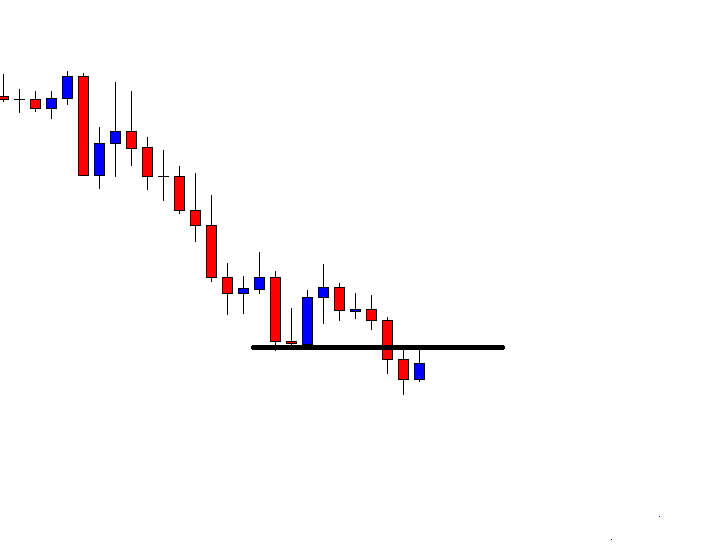
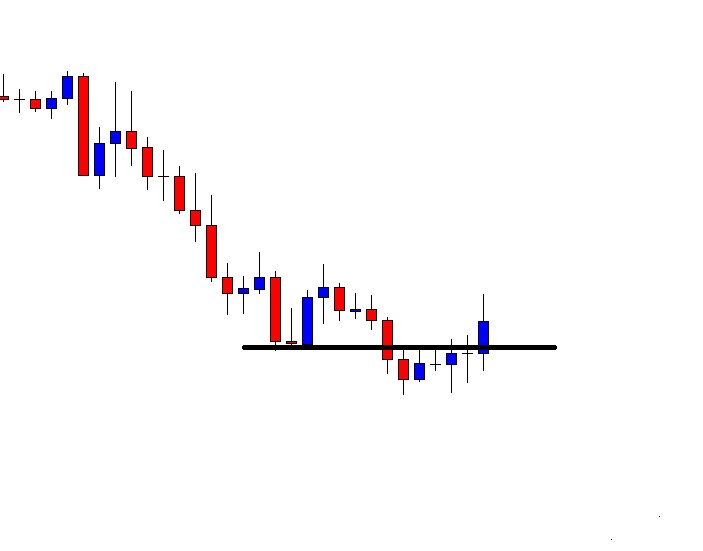
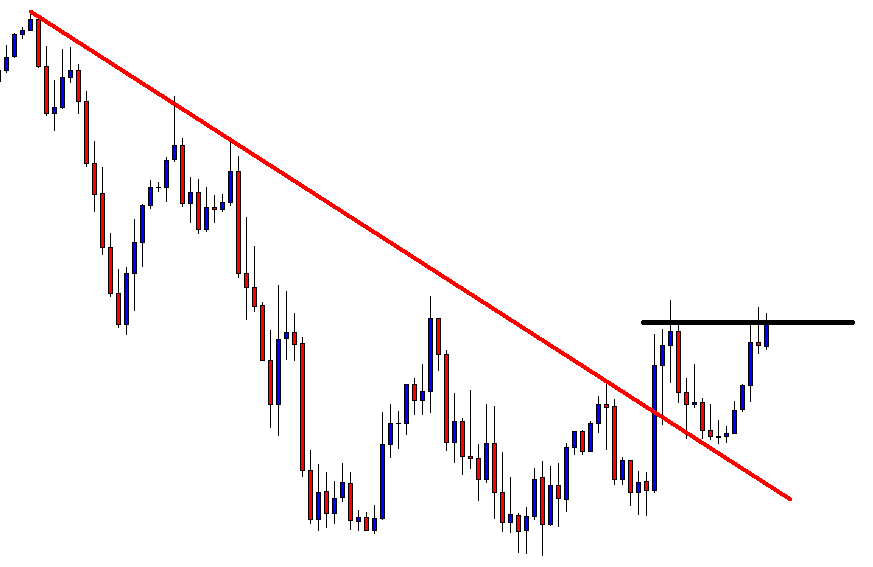
This sub-group of triangles is characterized by locates in any other part of the wave cycle, not exclusively in waves 4 or B. The knowledge of this type of triangles could be useful to the wave analyst in the study of complex corrective patterns. This type of triangles tends to be produced at the end of complex corrections. Frequently, non-restrictive triangles tend to be more simple to identify than restrictive triangles.
- Wave A. This segment tends to be the most volatile in terms of price at the time of the triangle. According to the alternation principle, if wave A is violent and takes a small portion of its completion, wave B will be slower and complex than wave A.
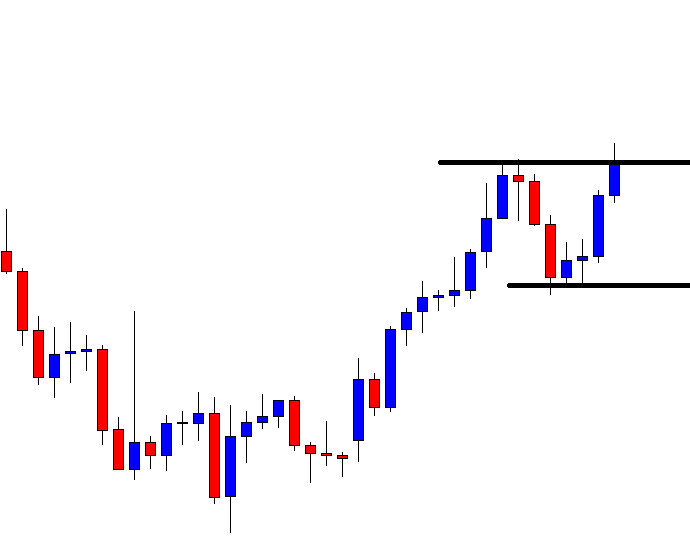
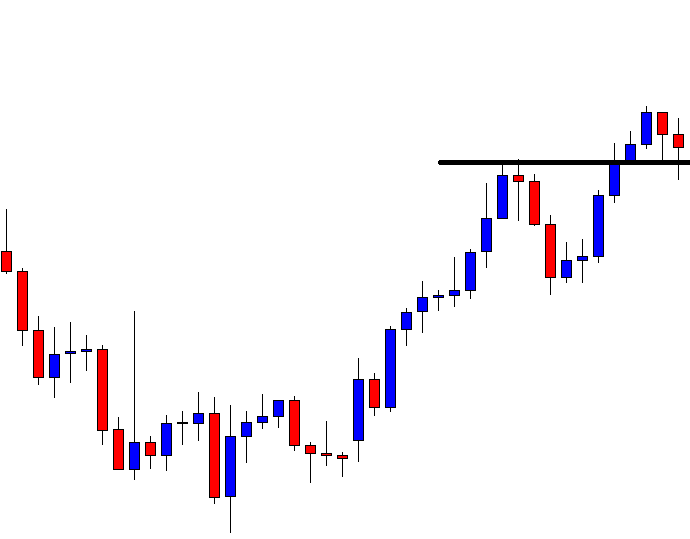
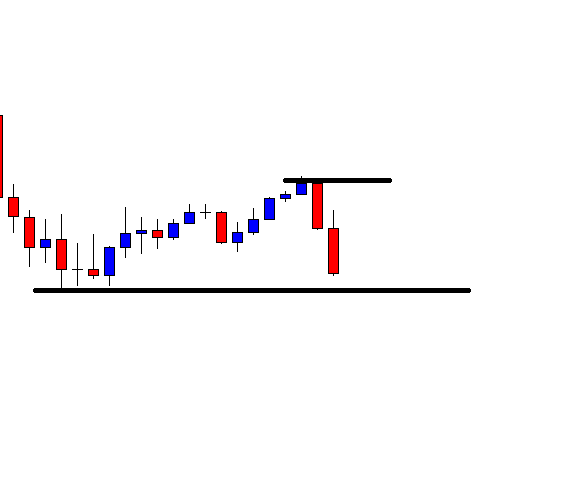
- Wave E. In this scenario, the last segment of a non-restrictive contracting triangle, tends to develop a non-restrictive triangle. In other words, wave E could make a triangle inside a triangle of the upper degree. From the different types of non-restrictive triangles, the horizontal triangle tends to be the most common in the real market. The following list exposes the parts where the non-restrictive triangle.
- Wave E in a horizontal triangle.
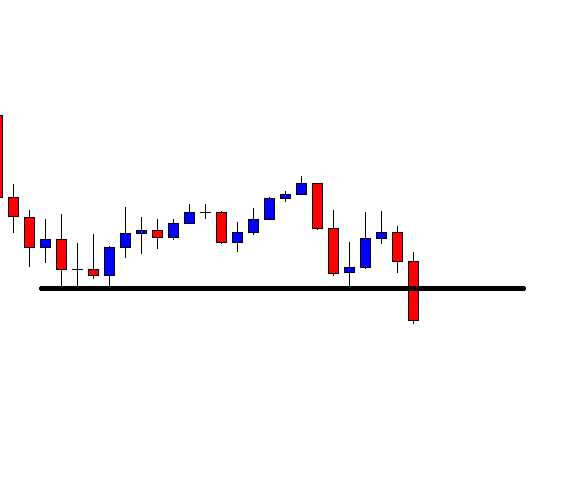
- Last movement of a complex correction as a double or triple corrective pattern.
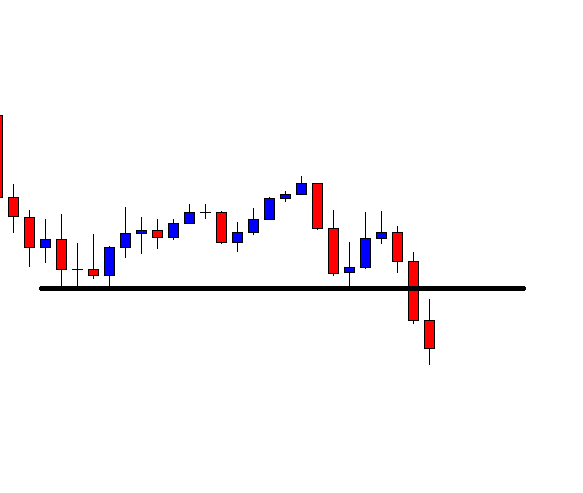
- The fifth wave of an impulsive terminal structure.
- The wave X of a complex correction.
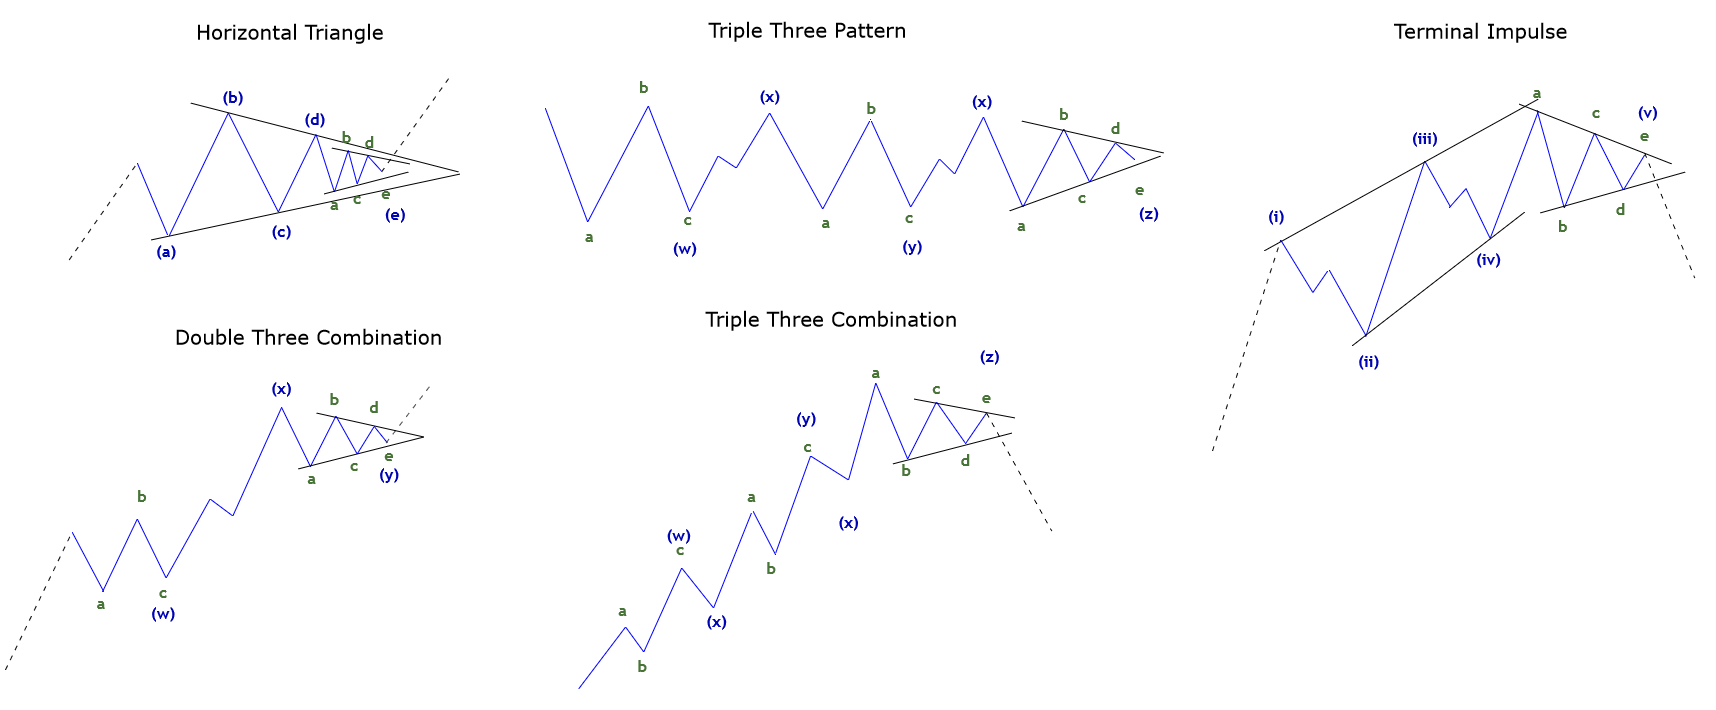
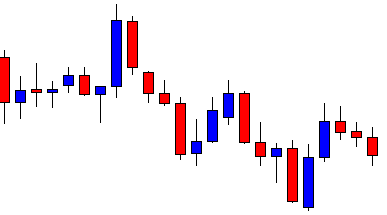
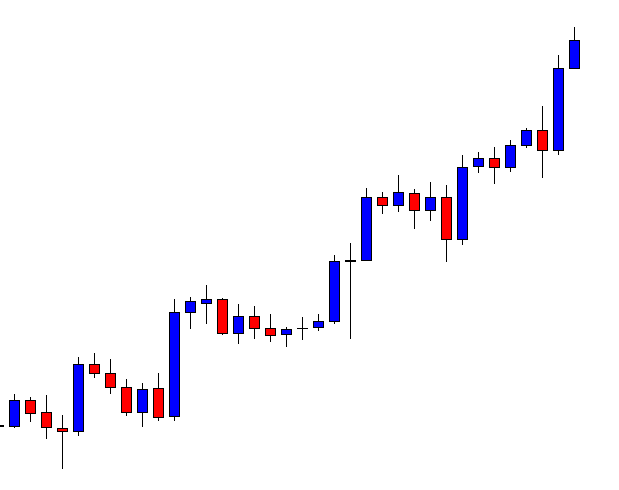
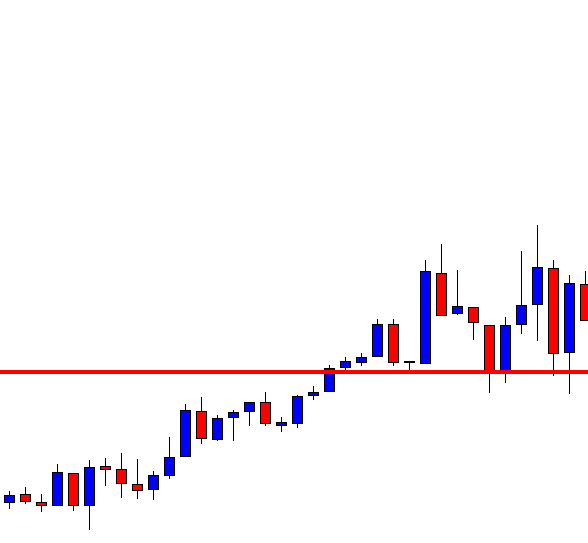
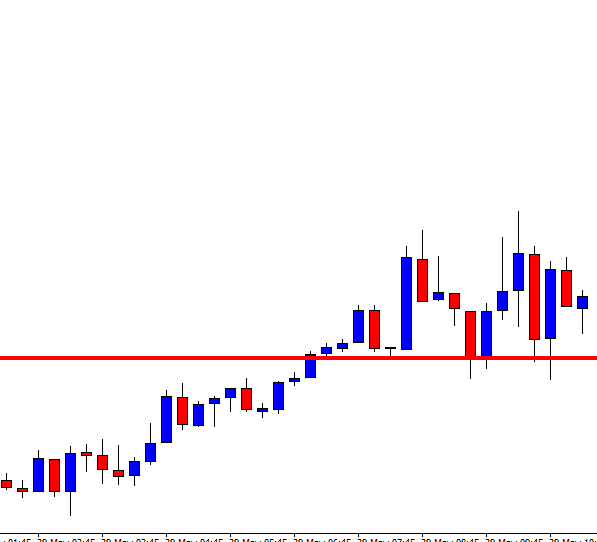
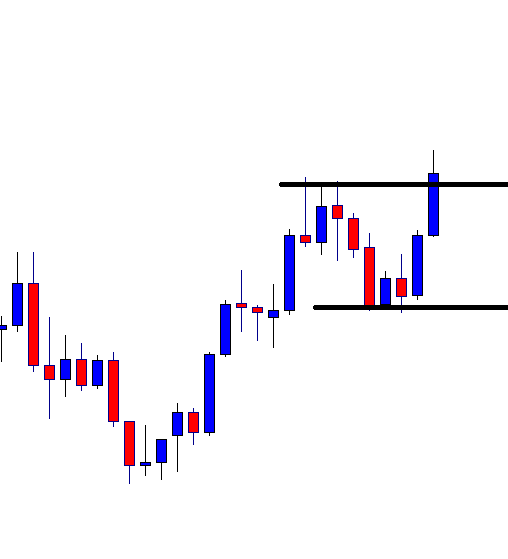
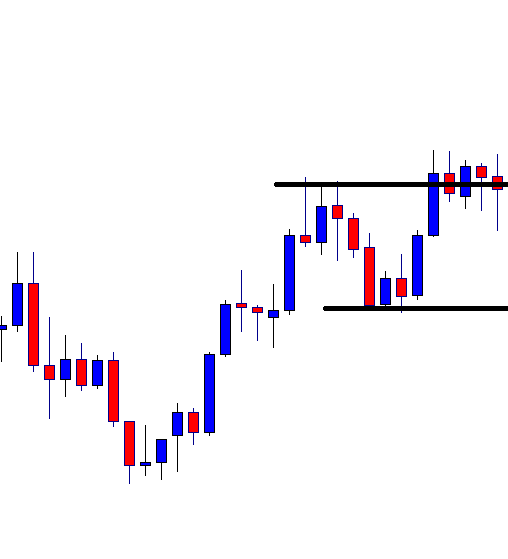
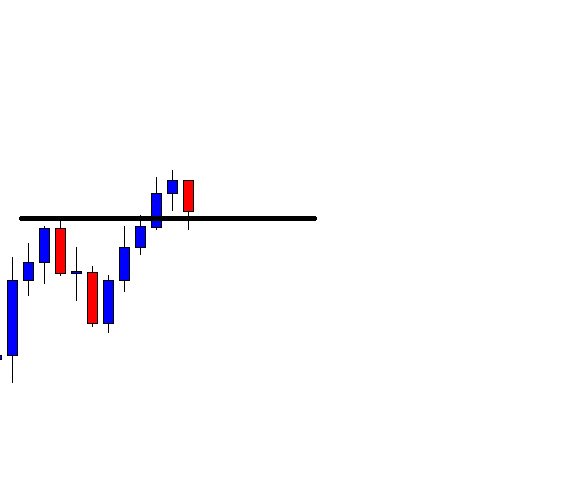
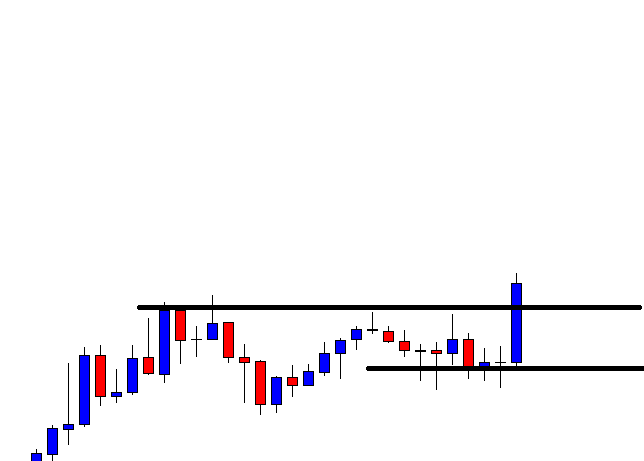
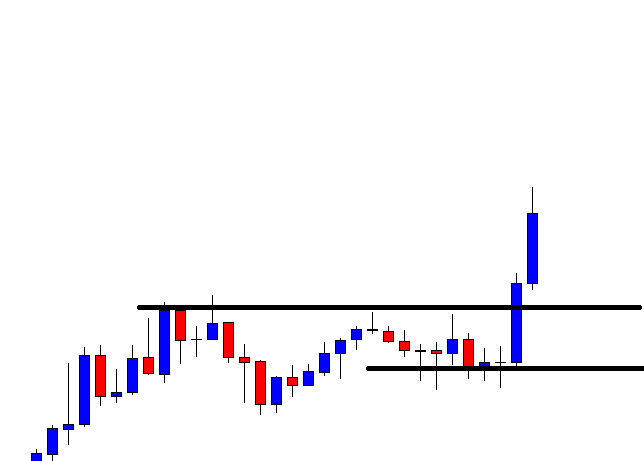
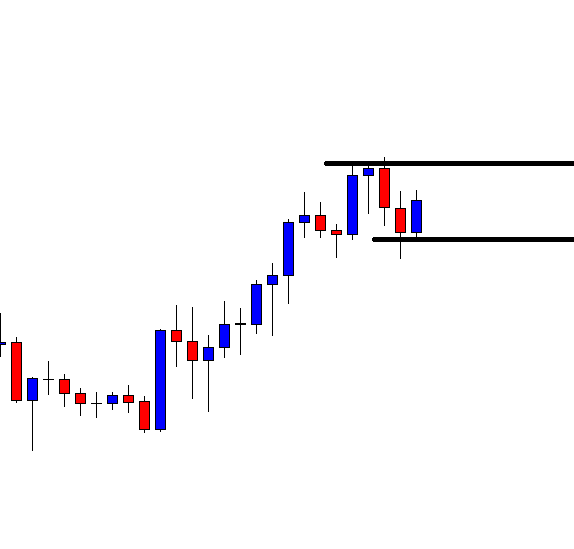
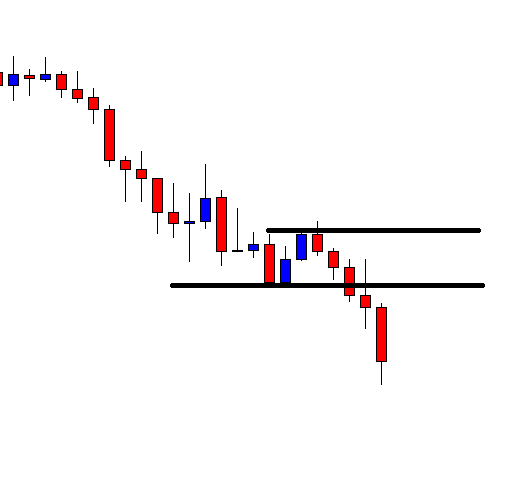
Expanding Triangles
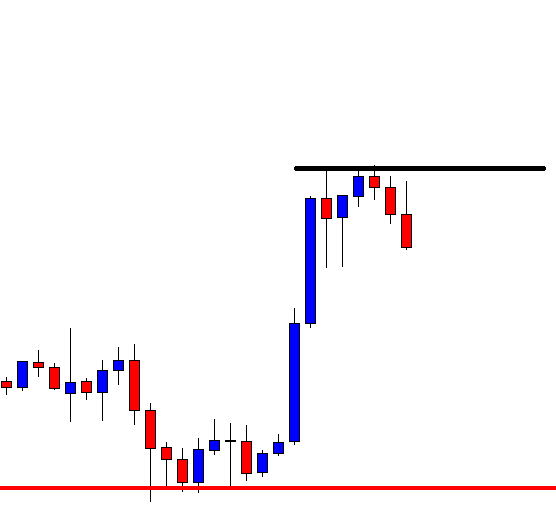
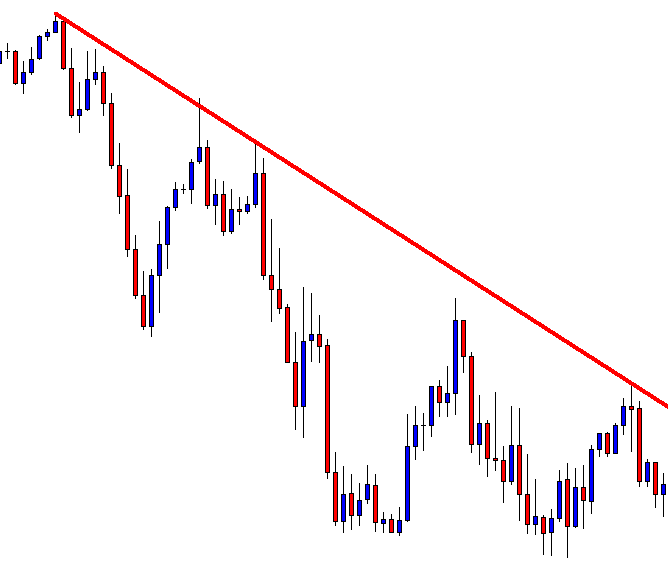
The expanding triangle tends to cheat the wave analyst more than the contracting triangle. This situation occurs because when the price moves in a volatile session, it tends to create a false breakout and quickly resuming its original trend.
The main characteristics of an expanding triangle are:
- Wave A or wave B will be the shortest wave of the triangle.
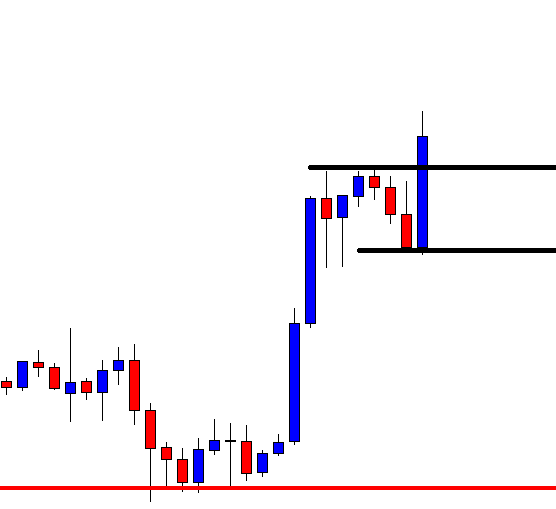
- Wave E tends to develop an explosive movement, higher in terms of price and time than the other waves.
- In the same way that in contracting triangles, a contracting triangle can produce in wave E, in an expanding triangle, it can construct an expanding triangle.
- The next movement of the triangle, which could correspond to wave C or 5, should not retrace the advance of wave E entirely.
- The expanding triangle usually does not follow any Fibonacci relationship.
- Expanding triangles normally occurs after a powerful movement such as an extended wave or an extended wave C.
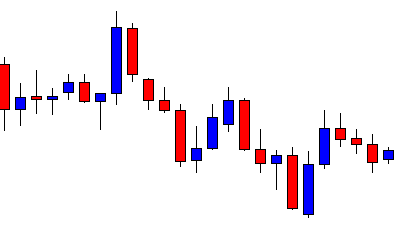
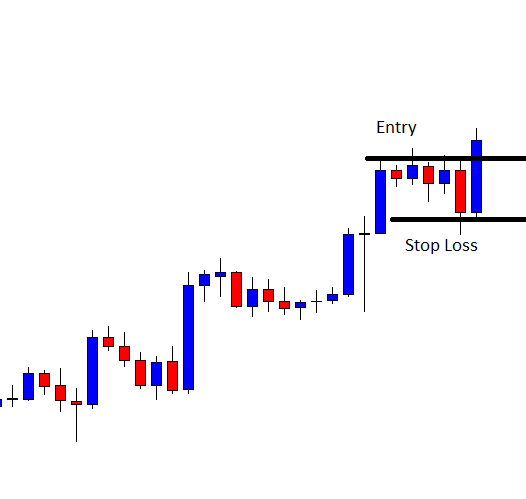
Restrictive Expanding Triangles
The restrictive expanding triangle tends to be placed in waves 4 and B. If the expanding triangle locates in wave B, the triangle belongs to a flat pattern. The rules applied to this group of expanding triangles are as follows:
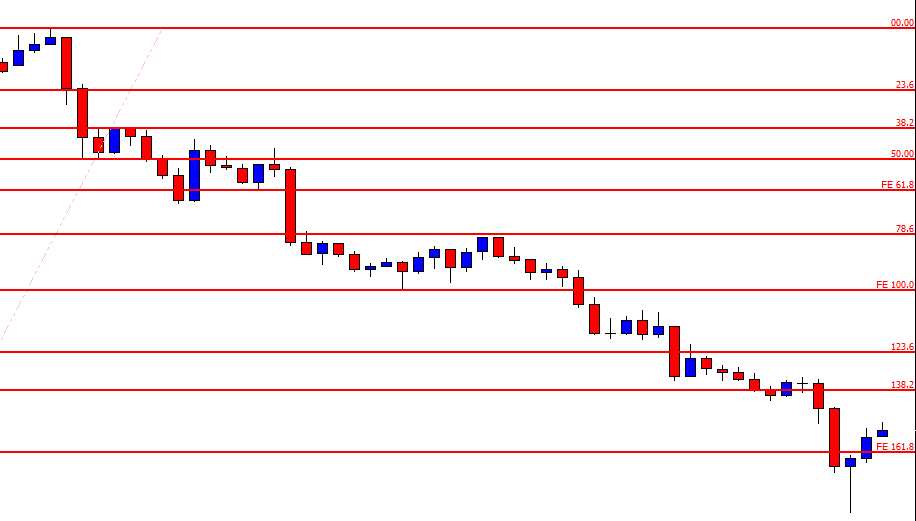
- Waves A and E will be related through a 161.8%, being the wave E the largest segment.
- Wave A or B must be the shortest segment of the triangle.
- Only wave B or D can fail to try to surpass the previous wave.
Horizontal Expanding Triangle. The characteristics of this pattern are as follows:
- Wave A is the shortest segment of the triangle.
- Each leg after wave A will be larger than the previous segment.
- Wave E should be the most volatile, complex, and longer terms of time than the other waves.
- Wave E tends to be 161.8% of wave A.
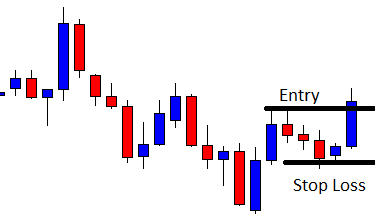
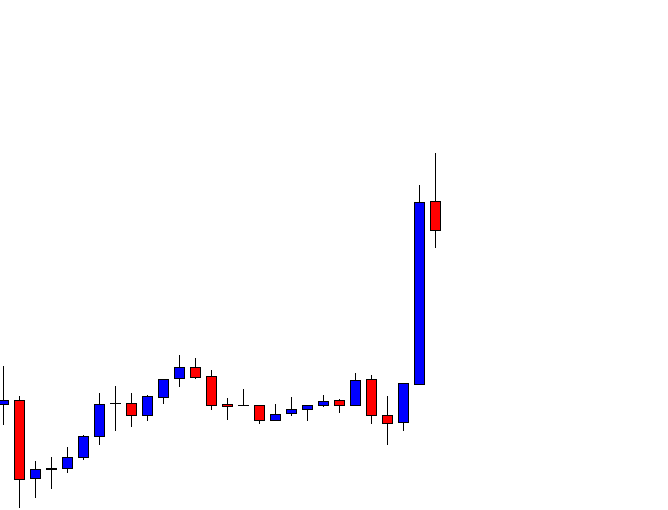
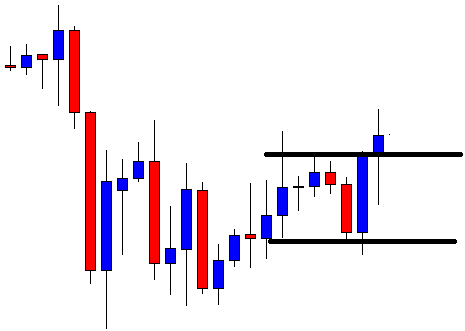
Irregular Expanding Triangle. This variation of the expanding triangle is the most common to find in the real market. The main characteristic of this variation is that every time that wave B try to surpass to wave A fails in its advance. Wave E and A are show a 161.8% relationship, being wave E the longest segment.
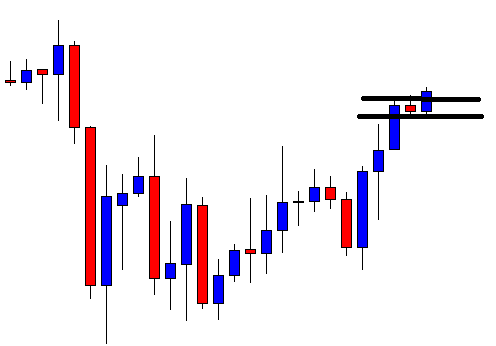
Continuous Expanding Triangle. This type of restrictive expanding triangle is the second most common pattern to find in the real market. The continuous triangle characterizes by failing when this tries to surpass the end of wave C. If wave D fails, the pattern could show a slight bullish or bearish bias. Finally, waves A and E will be related in a 261.8%, being wave E the longest segment.
Non-Restrictive Expanding Triangles
The non-restrictive expanding triangle pattern follows the same conditions as restrictive expanding triangles. Its main characteristics are as follows:
- Usually, they don’t have any Fibonacci relationship in their internal segments. The only relationship could be found on waves A and E, where wave E length could be 261.8% of wave A length.
- The apex of the expanding triangle occurs before the triangle. If the apex occurs between 20% and the start of the expanding triangle, the formation should be non-restrictive.
Conclusions
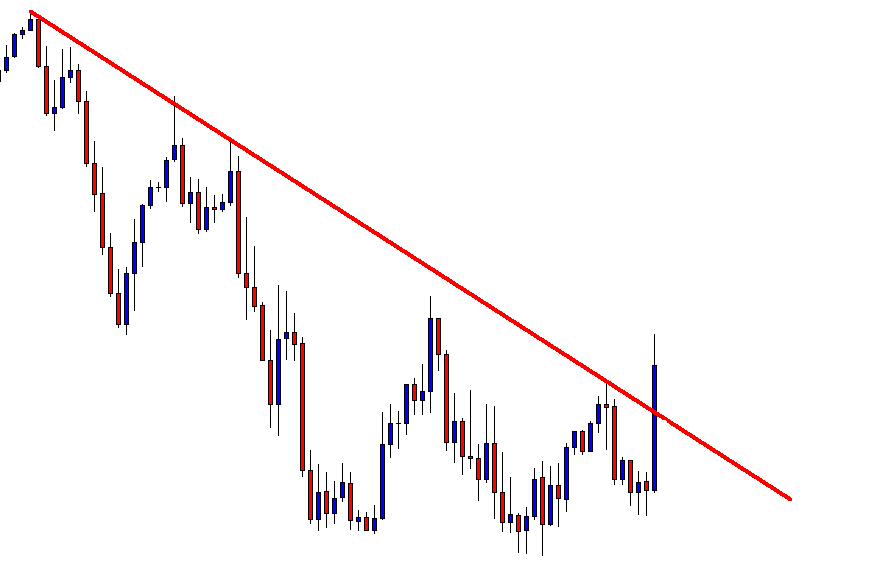
In this educational article, corresponding to the last part of our four-part series covering the triangle pattern, we presented in the first section, the Non-Restrictive Contracting triangle. This group of contracting triangles tends to appear at the end of complex corrections, or the end of an impulsive terminal structure.
The second section corresponds to the expanding triangles, which are characterized by tricking the different market participants, who tend to think that the market has reversed and, after its last volatile movement corresponding to wave E, they discovered that the market in fact is resuming its previous trend.
Suggested Readings
- Neely, G.; Mastering Elliott Wave: Presenting the Neely Method; Windsor Books; 2nd Edition (1990).