
We are going to demonstrate an example of trendline trading in today’s lesson. The price, after being bearish, produces a bullish engulfing candle and heads towards the North. It makes a bearish correction and produces another bullish candle to make a bullish breakout at the last swing high. At the second bounce, the candles have tiny lower shadows. In the end, the pair makes another bullish move at the trendline’s support without counting those lower shadows at the second bounce. Let us now have a look at what and how that happens.

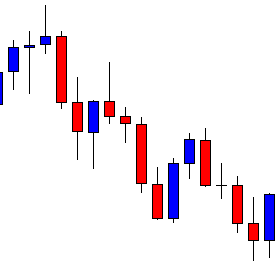
The price makes a bearish move makes a bullish correction and resumes its bearish journey. Upon finding its support, it produces a bullish engulfing candle at the last bounce in this chart. The chart is slightly bearish biased. Let us see what happens next.
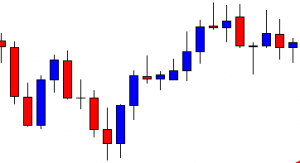
The chart produces another bullish candle, consolidates, and heads towards the North. Then, it makes a bearish correction. A bullish reversal candle followed by a breakout at the highest high will make the chart a hunting ground for the buyers.
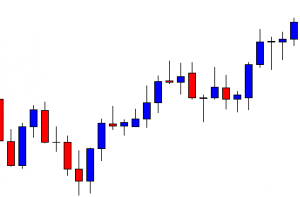
The chart produces a bullish engulfing candle and makes a breakout at the last swing high. It means the buyers may draw a trendline and wait for the price to come back at the trendline’s support to go long in the pair.
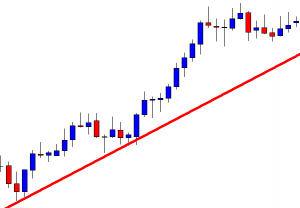
This is the drawn trendline, which is drawn by using the first two spikes. However, spikes at the second bounce are not counted. After the second bounce, the price heads towards the North, but it doesn’t come at the trendline’ support to offer a long entry to the buyers. As long as the price does not breach the trendline support, it is valid, and traders may wait for the price to come back at the trendline’s support and offer them a long entry.
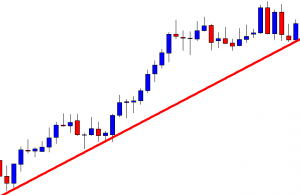
Here it comes. The chart produces a bullish engulfing candle right at the trendline’s support. The buyers may go long right after the last candle closes by setting stop loss below the signal candle’s lowest low and by setting take profit with 1R. Let us find out how the trade goes.
The price hits 1R in a hurry. It then produces a spinning top. However, the next candle comes out as a bullish engulfing candle, which suggests that the buyers may wait again for the price to come back at trendline’s support to take another long entry.
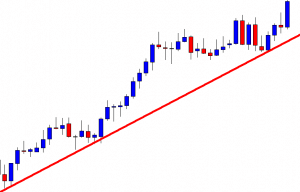
If we use spikes of the second bounce, the trendline’s support would have more space for the price to travel. We have used spikes of the first bounce and candle’s bodies of the second bounce. Since both spikes of the second bounce cannot be added with a line, it is better to skip it. Moreover, the price at the third bounce produces a bullish engulfing candle. Most probably, the price is going to obey the trendline. This is what happens here, and this is what usually happens with a trendline.