
In today’s lesson, we are going to demonstrate an example of a chart that trends towards the North by obeying a trendline. It offers a long entry once the trendline is established. At the fourth bounce, it produces a bullish reversal candle. We find out whether the buyers should take a long entry or not upon getting the bullish reversal candle at the trendline’s support. Let us get started.
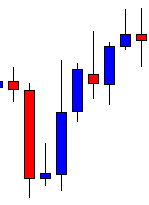
The chart shows that the price heads towards the North upon producing a bullish reversal candle. It consolidates and resumes its bullish journey. The chart looks like the buyers’ hunting ground.
The price upon producing a spinning top, it produces a long bearish candle. It consolidates with some candles and produces a bullish engulfing candle. The buyers may keep an eye in the chart to go long above the last swing high. If the price makes a bullish breakout, the buyers get two swing lows and two swing highs to draw an uptrending trend line.
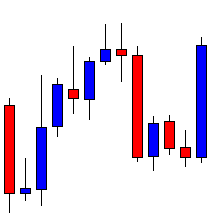
Here it goes. The price makes a bullish breakout and heads towards the North further. The chart produces a bearish engulfing candle. It may make a bearish correction. As it looks, the chart belongs to the Bull without any doubt.
The price makes a bearish correction; consolidates and heads towards the North again. The breakout traders may find a long opportunity and grab some pips. The price makes a long bearish correction. In fact, it makes a breakout at a significant level of swing low. It seems that the chart is slightly bearish biased. Have a look at the chart below.
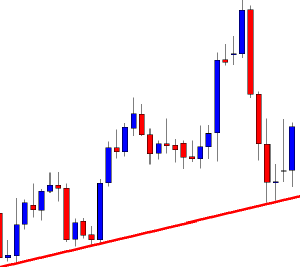
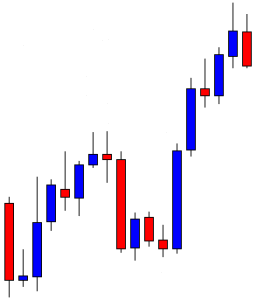
The trendline’s support holds the price and produces a bullish engulfing candle. The trendline traders may go long in the pair right after the last candle closes. The last swing high is the safest option to set take profit. It means the risk-reward ratio looks good for the trendline traders.
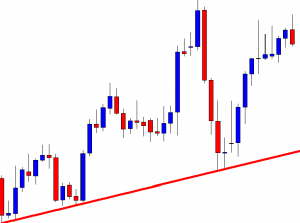
The price heads towards the North with good bullish momentum. However, it seems that the horizontal level of resistance is too strong to be breached. The price consolidates here with several candles. The last candle comes out as a bearish engulfing candle. The buyers may close the entry. The question is does the price come back to the trendline’s support or it makes a breakout at the highest high. Let us proceed to the next chart and find out what happens.
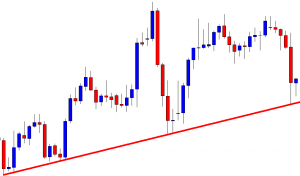
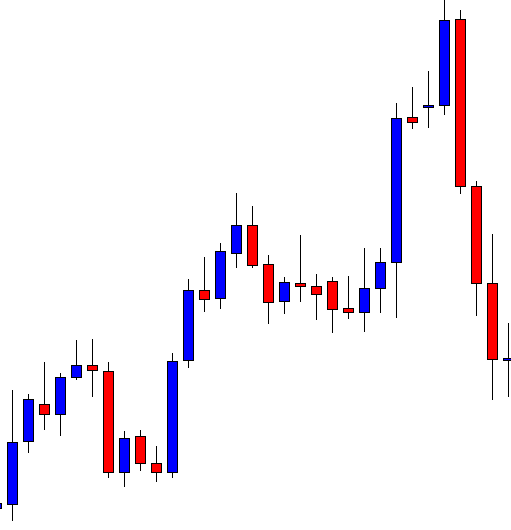
The price comes back at the trendline’s support. It produces a hammer. Should the buyers go long from here as far as trendline trading is concerned? Think about it for a minute.
If your answer is ‘No’, you are right. The reason why the buyers should not go long from here is it does not make a new higher high upon getting its last bounce. In fact, traders may wait for the price to make a breakout at the trendline’s support and go short in the pair. In our forthcoming lessons, we will learn about trendline breakout and trendline breakout trading. Stay tuned.