Categories
Forex Chart Basics Forex Daily Topic

Caution! A Big Round Number Ahead

In today’s lesson, we are going to demonstrate an event to find out what the price may do around the big round number. A big round number plays a significant role as far as traders’ psychology is concerned. The price usually gets volatile around a big round number. It may get tough for the traders to find out entries around the big round number. Let us now dig into USDCHF recent activities around the big round number 1.00000.

The price is heading towards the North with good bullish momentum. Look at the last candle. This is one good bullish candle, which states that the buyers are dominating the pair. Do you notice anything unusual here?

Here it is. The candle breaches through the level of 1.00000. As a trader, you must not miss such a big round number. Now that the price makes a breakout, you are to wait for the breakout confirmation and a strong bullish reversal candle to go long on the pair. This might be one of the best trades in your trading life if things go accordingly.

The price comes back in. However, it still looks all right for the buyers since if we consider the spikes at the last swing high. A bullish engulfing candle closing above the last bearish candle would be the buying signal. On the other hand, if it keeps going towards the downside, the sellers may take over the baton.

The price does not produce any bullish momentum. For the last four H4 candles, it could go either way. Traders are to wait patiently since this is the game around a massive round number.

Here it comes. It has now become sellers’ territory. The candle forms right at the level of 1.00000. The level could have been a level of support. It is now a level of resistance. The sellers on the minor charts keep going short; on this chart, they are to wait for consolidation and downside breakout to ride on the next bearish wave.

It consolidates and produces a sell signal after four H4 candles. The last H4 candle suggests it may be time for the price to consolidate again. An explicit bullish breakout at the level of 1.00000, did not work for the buyers. It could happen at any level, but when we deal with a massive round number, we happen to see it more often.

The Bottom Line

The market runs on many aspects, and traders’ psychology is one of them. Many traders set their Stop Loss and Take Profit at round numbers. Thus, the price may get extra volatility around a big round number. We may get breakout even on the H4 chart, which may turn out to be a fake breakout. We must remember this every time we see a big round number.


Categories
Forex Basic Strategies

Is Drawing One Trendline Enough?

The Trendline is an excellent trading tool that the price action traders love using on their charts. Drawing trendline as accurate as it can get and adjustment with spikes are two factors that traders are to look after before using trendline. Another factor trendline traders often need to do is drawing multiple trendlines on the same chart. In this lesson, we are going to demonstrate an example of that.

The chart shows that the price after finding its support at the trendline heads towards the North and makes a new highest high. Thus, this is a valid trendline. Ideally, the buyers are to wait for the price to come back to the trendline again and to produce a bullish reversal candle to go long on the pair. Let us proceed to find out what happens next.

The price does not come at the trendline. It finds its support well above the trendline and heads towards the North again. This is annoying, is not it? Do not get annoyed. Concentrate on the chart. Do you see anything interesting? Have a look at the next chart.

We can draw another trendline on the same chart since the price has a bounce and makes a new highest high. Traders are to wait again for the price to come back at the trendline and to produce a bullish reversal candle to offer them a long entry.

Wow, this time, the price comes at the trendline and produces a bullish reversal candle. Traders have been waiting for such price action. By flipping over to the next chart and an upside breakout, traders may grab some green pips.

The chart shows that the price comes back near the trendline’s support again, then heads towards the North. It consolidates hard on the minor charts, as it seems. The point here is that the price does not come at the first drawn trendline or produces a bullish reversal candle. It comes at the second drawn line, and this time, it creates the bullish reversal candle right at the trendline’s support. It heads towards the North and may have offered entry as well.

The Bottom Line

In most cases, the price does not come at the first drawn trendline. It has the tendency to come at the second drawn trendline more. It is often seen that the price obeys the third drawn trendline as well. Thus, if we are to trade on the trendline, we may keep an eye on the chart to draw a trendline as many times as we need to.

Categories
Forex Basics Forex Daily Topic

A Breakout Brings More Momentum than any Other Trading Factor

A Breakout Brings More Momentum than any Other Trading Factor

A bearish engulfing candle at a Double Top or consolidation resistance is an excellent signal to go short. However, if a bearish engulfing candle closes right within the support level, it sometimes may create an upside momentum on the minor charts. In today’s article, we are going to demonstrate an example of that.

The price heads towards the North with strong bullish momentum. Ideally, traders are to look for opportunities to go long here upon consolidation, followed by upside breakout. The last candle comes out as a bearish candle. It may consolidate and make an upside breakout as things look. Let us go to the next chart to find out what happens next.

The pair produces a bearish engulfing candle. Several rejections and a bearish engulfing candle suggest that traders may want to go short on the pair. If they’re going to go short from here, they are to flip over to the H1 chart since it is an H4 chart. For a reason, I am not showing the H1 chart since the H4 chart itself tells the story that I want to share. Let us look at the H4 chart with another equation.

The candle closes right at a level where the price has bounced earlier. This is an explicit support level, which may play an essential part in the minor charts. Soon we find out how the pair reacts from here.

Look at the last candle. The candle comes out as a bearish engulfing candle. However, look at the upper shadow. It goes up to the consolidation resistance. With some brokers, because of the high spread factor, some traders’ Stop Loss may be swept away. The last candle, after having a strong rejection at around the resistance level, closes below the support. The sellers are to flip over to the H1 chart, wait for consolidation and bearish breakout to go short on the pair.

Again, I am presenting the H4 chart to show the next price movement.

The price does not look back this time. It heads towards the South with strong bearish momentum. The H1 chart may have offered some entries, as well. What lesson do we get from these examples?

  1. In an H4-H1 combination, after an H4 reversal candle, traders are to flip over to the H1 chart to take an entry.
  2. The last swing high or swing low on the H4 chart is to be counted.
  3. If the reversal candle closes right within the last swing high or swing low, it may push the price towards another direction, produce spike and sweep away our Stop Losses.
Categories
Forex Psychology

What Wastage of Time!

The H4-H1 combination is one of the best combinations to trade for intraday traders. The H4 chart is the most consistent intraday chart in the Forex market. The H1 chart integration with the H4 chart offers many reliable entries. However, it is often seen that the H4 chart doest its part, but the signal never comes on the H1 chart. In today’s lesson, we are going to demonstrate an example of an H4-H1 chart combination, which is about to give us entry, but it ends up not producing a trading signal. Let us find out how the story goes.

The price after being bullish on the H4 chart, it has several rejections at a level. The last bearish candle gets rejected at a Double Top resistance. The sellers are to flip over the H1 chart and wait for the H1 consolidation and H1 bearish breakout to go short. However, it is an Inside Bar. It may not attract the sellers that much. Let us proceed to the next chart.

This is the H4 chart, as well. The price does not head towards the South on the H1 chart. It rather produces an H4 bullish candle followed by an H4 bearish engulfing candle. This time it may attract more sellers to be keen on selling opportunities. They are to flip over to the H1 chart again. Let us have a look at how the H1 chart looks.

This is the H1 chart. The last candle comes out as a bearish engulfing candle. The sellers are to stick with the chart to wait for consolidation and to get a breakout to go short. The waiting game starts.

The price keeps going towards the South without having any consolidation. Since the sellers do not find new resistance, thus there is no entry for them yet. Let us not give up but wait for consolidation.

The consolidation starts, but it does not make any H1 breakout to make the new lowest low. It rather finds a level of support where it has several bounces. It is a ‘Double Bottom’ support. The way things look now, it may head towards the North if the price breaches the neckline. All anticipations and hopes have gone in vain. Some traders may think, “what wastage of time.”

If you think it is a wastage of time, you are far away from being a professional trader. 70% of your trade setup like this may end up not offering an entry. Never think it is a waste of time. Take it easy. Each potential setup does not offer an entry. Concentrate and find out more setups in other pairs. It must be round the corner.

Categories
Forex Basic Strategies

The H4-H1, an Action-Packed Combination

In today’s lesson, we are going to demonstrate an example of the H4 and the H1 chart combination for taking entries. Both are intraday charts. A large number of traders do the job using those two charts. Thus, it is an excellent combination to trade in the Forex market.

Let us get started.

This is an H4 chart. The chart shows that the price heads towards the North. On its way, it made an upside breakout, which may play a vital role in pushing the price towards the North further. Despite having a long lower shadow, the last candle comes out as an Engulfing candle. The price may start its correction this time.

As expected, the price comes down to the flipped support and produces a bullish engulfing candle. The last swing high is far enough to offer a 1:1 risk-reward. However, we do not take an entry right after the candle H4 closes. We rather switch over to the H1 chart.

This is how the H1 chart looks. It shows that the price starts having correction by producing a Doji candle. An engulfing bullish candle closing above the Doji candle is the signal to go long here. Let us wait for a Marubozu bullish candle.

This is one good-looking Marubozu bullish candle. However, it closes right at the resistance zone. Risk-reward is 100:0 here. We must wait for an H1 consolidation and breakout towards the upside to take a long entry.

Here they come. The price consolidates and produces an H1 bullish candle, which closes above the resistance. Traders may trigger a long entry right after the candle closes by setting stop loss below the last support. The H1 chart does not show any resistance nearby. Thus, the price may head towards the North with good bullish momentum. It may get us 1:2 risk-reward or even more. Usually, the price reverses once 1:1 risk-reward is achieved. Let us find out what happens here.

The price consolidates much earlier than our expectations. Our reward is not achieved. Thus, we keep holding our position. We are risking a loss here. However, we must keep our patience.

The price makes another upside breakout and heads towards the North. The wave gets us our expected reward and starts having a pullback. If we have not set our take profit, we may manually close it; or we may use a trailing stop loss. We will demonstrate some examples of using trailing stop loss in this combination in upcoming lessons.

The Bottom Line

The H4-H1 combination is an eventful combination. A Trader needs to have skill, expertise, experience, and patience to handle it. Once he learns it well, it may have his hands full in making money by trading.

Categories
Forex Basic Strategies Forex Daily Topic

A Story of an Early Exit

Risk-Reward is a factor, which every successful trader takes care of. Before choosing a chart to take an entry, the first thing that is to be considered is the trend, then the risk-reward factor. Once we have set our Take Profit and Stop Loss level, we shall leave the entry either to hit the Stop Loss or the Profit Target. However, today, we are going to demonstrate an example of an early exit.

This is an H4 chart. The chart shows that the price has found its support as well as a resistance zone. After having a final rejection, it makes a move towards the downside. Then, it heads towards the North now (see the next image). Another rejection and bearish reversal candle at the resistance zone may produce a short entry.

The last H4 candle is bullish. However, the candle closes within the resistance zone. It may go either way. The buyers may get an upside breakout; the sellers may get a bearish reversal. Let us proceed to find out what happens next.

In the above chart, we can see one good-looking bearish Marubozu candle. The candle suggests that the sellers may wait for consolidation and downside breakout to take a short entry. The candle forms at a Double Top resistance as well. The price may consolidate around the neckline level.

As expected, the price starts having correction around the neckline level. It needs to find its resistance and produce an H4 bearish reversal candle along with a breakout at the neckline.

Here it comes. The last candle engulfs all the candles by closing below the neckline. An entry may be triggered right after the candle closes. The price has enough space to travel down to the red-marked line, which allows an excellent risk-reward. However, there is a support level in between, that may hold the price for a while.

The price heads towards that level with good bearish momentum. The way it has been going, it may hit the red-marked level within four/five H4 candles. This means one more trading day may be required to hit the original Take-Profit level.

The in-between level is a vital level, which produces the H4 bullish reversal candle. The price has reacted several times at that level earlier. Usually, we must stick with our original Profit-taking target. However, it is also legit to close our entry right after the last candle closes. A question may be raised “why do we close our entry here?”

Reasons for Early Exit

There are two reasons

  1. The support level is significantly strong
  2. The current bar is the last H4 Friday’s candle, which means the market closes once the candle is finished.

The Bottom Line

When using the Weekly and the Daily charts, traders are to let their opened positions to reach the target during the weekend. However, intraday traders should consider closing their floating trade before the week’s end. Mondays often start with a big gap, which may hurt intraday Stop Losses.


Categories
Forex Basics Forex Daily Topic

A Winner is Not Always a Good Trade

Price action traders use chart combinations such as Weekly-Daily, Daily-H4, H4-H1, and H1-15M, etc. Intraday minor charts’ traders such as the H1, 15M, 5M do not have an undeviating relation with the daily chart. However, it is often seen that if the daily price action is choppy, it gets tough to find out a good entry for the intraday traders. Notably, on a choppy daily chat, it gets extremely tough for the H4 traders to find an entry with good risk-reward. Thus, even a trade that gets us profit may not always be a good one. Let us demonstrate an example of that.

This is a daily chart, which shows that the price action has been choppy. It gets caught within a bullish rectangle. The daily traders are to wait for a breakout. However, the H4 traders know the range. Thus, they are to wait for a daily bearish reversal at the resistance zone and bullish reversal at the support zone. Let us see where it produces the next reversal.

The chart produces an Inverted Hammer right at the resistance. The H4 traders are to flip over the chart; wait for consolidation and bearish breakout to take a short entry. The risk-reward looks good here.

The H4 chart shows the last candle comes out as a bearish candle. If the price consolidates with the support of the candle’s lowest low, a bearish breakout will be the signal to go short.

The next candle comes out as another bearish candle. The candle has a bounce at H4 support, as well. If the price consolidates and makes a bearish breakout, the sellers may take a short entry. There is still space for the price to travel towards the downside.

The price consolidates and makes a breakout at the support. The breakout candle looks good. By setting Stop Loss at the consolidation resistance, a short entry may be triggered right after the last candle closes. Take Profit shall be placed at the red-marked level. Let us find out whether it hits Take Profit.

It does. It gets us profit. The question is whether it is a good trade or not. As far as risk-reward is concerned, it is not a good entry. It gets us less reward than the risk. Thus, traders shall skip taking that entry in the first place.

The Bottom Line

Price action traders may find many trade setups that match with all the norms for taking an entry. However, they must consider risk-reward on every single trade. If it offers less than 1:1 risk-reward, they shall avoid taking that entry. In most cases, an entry offering less than 1:1 risk-reward has less chance to be a winning trade as well. In this example, it is a winner. However, considering entire facts, it is not a good entry.

Categories
Forex Psychology

Experiencing a Losing Trade

A losing trade hurts. Beginners find it tough to encounter losing trades. However, in the Forex market, losing is inevitable. The market is so action-packed that even an experienced trader often makes mistakes. Sometimes, even a good entry may not get us any profit. In today’s lesson, we are going to demonstrate an example of a good entry, which ends up being a losing trade in the end.

The price heads towards the North and makes a pullback. Traders are to wait for an upside breakout to take a long entry. A bullish Engulfing candle follows a Doji candle. As things stand, the buyers are to take the control soon upon an upside breakout.

Things are different now. The price comes down instead, by making a Double Top. It starts having the correction as well. Consolidation and bearish breakout shall attract the sellers to go short on the pair. Let us see the next chart.

The chart shows that the price is having a correction, where it had a bounce earlier. The equation is very simple here. A bullish reversal attracts the buyers, and a bearish breakout attracts the sellers to go short.

It makes a bearish breakout. The breakout candle looks good. As far as price action and candlestick pattern are concerned, this is an A+ short entry. Concentrate on the marked Stop Loss and Entry levels.

The next candle comes out as a bullish candle. The price may take out some of our entries because of the spread factor. With some brokers, traders pay more spread. Some of our trade (the same entry) may still survive. However, let us not get into this argument but proceed to the next chart. The following chart has an interesting scenario to present.

This should conclude the argument. The price hits the Stop Loss and heads towards the South again. The entry looks to be an A+ entry, but it has ended up bringing us a loss. As usual, beginners with average knowledge of price action may think that something must be wrong with his strategy.

This is not the case. An entry like this would bring us profit at least on 70% occasions. It hurts more since the candle, which hits our Stop Loss itself a strong bearish candle. This is how this market plays. We have to accept it. We must not let our losing trades occupy our thoughts. It is a game of probability of winning and losing. With knowledge, experience, and hard work, a trader can increase the likelihood of winning for sure.

Categories
Forex Psychology

A Lesson from a Failed Entry

In today’s lesson, we are going to demonstrate an example of a failed entry. We usually explain winning trade setups in our lessons. It teaches us how to win a trade on a setup like that and gives us more confidence as well. We are going to talk about a failed entry, which may hurt our confidence. However, the lesson that it teaches that may help us be a batter trader.

The price heads towards the North with good bullish momentum. Ideally, we shall look for long opportunities here upon consolidation and at a breakout at resistance. Let us find out what happens next.

The price consolidates, but it does not make any breakout. The last candle looks very bearish. The door is open for both the bull and the bear. Traders shall go long on an upside breakout and go short on a downside breakout. Let us find out which way it makes its next breakout.


The price heads towards the downside after making a breakout at support. It is a different ball game now. Traders are to look for short opportunities upon consolidation and downside breakout. Let us proceed to the next chart to find out what happens next.

Here comes the corrective candle. It is an Inside Bar. Thus, to sum up, the whole equation, the price consolidates after being bullish, makes a breakout at the support, the trend continues, produces a corrective candle (an Inside Bar). A bearish engulfing candle closing below the lowest low is the signal to go short here.

This is what I have meant. A bearish engulfing candle forms right after the corrective candle. The candle closes below the support, where the price reacted three times recently. If we consider the momentum of the last bearish candle, that gets ten on ten as well. Let us trigger a short entry.

Oh! The price goes another way round than our expectations. It hits the Stop Loss. We are to encounter a loss here. The first thing we shall do after a losing trade, we shall write all the details about the trade in our journal. If there is anything that we have missed from our trading strategy, we must find that out and write it in our journal.

As far as I am concerned, there is not anything wrong with the entry. It is an entry; I would take ten times out of ten opportunities. I have been working with the strategy for a long time. Thus, I can assure you I would win at least six entries out of those 10. This is the faith that a trader needs to have. A trader must not lose his faith in his proven strategy.

The Bottom Line

Never lose your faith in yourself and in your proven strategy. Do not let a losing trade hurt you psychologically.

Categories
Forex Basics

Importance of Timing in Trading

Timing is an essential factor in trading. Price action traders take entry on signal candle’s/bar’s attributes and support/resistance breakout. Many traders ignore the timing factor. However, it is an important factor when the signal candle is produced. In this article, we are going to demonstrate an example of the importance of timing in trading.

This is a daily chart. The price keeps going towards the South. Traders shall only look for selling opportunities in this chart on upward price correction/consolidation. Let us go to the next chart and find out what happens next.

The chart produces an engulfing bullish candle. It is a sign that the price may go towards the North. Intraday buyers such as 5M, 15M, H1 traders may look for long opportunities in this chart. The daily chart traders must wait for the correction/consolidation to get over upon a daily bearish reversal candle.

The price heads towards the North with good bullish momentum. The intraday buyers have made full use of the engulfing candle here. However, upper shadow and an Inside Bar suggest that a bearish reversal may come soon.

Here it is. A bearish engulfing candle suggests that it is time to look for short opportunities. It is a daily chart, so we shall flip over to the H4 chart to look for short opportunities.

The H4 chart shows that the price consolidates and makes a bearish move. However, support is still intact. The sellers must wait for a breakout at the support to go short on this chart. Let us draw the support line on the chart.

With an upward adjustment, the support lies at the black marked level. One of the H4 bearish candles is to breach the level for the sellers to get engaged in selling. Let us proceed to the next chart.

Concentrate on the chart. The chart has produced six candles since we have flipped over to the H4 chart. Six H4 candles mean a trading day is passed. Does it have any message to give us? We dig into the message later. Let us proceed to the next chart.

Wow! We have a breakout. Some traders may want to trigger an entry right after the candle closes. Let us find out what happens next.

The price starts heading towards the North. The price hits the Stop Loss. It even breaches the highest high of the wave. This is a different ball game now. If it were a technically right entry, we would not have talked about it. The thing is this one was a wrong entry, as the signal candle forms at the wrong time.

The signal candle does not form within the next trading day. It takes nine H4 candles to make the breakout. If the signal came within the first six candles, it would have been a valid trade. Since it comes at the ninth candle, it means the support has become daily support. Thus, an H4 breakout is not enough to drive the price towards the South. It goes towards the upside instead. The lesson we have learned here is, “A breakout is not a breakout if it does not take place at the right time.”

Categories
Forex Basic Strategies

Even a Choppy Price Action Offers Entries

The market moves in three ways upward, downward, and sideways. In today’s lesson, we are going to demonstrate an example of a Rectangle breakout and an entry from a choppy price action. Let us have a look at the chart below.

The price action is choppy in this chart. Typically, traders avoid this kind of price movement. However, if we want to take trading as a full-time business, we are to widen our eyes. An entry can be found even in this market. Concentrate on the rectangle drawn here. After all these bounces, rejections the price finds its support and resistance within the rectangle.

The chart produces a bearish engulfing candle right at the resistance of the rectangle. This is a sign that something may happen. Let us assume a bearish move may occur. The first candle of the bearish trend looks good. A downside breakout with good momentum is the second thing that the sellers may wait to get.

The next candle comes out as a bearish candle followed by an Inside Bar. Things are getting better for the sellers. A bearish engulfing candle closing below the support would be the signal to go short for the sellers.

Here it is. The breakout candle is a bearish Marubozu candle. We may trigger a short entry right after the candle closes. Let us find out where we will set our Stop Loss.

Many traders may suggest setting the Stop Loss above the resistance of the rectangle and setting the Take Profit with the same distance. This is a good idea. However, we may set our stop-loss just above the resistance of the last consolidation. The reason is the price consolidates before making the breakout at the support. If the price made a breakout without the consolidation, we would have set our Stop Loss differently. By setting Stop Loss above the last consolidation’s resistance, we are to keep an eye with our Take Profit level.

We may set our Take Profit all the way down at the last swing low. The price may have kept going towards the major support. Look at the chart above. What do you think? The price is still very bearish but it produces a bullish reversal. That is too with a gap. The price action traders do not like price gaps. Considering the fact that we have set our Stop Loss as close as it can get, thus it may be the time to close our trade and come out with the profit.

The Bottom Line

Even a choppy market ends up producing an excellent trading signal. Our first choice shall be trending markets to look for entries. However, if we can spot out some entries from the choppy market, it would surely make us be more profitable.

Categories
Forex Basics Forex Daily Topic

Stop Loss: An Art to be Learned Well by Traders

Setting Take Profit and Stop loss in the right areas are essential factors in trading. A trader does not survive in the market by placing Stop Loss and Take Profit at the wrong places. In today’s lesson, we are going to demonstrate an example of an entry with the level of Stop Loss and Take Profit.

This is a daily chart. The price heads towards the North with good bullish momentum. The buyers are to look for long opportunities at the pullback. Let us wait for the price to make a pullback.

The price starts having a downside correction with an Inside Bar. It produces two more candles that are bearish. After that, it forms a Spinning Top right at a flipped support. This is a bullish reversal candle but not a strong one. A breakout at the top of the Spinning Top attracts the minor charts’ buyers to go long on the pair. However, major charts’ traders may want to wait for a stronger daily bullish reversal candle.

The next candle comes out as an Engulfing candle. This reversal candle attracts more traders to look for long opportunities here. Since it has not made an upside breakout, thus, to take an entry, traders shall flip over to the H4 chart.

This is the H4 chart. The price has a rejection at the red marked level on the daily chart. Thus, this is the level where the price may find its resistance on the H4 chart. This shall be the level to count in setting Take Profit. The H4 chart shows that the price starts having a pullback. Things are getting better for the buyers.

Let us draw the resistance. If the price consolidates and makes a breakout at the black marked level, a long entry may be triggered. However, the buyers must wait to get the level of support.

Here it comes. A bullish reversal candle forms at a flipped support followed by a breakout candle. A long entry shall be triggered right after the last candle closes. Stop Loss may be placed right below the support where the price forms the bullish reversal candle. Many traders set their stop loss right below the breakout candle. In my experience, this offers a better risk-reward, but it often brings more losing trades.

Have you noticed that the price came back and then headed towards the North? If we had set our Stop Loss right below the breakout candle, our Stop Loss would have been hit. Rather than making some profit, we would make a loss here.

The Bottom Line

Setting Take Profit is important, but setting Stop Loss is more important. In my opinion, it is an art. It needs a lot of practice to be well acquainted with the art of setting Stop Loss as immaculate as it can get.

Categories
Forex Price-Action Strategies

An Engulfing Candle at a Flipped Resistance

An Engulfing candle is a strong bearish reversal candlestick. This makes traders look for trading opportunities. In today’s lesson, we are going to demonstrate an example of how an Engulfing candle creates an entry. Let us proceed.

This is a daily chart. The price heads towards the downside with good bearish momentum. Traders shall wait for the price to have consolidation or an upside correction followed by a bearish reversal candle or pattern.

The price starts having the correction. It produces a bearish reversal candle after three consecutive bullish candles. The bearish reversal candle is an Inside Bar. This is not a strong bearish reversal candle. However, we still may flip over to the H4 chart (this is a daily chart) and wait for an entry.  The H4 chart does not produce any bearish momentum. Thus, the price goes towards the upside instead. Have a look at the chart below.

This is one strong bullish candle. However, the candle closed within the level, which the price breached earlier. Traders must be patient here to find out what the price does around this level. Does it make an upside breakout or produce a bearish reversal pattern?

It produces a Doji candle right at the flipped resistance followed by an Engulfing candle. This surely attracts traders to keep an eye on the pair to look for short opportunities. The question is, how do we find out entries? When the price is at correction, if we have such a bearish reversal candle at the valuable area, we shall flip over to a minor chart. This is a daily chart. Thus, we shall flip over to the H4 chart. Let us flip over to the H4 chart and find out how that looks.

The H4 chart looks bearish. We are to wait for consolidation and a downside breakout to take a short entry. This is what comes out after a while.

The price produces two bearish candles followed by a bullish one. Any bearish reversal candle breaches the support of the consolidation is the signal to go short here.

This is it. A bearish engulfing candle breaches the support of consolidation. A short entry may be triggered right after the candle closes. Let us find out how the trade looks like in a nutshell.

We may set our Stop Loss above the resistance of consolidation. The Entry-level is very explicit, as it has been explained a bit earlier. We may set our Take Profit at the last lowest low where the price started its correction on the daily chart. Alternatively, we may wait for the price to produce a bullish reversal candle. In this chart, we may come out with our profit right after the last candle (bullish) closes. The choice is yours regarding ‘Take Profit.’ Both have merits and demerits.

The Bottom Line

In the above examples, we have learned what to wait for when to flip over a chart, and on what entry shall be triggered. It does look and sound easy. Trust me. It’s never as easy as it looks when you are to deal with the live market. However, having a lot of practice, and with experience, it surely becomes easier.

Categories
Forex Price-Action Strategies

Trading is the Hardest Way to Make the Easiest Money

Financial traders need to be very alert and patient to deal with the market. These two components are vital for a trader to be successful in trading. In today’s lesson, we are going to demonstrate an example of alertness and patience. Let us get started.

The price heads towards the South. Ideally, a trader shall look for short opportunities in a chart like this. The last candle comes out as a bullish reversal candle. It is time for consolidation and waiting to get a downside breakout to take a short entry.

The price seems to go too far. It consolidates and produces a bearish engulfing candle. We may flip over to the H4 chart to find an entry since this is a daily chart. The support level looks strong since it created a long bullish move. The price may play around the level for a while.

As expected, the price stalls at the level of support. Things are different now. A downside breakout would make the pair bearish. A bullish reversal candle would make the traders look for long opportunities. This is where traders must be alert and never be rigid with their initial thought.

A bullish reversal candle forms right at the level of support. Traders may want to flip over to the H4 chart to look for long opportunities. We are not flipping over to the H4 chart this time since I know what happens afterward. Our trading lesson today is going to emphasizes something else.

The price heads towards the South instead. The H4 chart does not offer any entry after that daily bullish engulfing candle. Now, the price action is choppy. It seems that it is a chart to avoid for a while.

Not really, be alert. The price obeys a down-trending channel. Thus, any rejection at the upper band may create short opportunities. The price heads towards the resistance. Let us wait for a bearish reversal candle at the upper band (resistance of the channel).

The price makes a breakout at the upper band instead. It consolidates and produces a Spinning Top. Again, we are to change our trading direction. This time we are to go long.

The last candle breaches the horizontal resistance after consolidation. A long entry may be triggered right after the candle closes. Let us proceed to find out what happens next.

Two consecutive bullish candles form right after the breakout candle. Formation of a bearish reversal candle signals that it may be time to come out with a profit. At last, we make some green pips by going long.

The Bottom Line

This is an example of why we must not be rigid with our direction and how important it is to be alert with price patterns. Trading is never easy. As they say, “Trading is the hardest way to make the easiest money”. If we work hard in learning, only then we will be able to make money easily.

Categories
Forex Basic Strategies

A Twist in the Tale

The Forex market can be very unpredictable. It is a game of probability. With more experience and knowledge, a trader increases the chance to be right in making a trading decision. Having immaculate risk management is another aspect that keeps a trader safe with his investment. In today’s lesson, we are going to talk about the unpredictability of the market.

Let us start with a daily chart of a Forex pair.

The price makes a bullish move and finds its resistance. After four daily candles, the daily chart produces a bullish engulfing daily candle. This is a powerful bullish reversal candle, which forms right at a flipped support. Have a look at the chart below.

The chart above shows that the bullish engulfing candle forms at the flipped support. This means buyers on this chart are to go long on a chart pattern called ‘ABC’ or ‘123’. This is a lucrative and consistent chart pattern, which price action traders love to trade. Let us find out what happens next.

The price stalls and has a rejection at the same level. The buyers would love to get a breakout here to go long and grab some green pips. However, the chart produces a bearish engulfing candle instead. What do you think a trader should do here?

He shall start looking for short opportunities. This is the daily chart. Thus, he shall flip over to the H4 chart to find out a short opportunity.

This is how the H4 chart looks. A very strong bearish candle followed by a little Inside Bar. The trader (the seller) is to wait for consolidation and a bearish reversal candle to go short.

The price consolidates more. It produces a good-looking bullish candle. Let us find out how the next candle comes out. Do not forget that the sellers are waiting to get a bearish reversal candle breaching the lowest low.

This is it. A bearish engulfing candle closes below the level of support. The sellers have been waiting to get a signal candle like this. A short entry may be triggered right after the last candle closes. Let us find out what happens next.

As expected, the price heads towards the South with good bearish momentum. We see the first H4 bullish reversal candle forming at the daily support as well. This may be time to take out the profit.

The Bottom Line

Do you notice how things change within a candle? Before that bearish engulfing daily candle, the pair looks extremely good for the buyers. An upside breakout would make them go long on the pair and push the price towards the North. However, that does not happen, but the price comes down instead. This is what I call “Twist in the tale.” Forex traders often get these twists.

Categories
Forex Price-Action Strategies

A Breakout and the Confirmation

Support and Resistance, also known as Supply and Demand, have long been used in the financial markets. The most characteristic feature of support/resistance is a level of support becomes resistance, and a level of resistance becomes support. The price after making a breakout comes back to the level and makes a move towards the established trend. The price does not always confirm all the breakout levels, though. Traders do not know which broken level is going to produce a trading signal. In reality, they do not even have to know or guess. They have to make decisions according to the price movement or Price Action. Let us have a demonstration of this.

The price is up trending. Traders shall look for long opportunities. To be honest, the last candle on the chart is a buy signal. It was a week ending candle, which must have held the buyers back. Let us wait for a while to get more clues.

The last candle came out as a bearish engulfing candle. Such price action usually makes a pair choppy. The buyers may want to wait for an upside breakout to go long. However, a bearish engulfing candle may not let that happen.

A strong bullish candle closes within the resistance. It seems that the chart may produce a Double Top. Thus, the bear may come and dominate. Let us draw the Neck Line and resistance of the Double Top.

The equation is very simple here. A breakout at the neckline attracts the sellers, which is more likely. On the other hand, an upside breakout attracts buyers. Let us find out which way the price heads to.

The price makes a breakout at the Neckline. However, it does not consolidate around the Neckline after the breakout. Unfortunately, the sellers do not get an opportunity to go short here. It often happens with the traders. Traders’ life is never easy!

Here is a question. Do you see anything interesting? Has the price made another breakout?

It has made a breakout at the red-marked level. It goes back to the level to confirm the breakout, as well. Moreover, it has produced a bearish engulfing candle with a long upper shadow. Things look good for the sellers. A breakout at the lowest low would be the signal to go short.

Here comes the breakout. A bearish Marubozu candle breached the lowest low. The sellers may want to trigger a short entry right after the last candle closes. Let us find out how far down it goes before producing any bullish reversal candle.

Here comes the breakout. A bearish Marubozu candle breached the lowest low. The sellers may want to trigger a short entry right after the last candle closes. Let us find out how far down it goes before producing any bullish reversal candle.

The price heads toward the downside with good bearish momentum. It produces a Doji Candle. It may be time to come out with a profit.

The Bottom Line

The price does not confirm all the breakouts. That does not mean we should start pulling our hair. Concentrate hard and calculate well. The next opportunity is just around the corner.

Categories
Forex Basics

Do not be Biased with Your Anticipation

Financial markets keep going up and down. Traders make money out of those moves. To take an entry, a trader is to do a lot of calculations, such as detecting a trend, waiting for the price to go to the right zone, market psychology, and signal candle, etc.

In trading, we often find ourselves in a situation in which we were waiting for a long entry from a support zone, all of a sudden the price makes a breakout at the support and heads towards the South instead. We feel deprived. However, this should not be like this. In trading, we are to get ready to sell and to buy since the market can go anywhere. We are to stick with the rules to take an entry.

Let us demonstrate an example.

The price heads towards the North with good buying pressure. It seems that the price finds its resistance as well. The buyers are to wait for a bullish reversal candle and a breakout at the resistance to go long again on the pair.

The price keeps being bearish. It seems that the price is going to have a long correction instead of consolidation. The price is at a flipped support. This is where a battle is going to take place between the bull and the bear. Traders are to wait for a downside breakout to sell the pair. On the other hand, a bullish reversal candle is going to attract them to keep an eye for an upside breakout and buy the pair.

The bull wins here. An engulfing bullish candle right at the flipped support means traders shall wait for an upside breakout to buy the pair. The momentum looks good. If the breakout takes place within the next candle, it will be an excellent buy signal. If it takes two candles to make the breakout, that will be a good buy signal as well. Let us proceed to find out what happens next.

The bull has lost the momentum. Traders are to wait for an upside breakout to go long. A good-looking bullish engulfing candle at the support area shall attract the buyers on the minor time frames to push the price towards the upside. That would eventually help the price make an upside breakout on this chart. Let us wait and find what happens next.

What do you see here? A bearish engulfing candle is right at the resistance level. This is a Double Top resistance level as well. If you have been waiting to go long, please change your mind. Get ready to look for short opportunities. This is how the market changes its complexion. You know what you have to do to deal with it. Yes, you must not be biased with your anticipation/calculation — Trade what you see, not what you think.


Categories
Forex Price-Action Strategies

Using Multiple Time Frames to Get Multiple Entries

We know using multiple time frames is an essential aspect of trading. Traders use the bigger time frame to find out the trend, breakout, vital support/resistance levels, and relatively smaller time frames to trigger an entry. In this lesson, we are going to learn how the trigger chart can be used as the analyzing chart to find out more entries.

This is a Daily chart, which is being used as the trigger chart. The weekly chart is used as the analyzing chart. It is a combination of Weekly-Daily. The price heads towards the North. Traders are to wait for the price to produce a bullish reversal candle.

A Spinning Top daily candle at a flipped support, the buyers have a lot to be optimistic here. One of the daily candles is to breach the daily resistance to go long on the pair. Let us draw the support and resistance on the chart to get a clearer picture.

This is how the chart looks like with support and resistance levels. If one of the daily candles breaches the resistance with good buying momentum, the daily traders are to trigger a long entry.

The next daily candle breaches the resistance. The buyer may take a long entry right after the breakout candle closes. An entry on the daily chart means that the trader shall leave the trade/chart for three to four trading days by setting Stop Loss and Take Profit.

However, if a trader uses the same daily chart as the trend-detecting chart and flips over to the H4 chart to find another entry, it surely would be more rewarding.

Let us flip over to the H4 chart.

Previously, the daily chart shows an upside breakout. Thus, the trend is bullish. The H4 chart shows that the price starts having consolidation. If the breakout level holds the H4 candles and makes an upside breakout, the H4 buyers are going to go long on the pair as well.

This is the H4 chart with the support and resistance of consolidation. The buyers must wait for an upside H4 breakout to go long on the pair. Let us proceed to the next chart.

Here it comes. An H4 bullish engulfing candle breaches the resistance. The H4 traders may want to trigger a long entry right after the candle closes.

The H4 chart shows the price may have consolidation again. The H4 buyers may want to cash in their profit. However, the entry, which is taken on the daily chart, traders are still to hold their positions until they get a bearish daily reversal candle.

At the end of the day, price action trading works very similarly on the Weekly, Daily, H4, and H1 chart. Today’s examples show that a Weekly-Daily combination offers an entry. After the daily breakout, the Daily-H4 combination offers an entry, as well. With a lot of practice, dedication, and hard work, a trader can trade both of them. This will surely beget more profit.

Categories
Forex Basics

What leads a Breakout to be Nullified?

Price action traders consider the breakout as one of the most important factors. It is, once it is confirmed. However, momentum, overall psychology are essential aspects of breakout that less experienced traders often misapprehend. In this lesson, we are going to demonstrate an example of a breakout with less momentum. Let us get started.

The chart shows that the price is up trending with good buying pressure. The price makes a breakout at the last swing. This is an ideal chart for the buyers to look for buying opportunities. They are to buy the pair on the pullback. Let us proceed to the next scene.

The price starts having a correction and comes back up to the breakout level (the last swing high). It produces an engulfing candle, which is a strong sign that it may keep going towards the upside, makes a breakout, and offers a long entry.

The price does not find a strong buying momentum. It goes towards the upside and comes back again to the support. It seems the buyers may have to wait longer than they thought.

Things look a bit different now. Rather than making an upside breakout, it has a strong rejection at the resistance. The support is being tested again.

No downside breakout, but the support holds the price. The price gets caught within two horizontal levels. To be precise, the price gets caught within a rectangle. Ideally, both the sellers and the buyers love to keep this chart in their watch list; get a breakout at either side to take an entry.

Two consecutive bullish candles right at the support suggest that the buyers have the upper hand. The buying momentum looks good here. If it continues going towards the upside and makes a breakout, the buyers may dominate here. Let us see what happens next.

Oh no, the price heads towards the North with less buying pressure. The bullish move has much less speed than the last bearish move. This sort of price action usually makes the price have another bearish move and head towards the support. Let us find out what happens next.

An upside breakout this is! After the breakout, if the price consolidates and makes another bullish move from the breakout level, it would be a buying market again. However, the question is whether it makes the buyers interested in buying or not.

  1. The last bullish wave does not have the drive.
  2. The resistance level is strong

Let us find out what happens next.

It does not produce a bullish reversal after the breakout. Instead, it comes back in. The breakout is not valid anymore. What may have been a strong buying market has become a choppy market again.

The Bottom Line

The breakout may have offered us entry if it produces a bullish reversal candle at the breakout level. That does not happen. We cannot precisely tell why that happens here. However, the less momentum to begin the potential trend is one of the reasons among many. It represents that psychologically, the buyers are not confident about the breakout and continuation, which makes that a nullified breakout in the end.

Categories
Forex Price-Action Strategies

Using Multiple Time Frames in Trading

Price action traders combine multiple time frames to trade. In most cases, they use a time frame to determine the trend and use the next one to trigger an entry. The most important factor in using multiple time frames is the combination. Usually, the combinations are Daily Chart with H4 Chart, H4 Chart with H1 Chart, H1 Chart with 15M Chart, and 15M Chart with 5M Chart. In today’s lesson, we are going to demonstrate an example of the combination of Daily and H4 Chart produces an entry.

This is a daily chart. In an uptrend, the price had a pullback. It produces a Doji candle followed by an engulfing candle (arrowed). The buyers may want to draw a support level here. Please note, it is not a Morning Star.

It is neither a Moring Star nor a Double Bottom. The price heads towards the North with good buying momentum. Many of us may think we miss an opportunity. The pair may have offered entries on minor time frames, but the daily chart does not provide anything yet.

Here we are. The price heads towards the support again. As far as the Daily chart is concerned, the price had a bounce at the level earlier. Thus, if the level produces a daily bullish reversal candle, the buyers are going to get themselves busy to look for long opportunities. Let us proceed to find out what happens next.

The last bearish candle closes within the marked level. This is a sign that the price may obey the support. However, we never know unless it produces a bullish daily reversal candle.

Here we are. The level produces an Inside Bar. It is not a robust bullish reversal candle. Nevertheless, it is a reversal candle. Do you know what the price action traders do next? They flip over to the H4 chart. Have a look at the H4 chart.

Since we are analyzing the daily chart, the trigger chart shall be the H4 chart. The H4 chart shows that the price is on consolidation. The buyers need to wait for bullish momentum.

The chart produces an H4 bullish reversal candle, although the resistance is still intact. Thus, the buyers need a breakout at that level. They must wait for it.

Here it comes. A Marubozu bullish candle breaches the resistance. The buyers may trigger a long entry right after the candle closes. Let us proceed to find out what the price does next.

As expected, the price heads toward the North with good buying momentum. There is enough space for the price to travel. It may go further North as well. Anyway, let us concentrate on what we have learned from these examples.

  1. Using multiple time frames is one of the key components of price action trading.
  2. The right combination of multiple time frames is essential.

We are going to learn more about using multiple time frames in our forthcoming lessons. Stay tuned.


Categories
Forex Price-Action Strategies

What Is Rectangle and How to Trade on It

The price after making a strong bullish or bearish move, it makes correction/ consolidation. The price consolidates within two horizontal lines. In the financial market, this is called Rectangle. In today’s lesson, we are going to demonstrate some examples of the bullish and bearish rectangle.

Let us start with a bullish rectangle.

The price heads towards the upside with good bullish momentum. At the top, the price seems to start having consolidation. A buyer may want to keep an eye for an upside breakout to go long from here. However, the price continues to consolidate.

The price consolidates within two horizontal lines. We can draw a rectangle here since the price produces the rectangle after a bullish move, so it is called ‘Bullish Rectangle.’ Traders are to wait for a breakout to take an entry. A downside breakout offers a short entry, and an upside breakout offers a long entry. Let us find out which way the next breakout takes place and the price heads to.

The price makes a downside breakout and heads towards the South. At rectangle breakout, the price usually travels at least the same distance of the consolidation length. It seems the price travels 1.5X distance of the consolidation length here. Let us concentrate on the next chart below.

The price consolidates getting trapped within horizontal support and resistance. Do you find anything interesting here? Yes, we find another rectangle. This time it is a bearish rectangle. Let us draw those two lines here.

Again, traders must wait for a breakout to find out its next direction. The price has several bounces and rejections within those two horizontal lines. It is a bearish rectangle, but we know a breakout can take place either way. There is no point in guessing. Let us wait and find out.

The price makes a downside breakout and heads toward the South with good enough selling momentum.

We have demonstrated two examples here. The first one is a bullish rectangle where the price makes a downside breakout. The second one is a bearish rectangle, on which the price makes a downside breakout as well. Breakout direction does not depend on the bullish or bearish rectangle. Trader’s job is to wait for the breakout and breakout confirmation. Entry is to be taken only when the breakout is confirmed. We can spot rectangles almost in all the time frames. However, it is often seen on the H1, H4, and Daily charts. Have some practice on the demo account or do some backtesting to get well acquainted with the pattern to make green pips.

Categories
Forex Price Action

Price Action, Market Psychology, and Adjustment

Price action traders are to get clues from what the price has been doing. Horizontal Support/ Resistance, Trend Line Support/Resistance, Fibonacci Levels, Equidistant Channel along with Candlestick Pattern are price action trader’s main weapons. A trader must know how to use these tools as far as price action trading is concerned. Moreover, traders often need to adjust to marking levels, which are to be integrated with price action and market psychology. In today’s lesson, we are going to show an example of that.

The price has been heading towards the downside with strong bearish momentum. Ideally, traders are to look for short opportunities at upside pullback. See the first reversal candle. The candle closes within the support of the last bearish candle. Thus, the traders must wait to go short since the support holds the price. Let us see what happens next.

At the last candle, the price goes towards the downside but comes back within the support again. Equations are different now. Long lower shadow and proven support suggest that the traders may have to wait longer than they thought.

As expected, the price consolidates on choppy price action, which makes traders wait. Traders find horizontal support. Let us draw it.

The price obeys the support level several times. However, do not forget that the price had a strong rejection. This is where traders may need to make an adjustment.


The price has been heading towards the adjusted support. Risk-Reward does not look right here. It is better to wait for either a downside breakout or a bullish reversal to go long. Let us see what happens next.


We have a bullish reversal here. A bullish engulfing candle right at the support level suggests that the traders may have to look for long opportunities here. The question is, shall we take an entry right after the last candle closes or not. The answer is ‘No”. We have to wait for an upside breakout. Can you guess where the breakout level is? Think for a minute, and then proceed to the chart below.

The price has been obeying a down-trending Trend line producing a Descending Triangle. Thus, the breakout at the Trend line resistance is a signal to go long here. All the buyers need here a breakout by a bullish Marubozu candle.

Here comes the breakout that the price action traders shall wait for. The buyers may trigger a long entry right after the breakout candle closes. Stop Loss is to be set below the horizontal support. Let us find out how it proceeds.

The price heads towards the North and provides 1:1 Risk-Reward. So far here, it seems that it is having consolidation. Some traders may want to come out with their profit. Some may shift their Stop Loss at the breakeven and take some profit out targeting to go all the way towards the swing high. This depends on how a trader wants to manage his trade. With these above charts and examples, we have realized the importance of adjustment in marking support/resistance.


Categories
Forex Price-Action Strategies

When A Breakout Occurs by More than One Candle

Price action traders’ main job is to watch the price action and find out the message out of it. The message comes from candles, various charts, momentum, as well as the attributes of breakouts. In this lesson, we are going to demonstrate an example of a breakout, which occurs with more than one candle. Let us find out whether a breakout with multiple candles gives us any message or not.

The price finds its support at the marked level and heads towards the North with good buying pressure. Price action traders start eyeing on the pair to go long on the pair. The first thing they would want is consolidation. Let us proceed to the next chart.

It seems that the price may have started having a pullback. The price is to come about 38% of the trend’s length to attract the buyers to watch for an upside breakout. Let us see what happens next.

The last candle seems to have covered a good distance. The buyers are going to be keen to get a bullish reversal candle on the chart now. If a reversal candle makes a breakout itself, it attracts traders more. Eventually, it pushes the price towards the trend’s direction at a good pace. Let us find out what happens here.

Here it comes. The bullish reversal candle is here. It is a ‘Track Rail,’ which is the second strongest reversal candle after the Engulfing candle. Traders are to wait for an important event. You know what that is, right?

‘The Breakout’!

The breakout occurs here by a Marubozu candle. Price action trader shall trigger a long entry right after the candle closes. Before triggering the entry, a trader must know where to set his Stop Loss and Take Profit. Stop Loss level is obvious here, which is below the support of the consolidation zone. Where the Take Profit level is to be set? Ideally, a 1:1 risk-reward ratio is the first target in any entry. However, there seems to be enough space for the price to travel. We may go for 1:2 risk-reward here. Does a trader go for a 1:3 risk-reward ratio or even more here? We get the answer later. Meanwhile, let us continue watching the drama.

The plan seems to be working amazingly well. The price heads towards the North with good buying momentum. 1:1 risk and reward ratio is easily achieved within the next candle. 1:2 risk-reward is achieved as well. Some may start splitting the hair for not setting the target with a 1:3 risk-reward ratio. Let us proceed.

The price has produced an Evening Star. This surely is not a good sign for the buyers. Those who set their Take Profit with a 1:3 risk-reward ratio must be in a pensive mood.

The price does not hit the Stop Loss, but there is no profit left for the buyers that are holding the positions. Targeting a 1:3 risk-reward ratio does not bring more pips. It rather makes them lose some pips that they could have earned.

Price Action breakout attributes suggest that if a breakout occurs with multiple candles, the trend often loses its impetus early. Thus, it is best to target 1:1 (in most cases), 1:2 (if there is enough space) risk-reward ratio when a breakout occurs by more than one candle.

Categories
Forex Videos

Mastering Price Action – The Forex Traders Bible

Mastering Price Action

Price action is a discipline of identifying price action trends (up and down movement) reversals, support, and resistance via technical analysis on a trading chart during a specified period of time. Price action analysis is used in conjunction with global news events and economic data releases, which act together in order to influence exchange rates.

Most technical traders profit by devising a strategy which actually combines both price action, fundamental analysis, and their overall understanding of technical analysis. All these factors work hand-in-hand with each other.
Different tools can be applied to a chart to make trends in price action more obvious for traders. And where technical analysis formations and chart patterns are derived solely from price action.

Example ‘A’

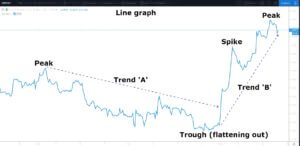
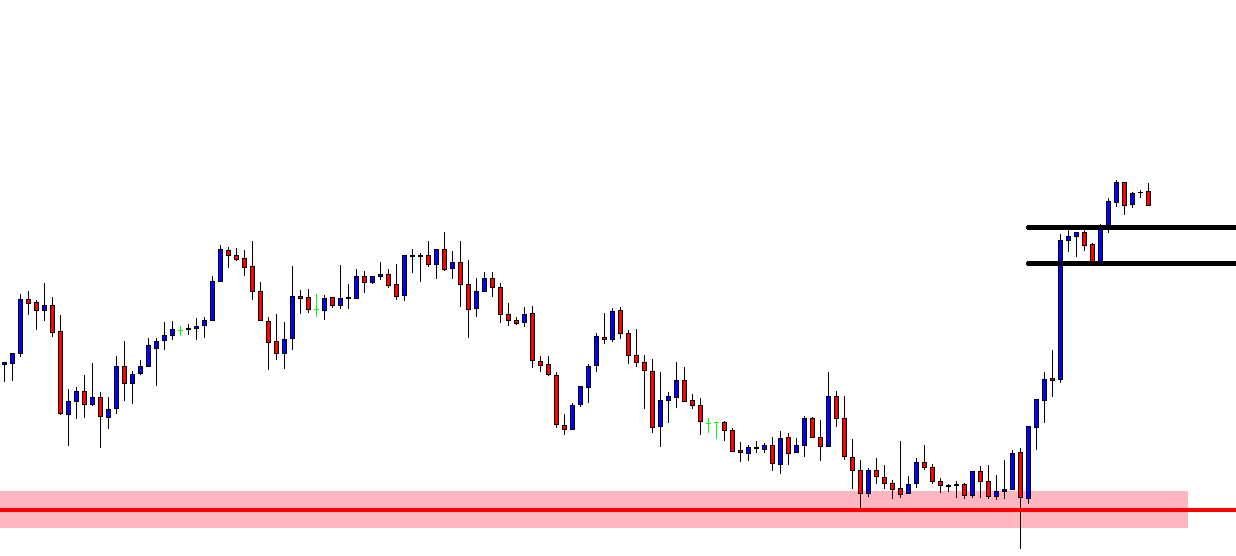
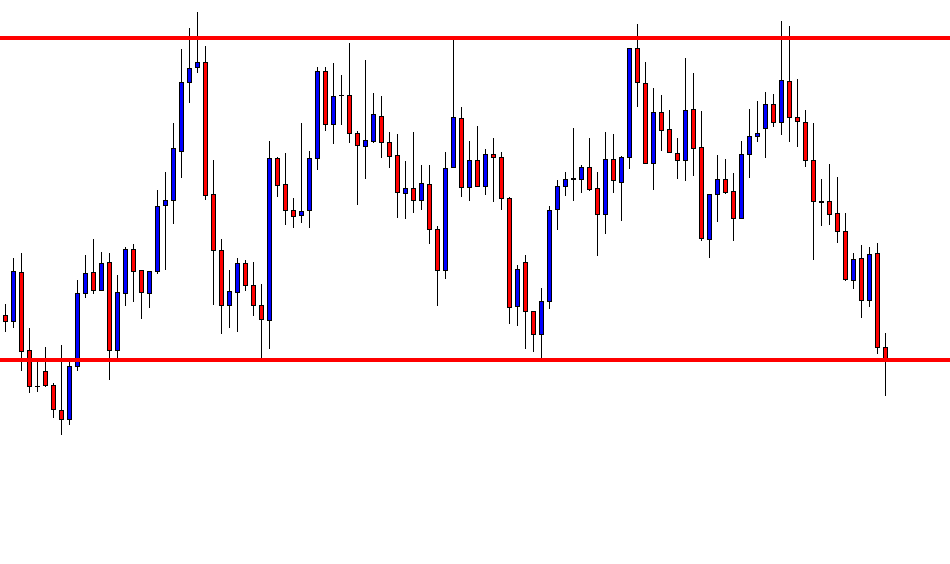
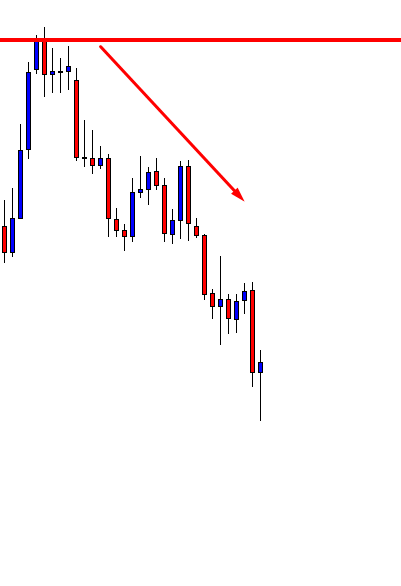
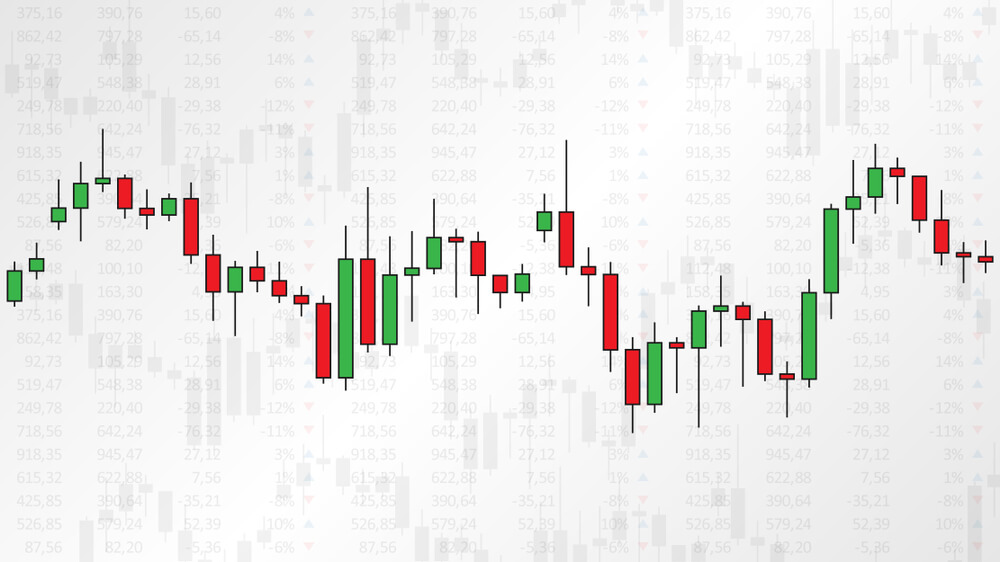
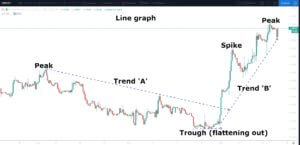
Example ‘A’ is a 2-hour line graph of the British pound against the American dollar, also known as Cable. Let’s disregard the comments on the graph and simply focus on the actual line graph itself, which denotes the up and down movements – or price action – of the exchange rate of this currency pair. If we only used this line graph to trade this particular pair, we would find it extremely difficult to know when to open a trade in any particular direction. It simply looks chaotic and random!
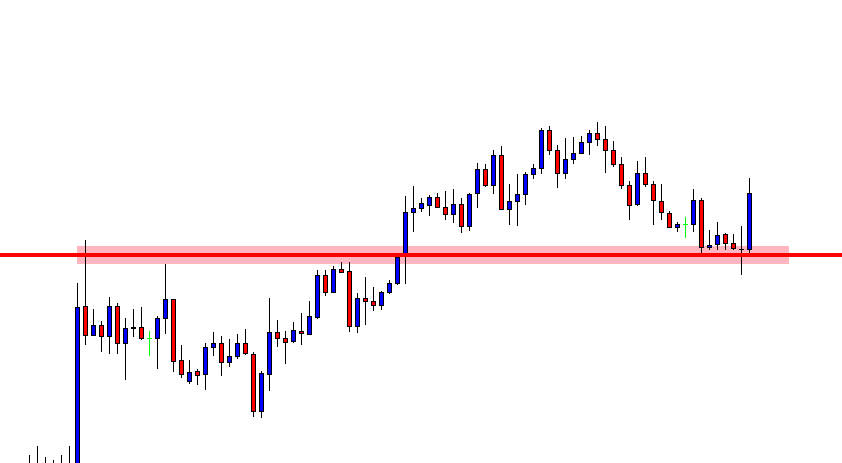
However, looking a little more closely we can see a peak on the left hand side of the chart which occurs at the 1.2567 exchange rate level, before price action descends to the 1.22 level, which is a key level, and where we might expect to find some potential support, (a floor in this example) and where indeed the price flattens out here and which marks the end of trend ‘A’.
Price then moves higher throughout trend B and where we see a couple of spikes, some pullbacks, and then a continuation to the peak of 1.2850; another key level (in this case, a potential ceiling).
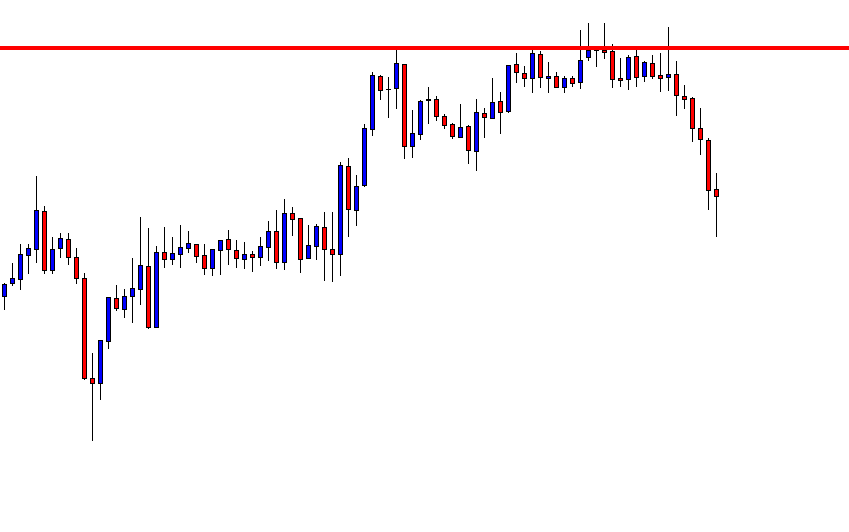
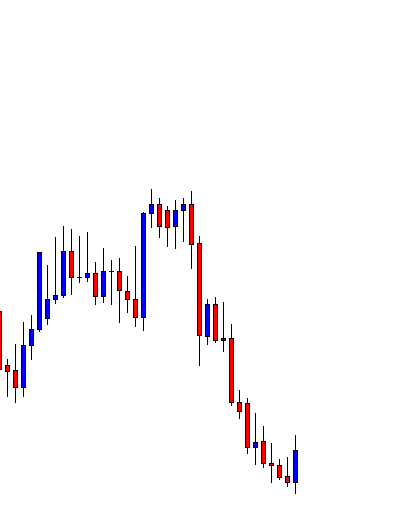
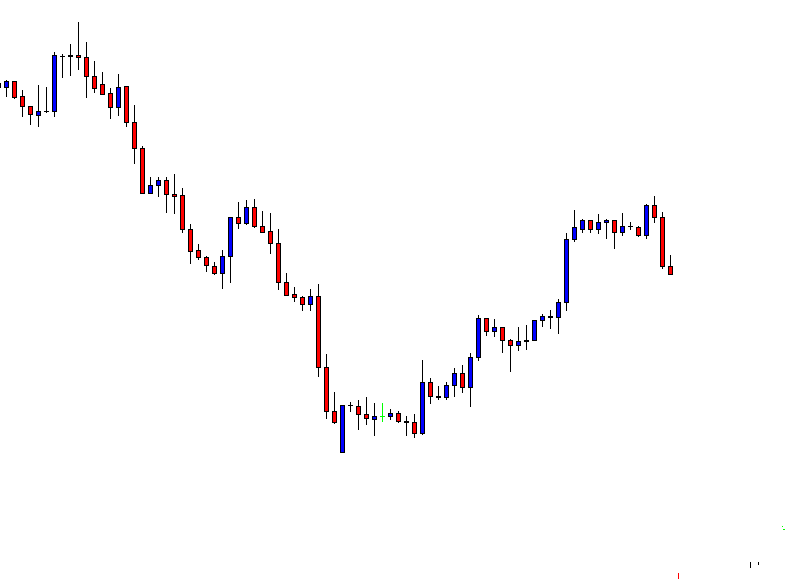
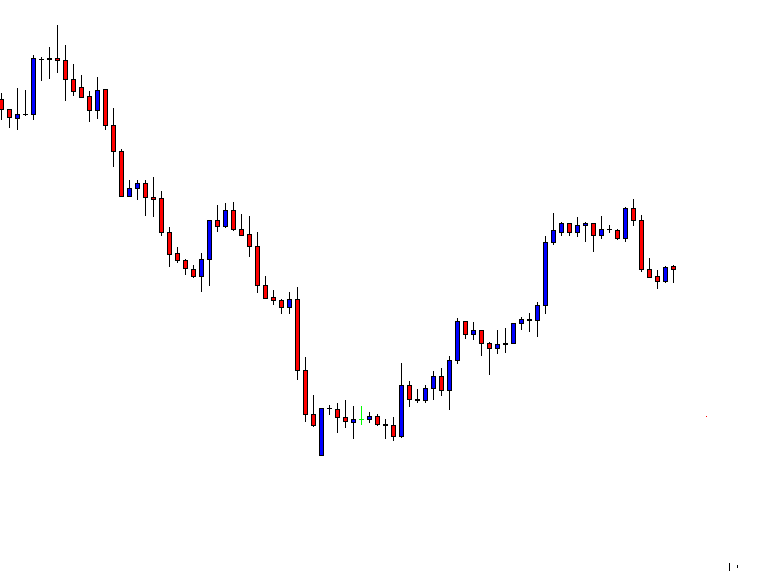
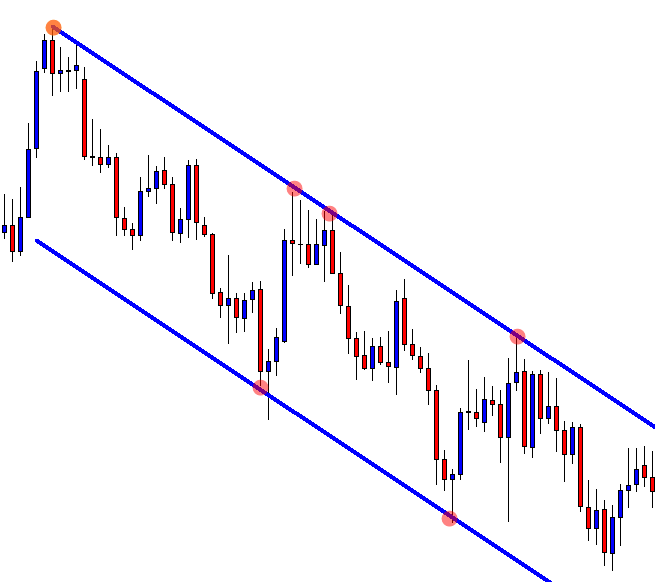
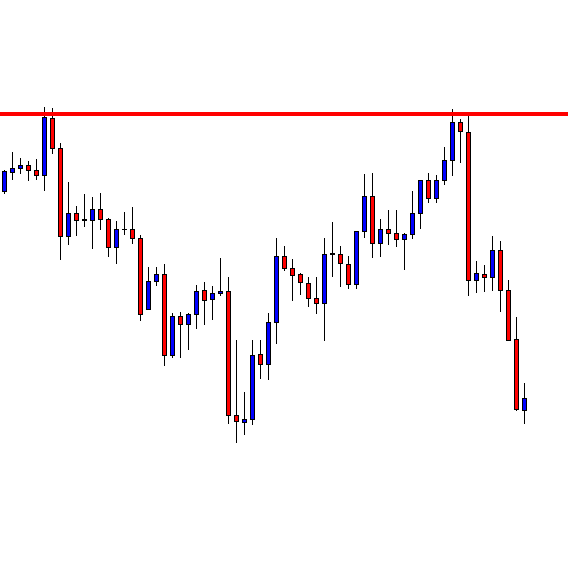
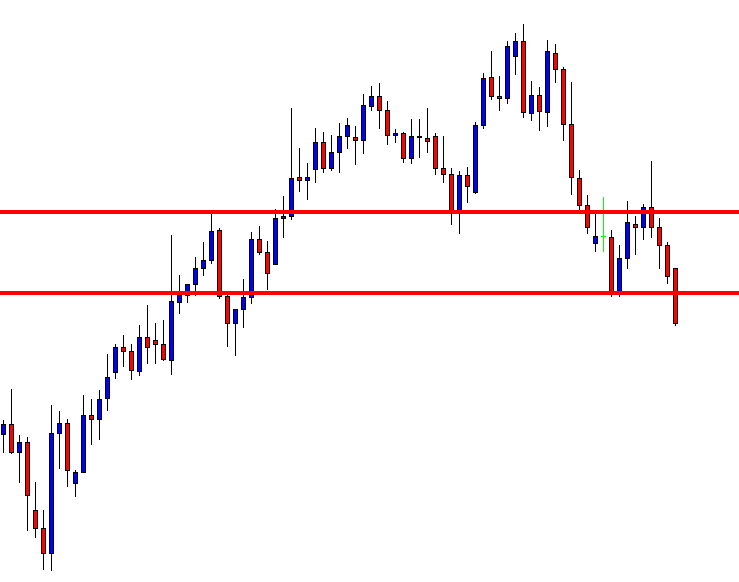
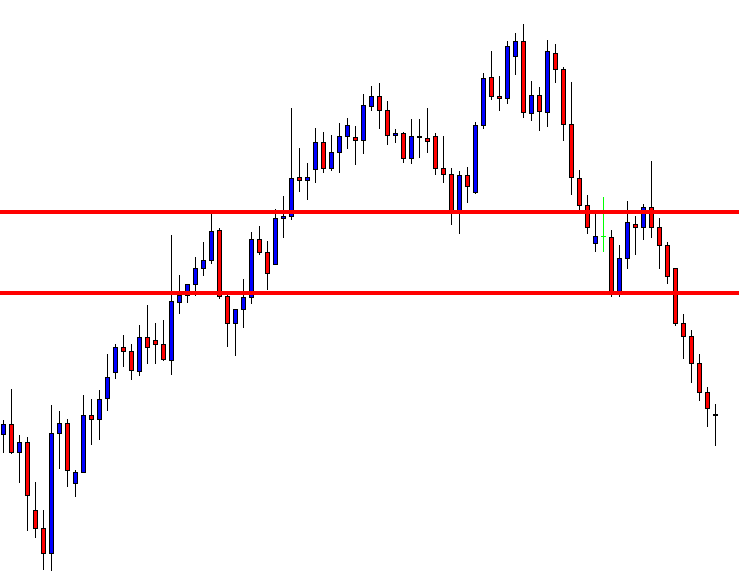
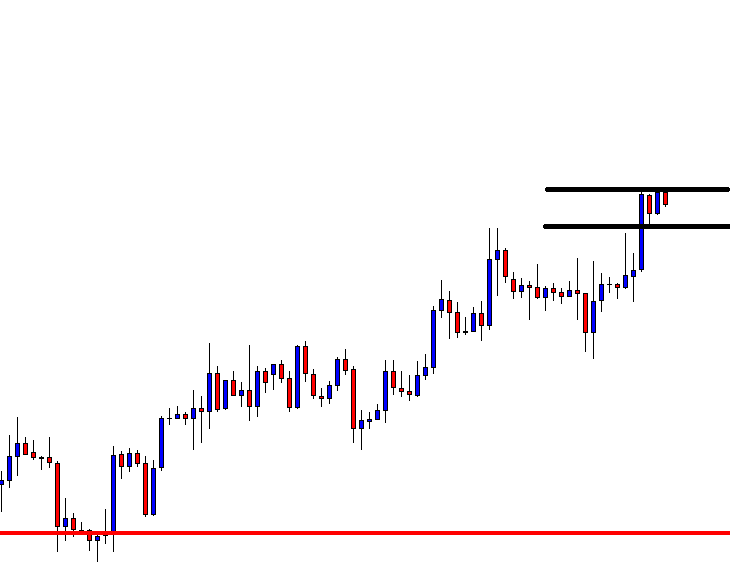
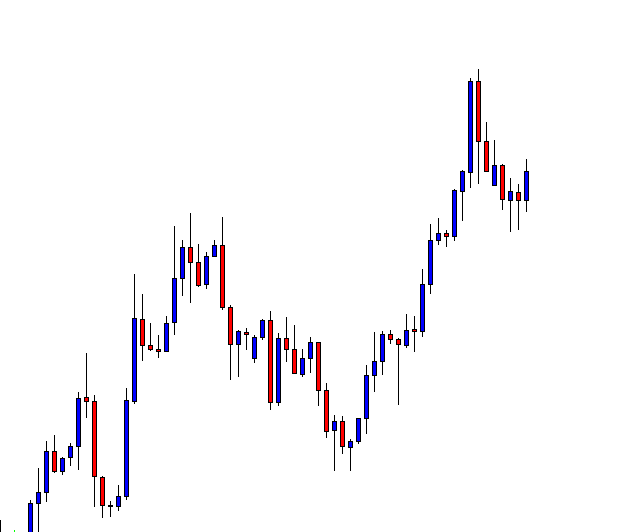
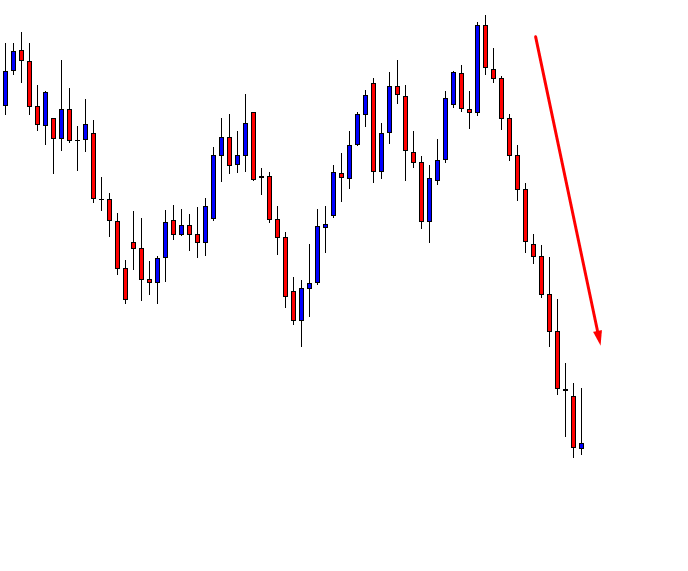
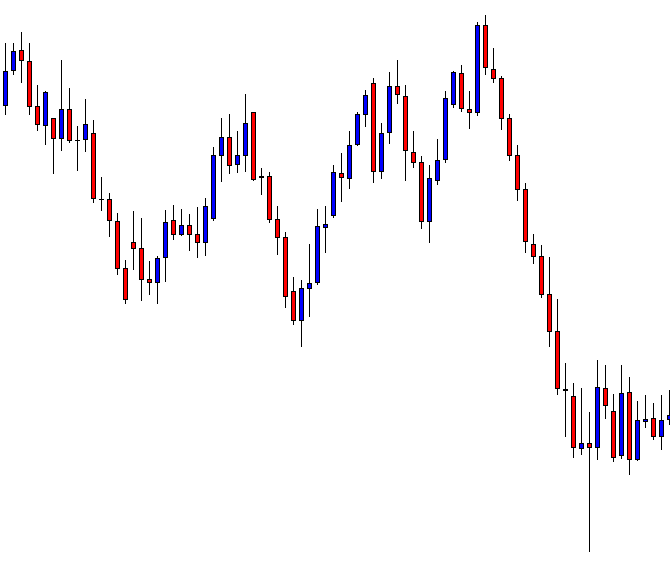
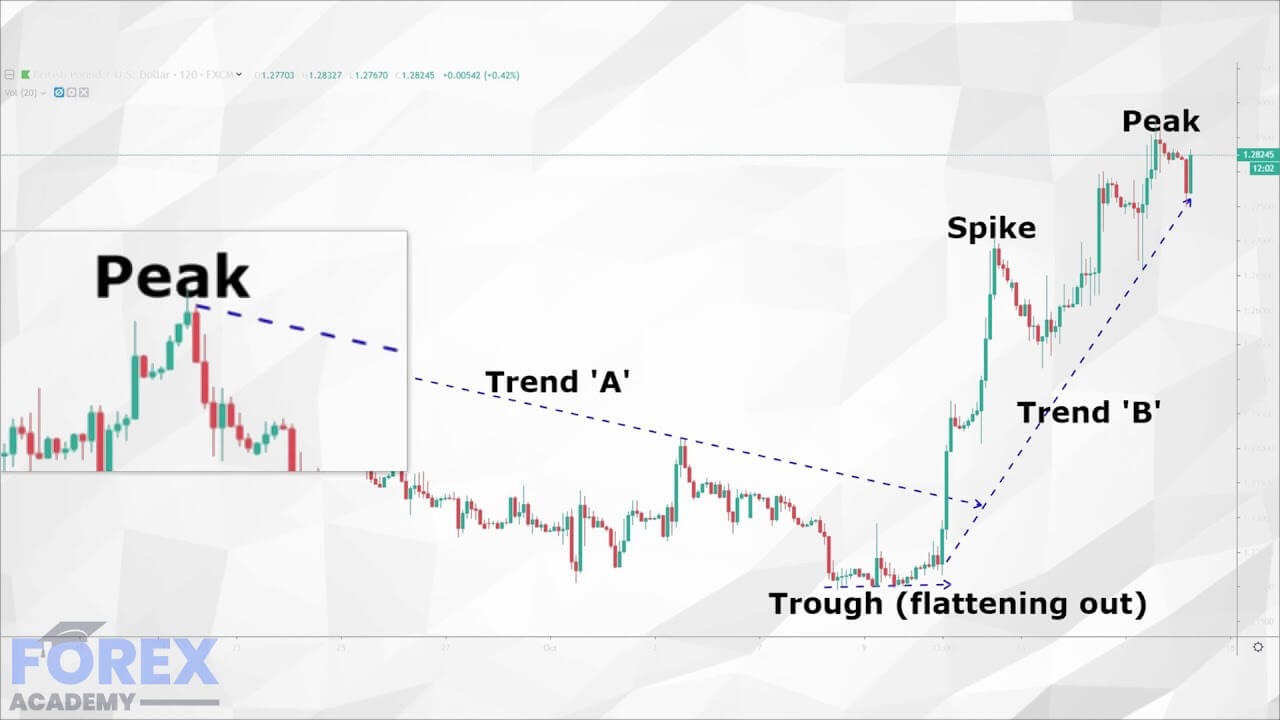
Example B


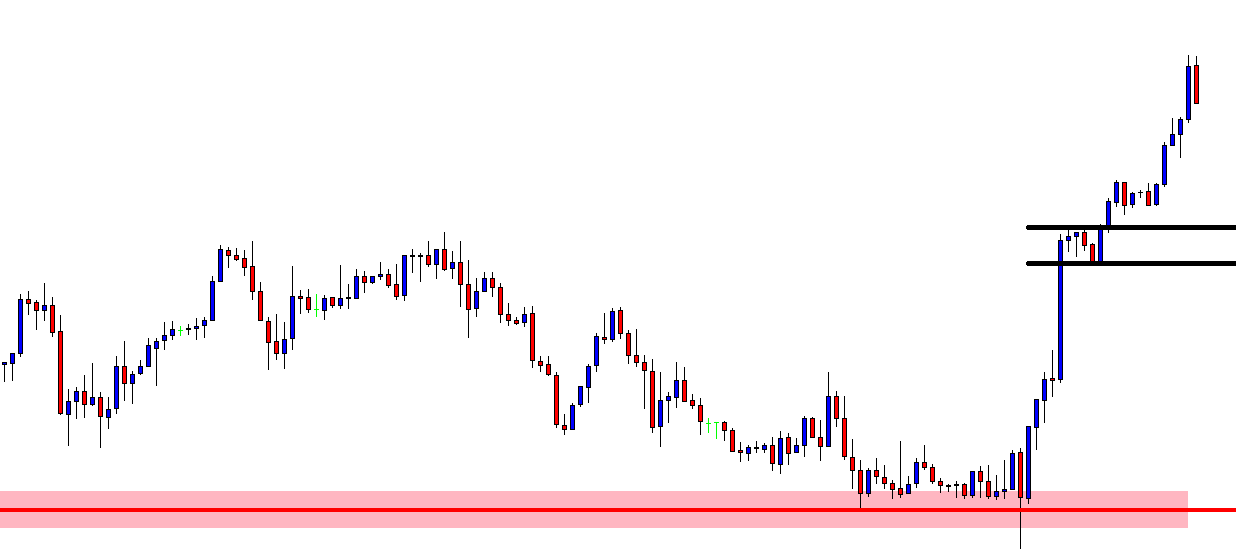
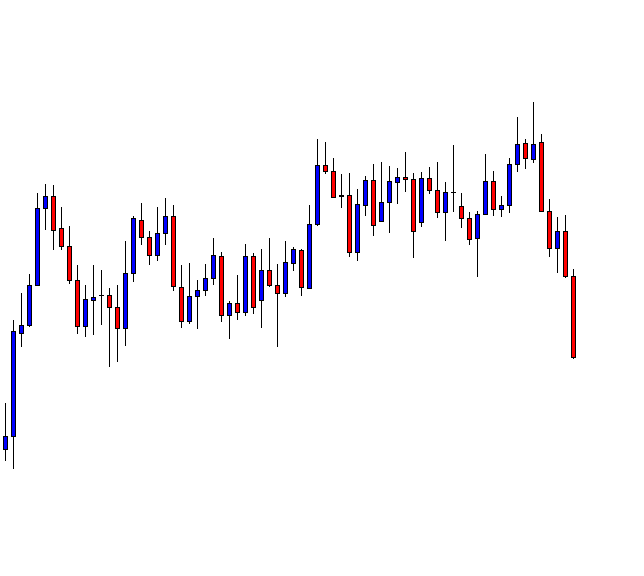
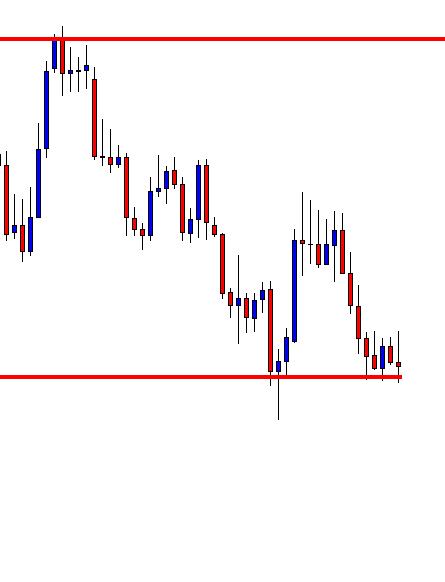
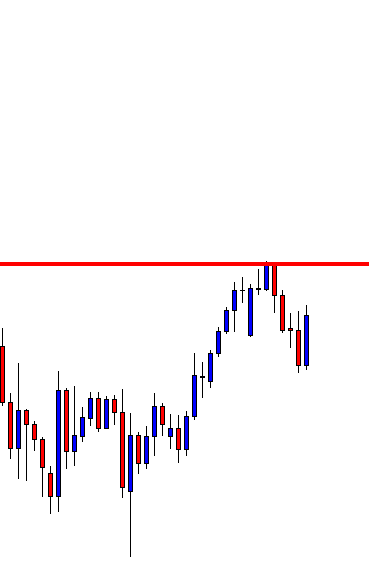
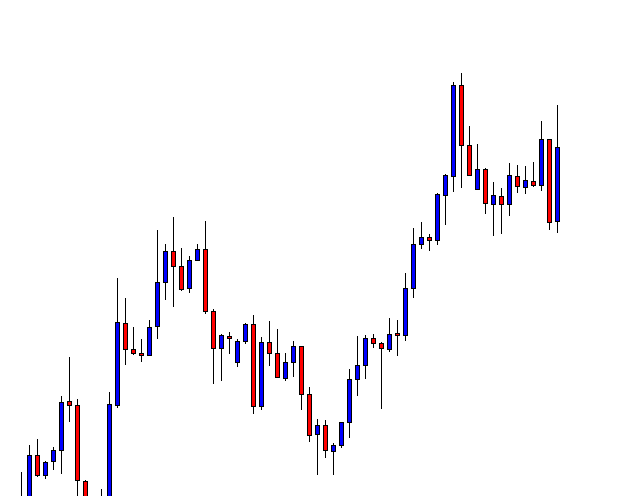
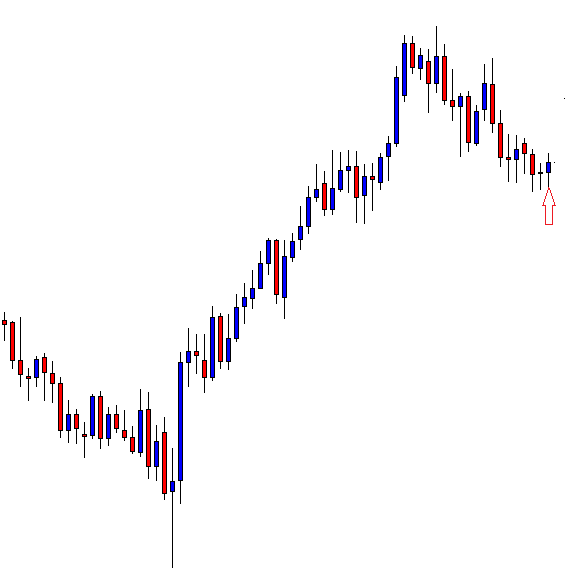
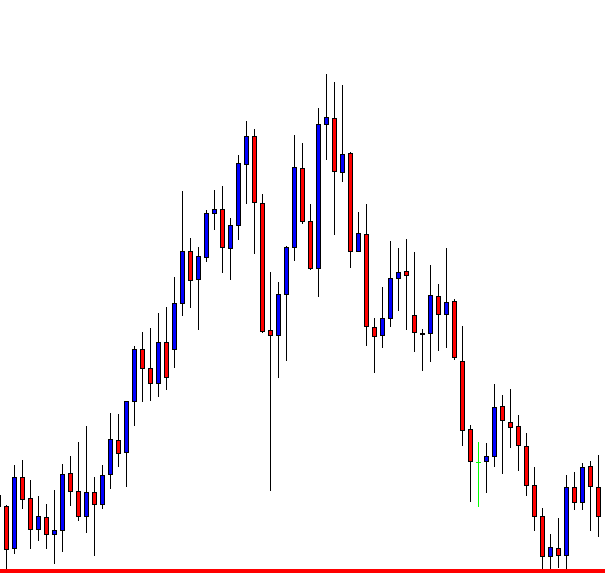
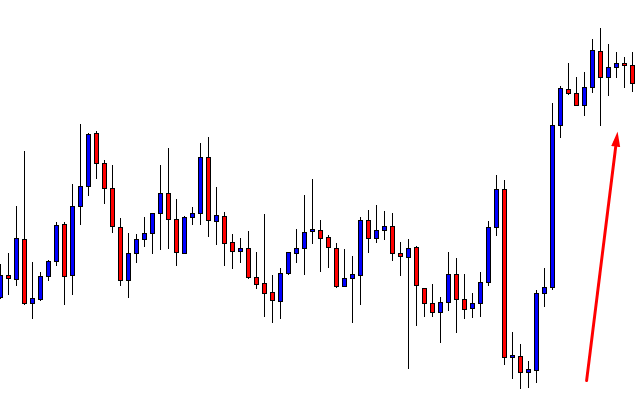
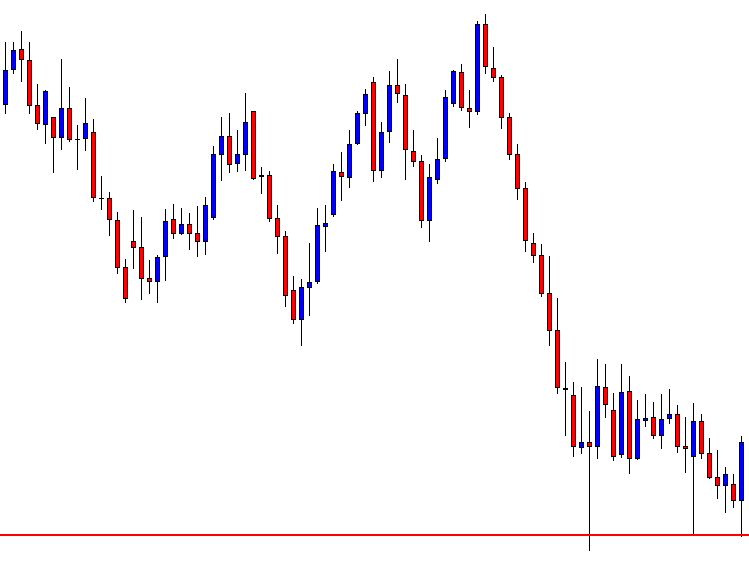
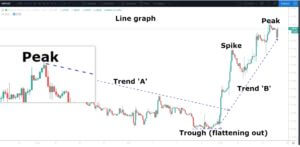
In example B, we have changed the line graph to Japanese candlesticks, a style of technical analysis which is more widely used in the trading community and which is much easier to read in terms of potential fading of price action and therefore possible opportunities to enter the market more easily.
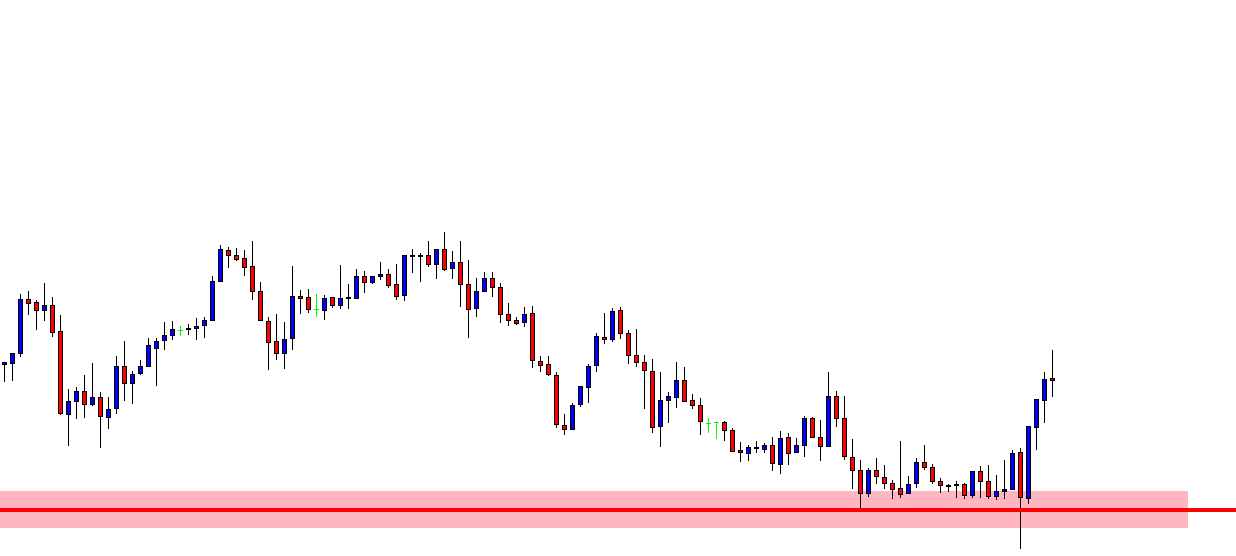
Here we can see for example that our initial peak on the left-hand side of the screen showed a high, as denoted by the green (bullish) candlesticks, which was replaced by a red (bearish) candlestick – which was larger than the preceding two candlesticks – and was a warning to traders of a potential pullback, or a reversal of price action.

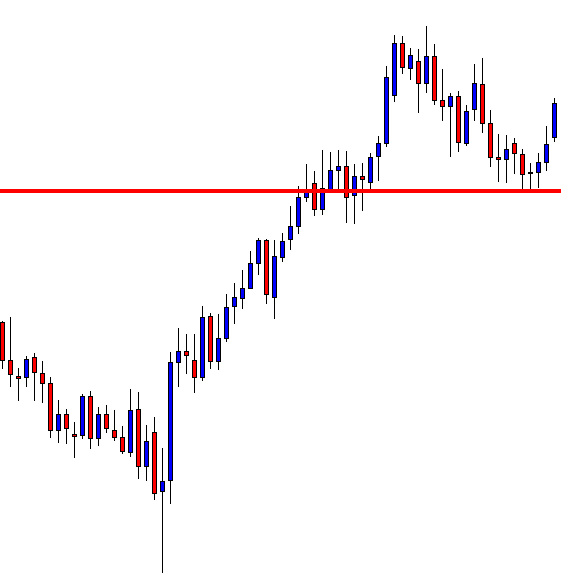
Indeed price begins to fall before almost returning to trendline ‘A’ and then continues the momentum to the downside. Eventually, the price action returns to our trend line before continuing the move lower by way of a series of falls and pullbacks and where trendline ‘A’ has become a simple moving average.
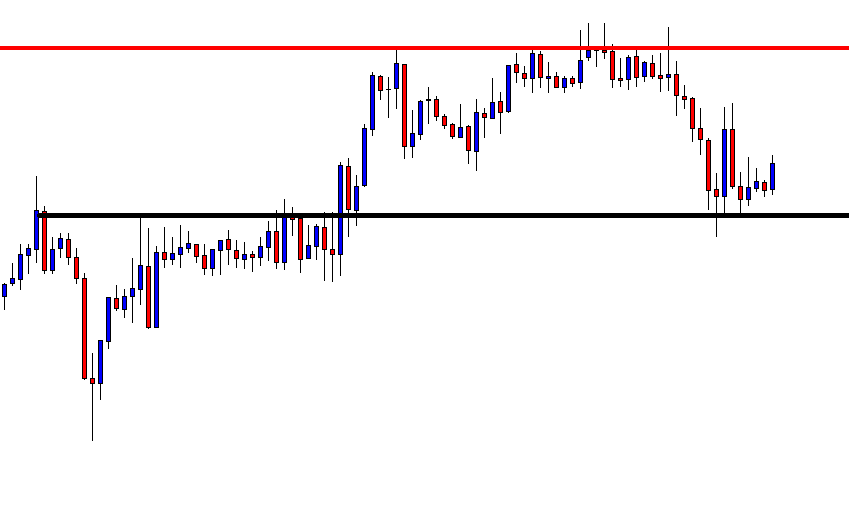
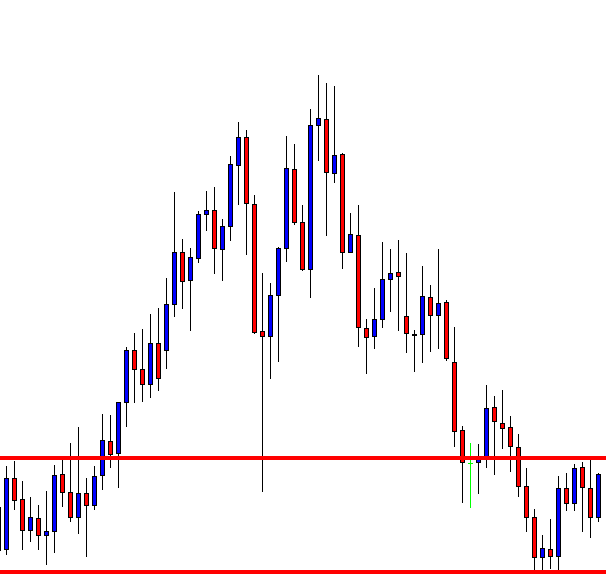
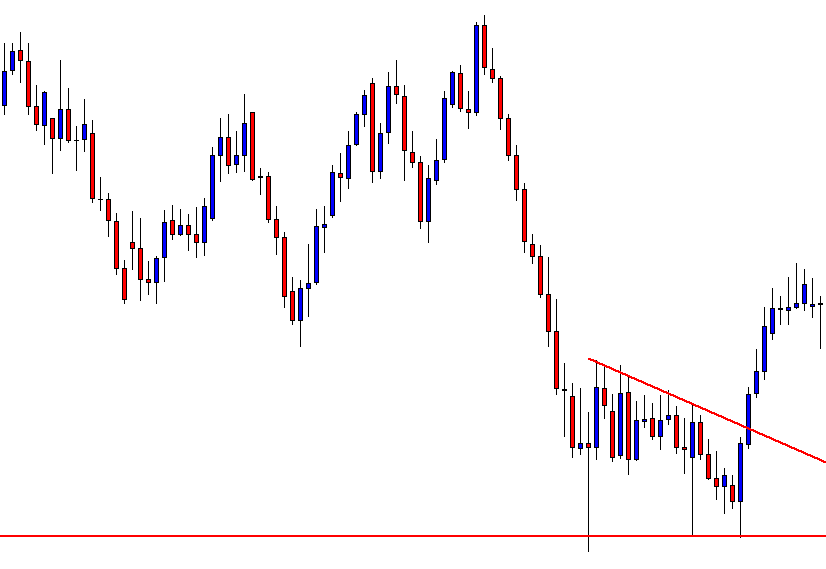
After the price action flattens out at the 1.22 level, we are able to identify a move higher and where the larger candlesticks (a sign of a strong trend) move above the trend line or simple moving average, and this starts a price action reversal. When price crosses the extended trend line ‘A,’ this becomes a signal of a new trend, and indeed trendline ‘B’ becomes a simple moving average to the peak of 1.2850.
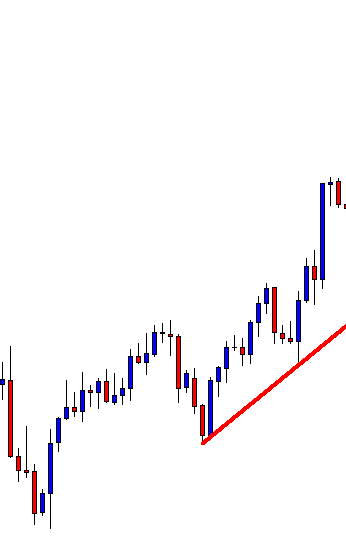
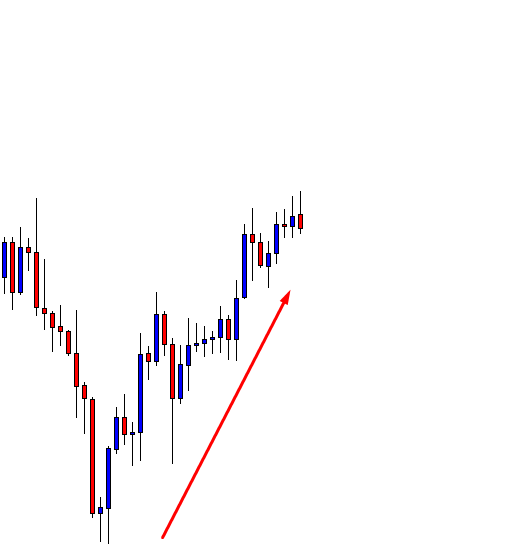
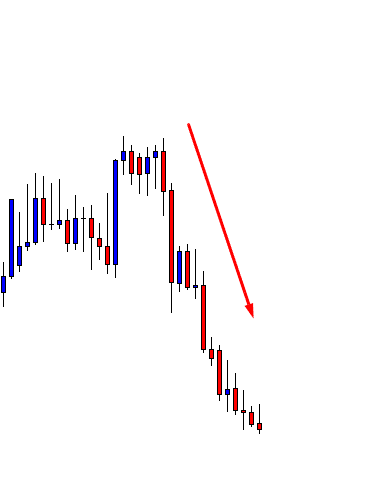
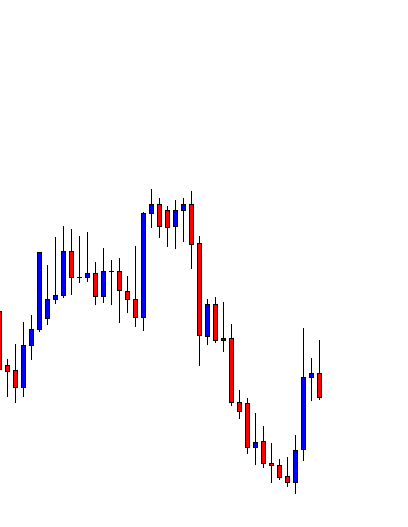
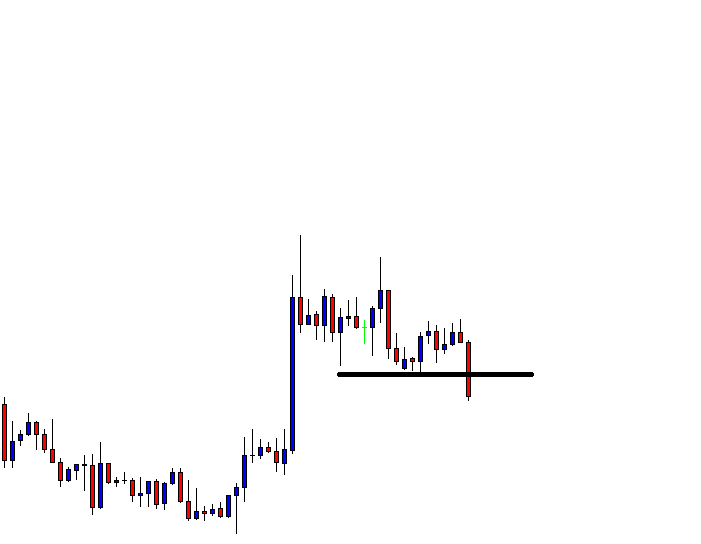
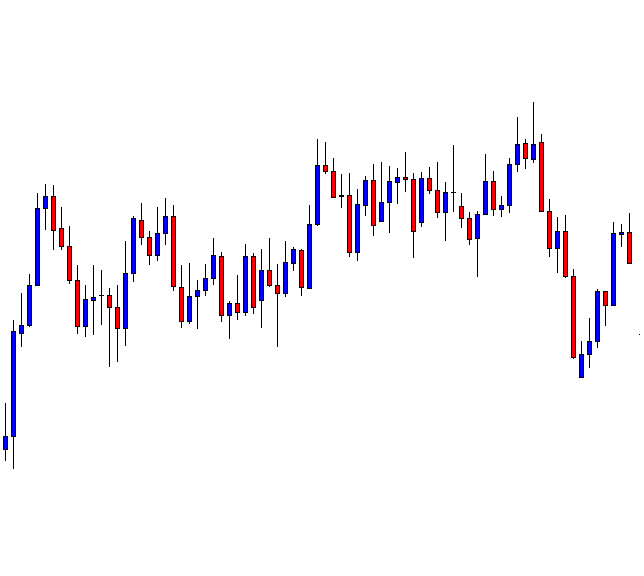
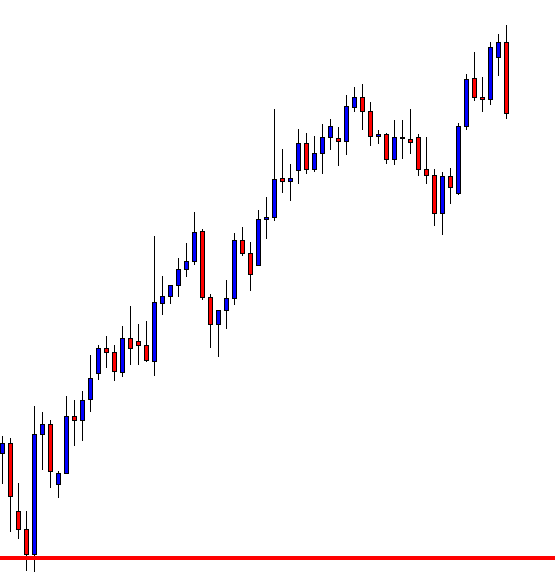
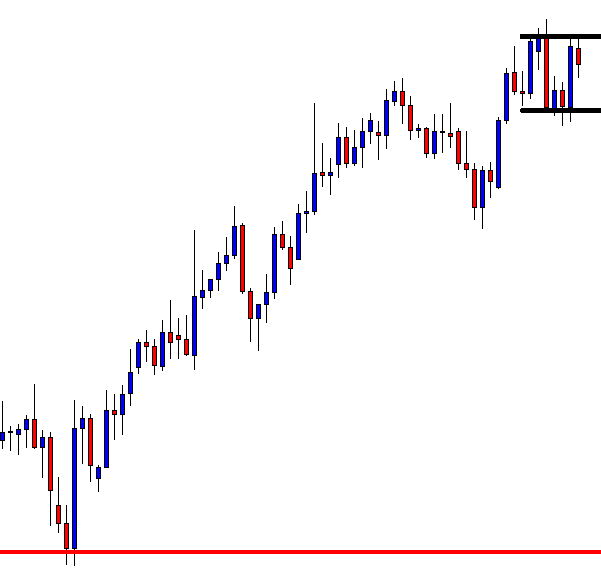
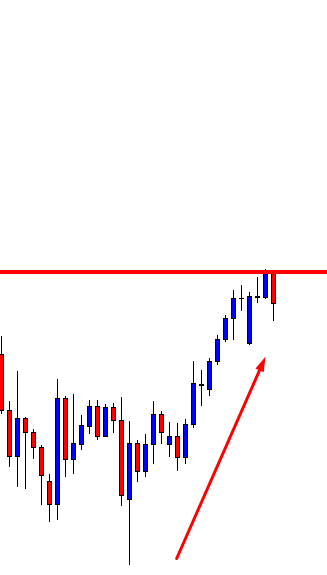
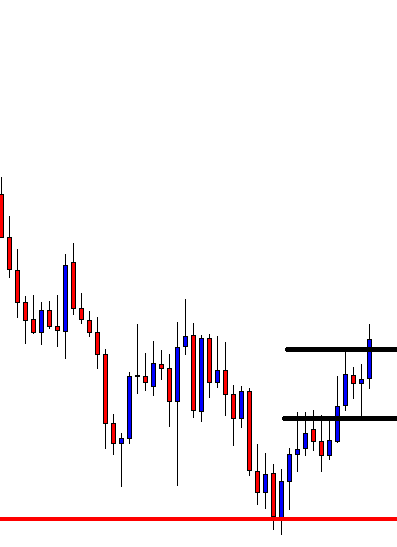
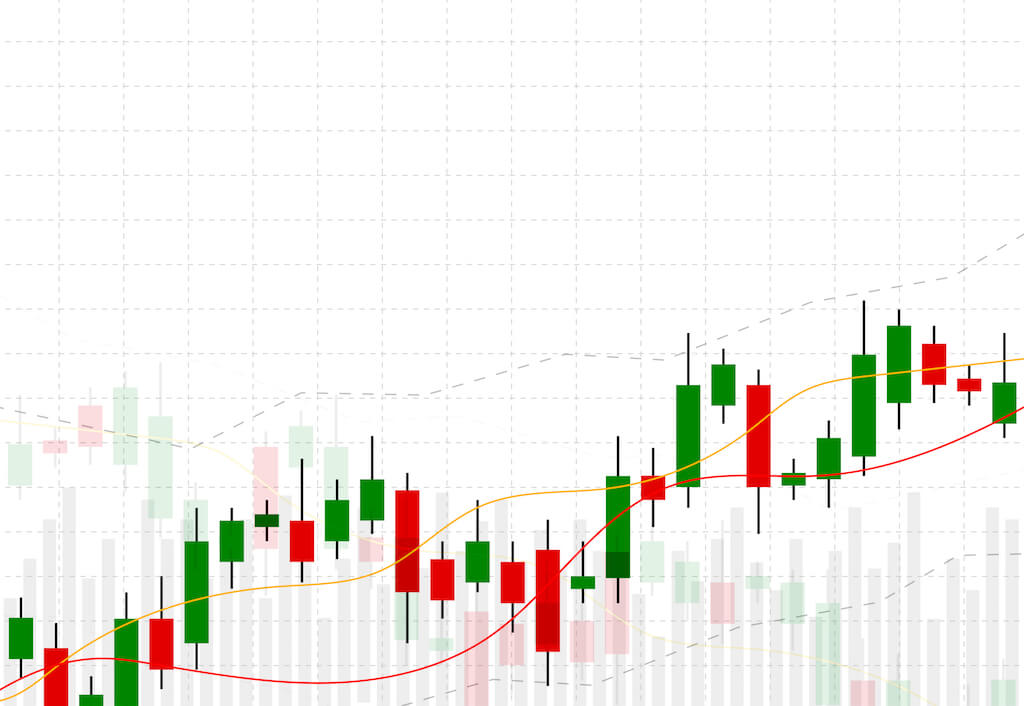
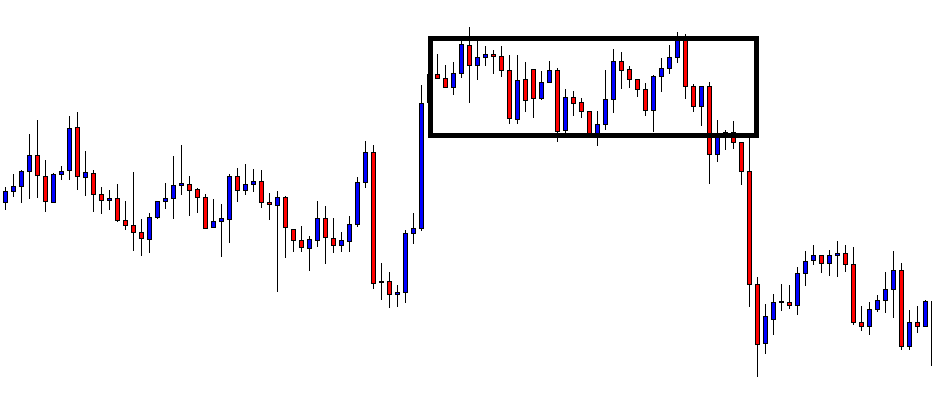
Example C

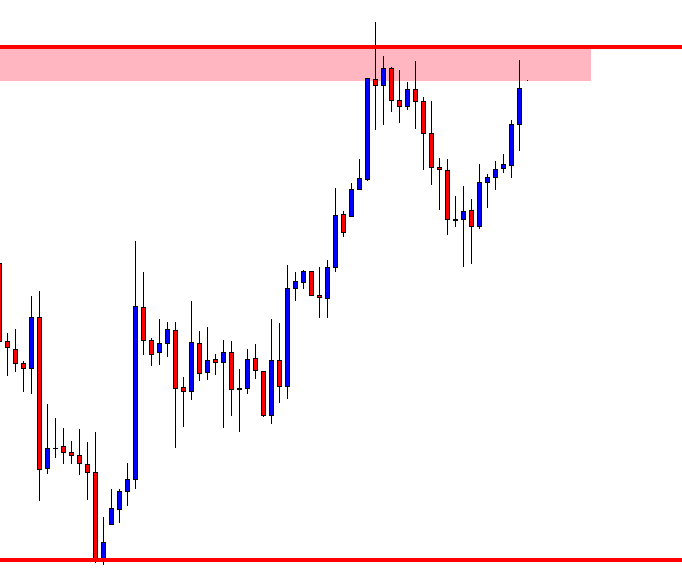
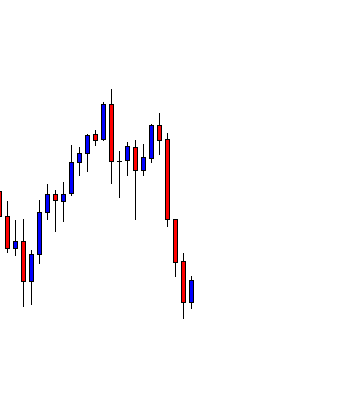
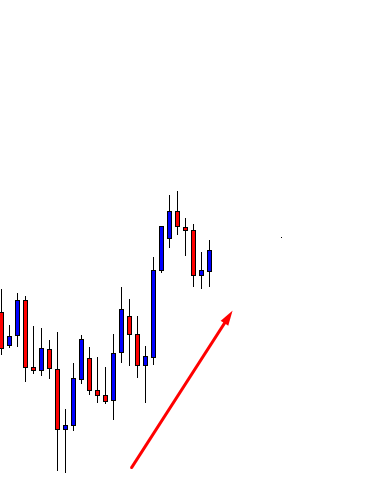
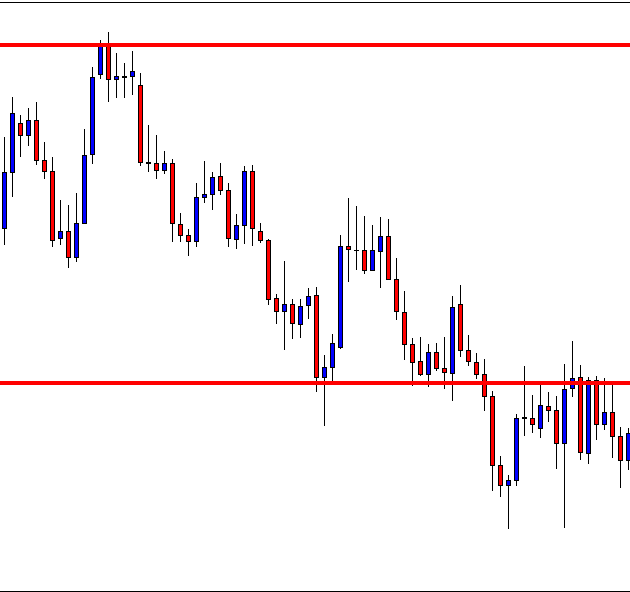
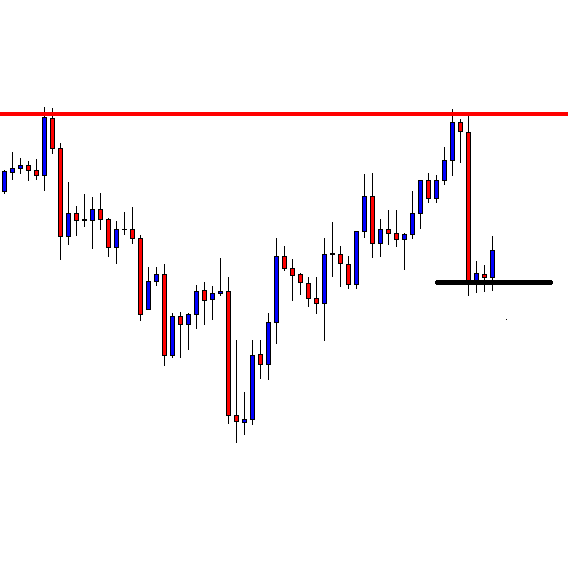
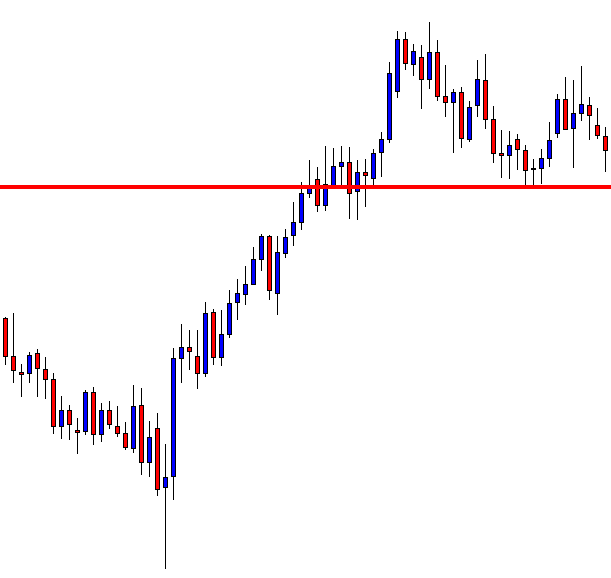
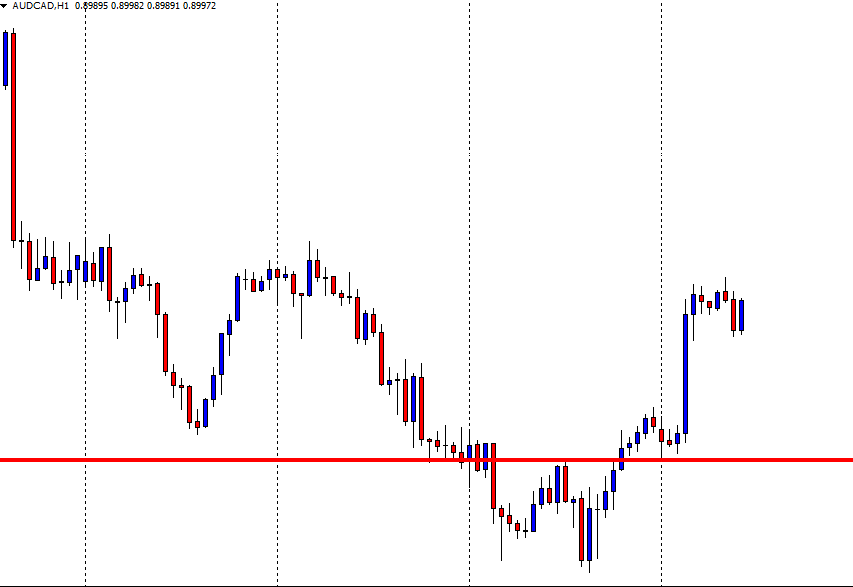
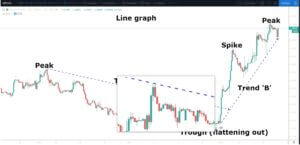
Now let’s look at candlesticks a little more closely. In example ‘C’ we have magnified a section of price action in order that we can analyze the candlesticks in more detail. Note that price action, as denoted by the green candlesticks, is in an upward trend. The last green candlestick in this sequence is called an upside-down hammer. This has a smaller ‘wick’ at the bottom, a small ‘body,’ and then a longer wick at the top: Hence the term upside down hammer. At its height, the price has moved to the highest point and then pulled back before the next candlestick opens. The subsequent candlestick is a descending candlestick with a long body, and one small wick at the top, and where the candlestick is longer than the preceding two bull candlesticks. This type of Candlestick is an engulfing candlestick (it engulfs the previous ones), and often sets the precedent for any subsequent move; in this case lower.
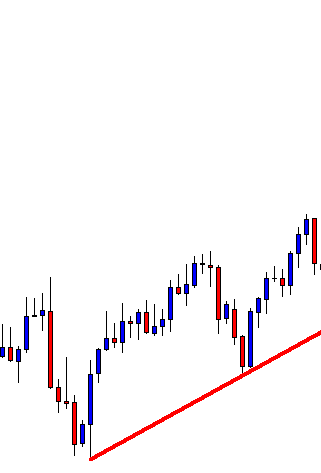
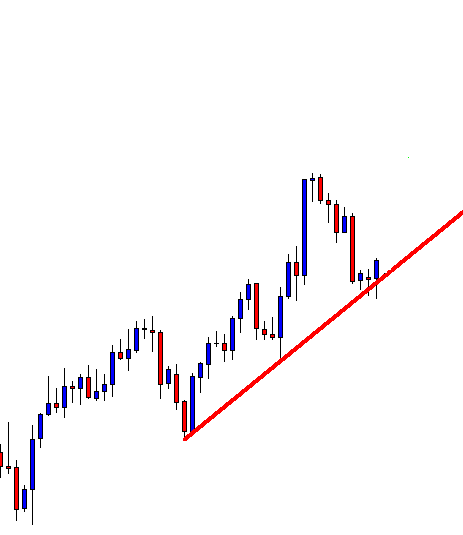
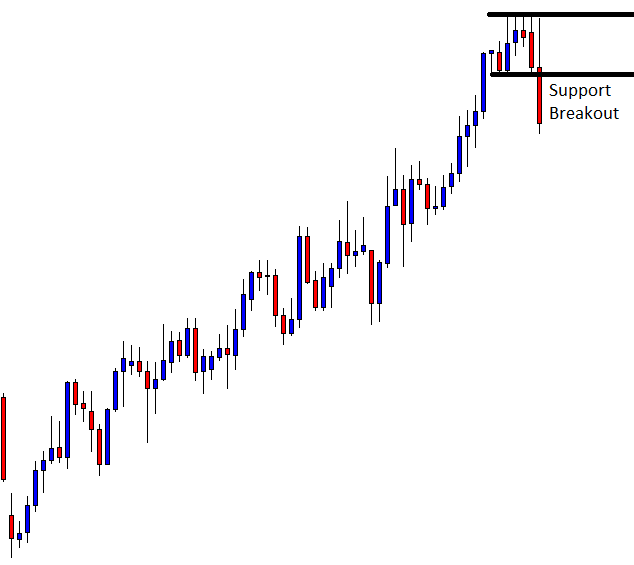
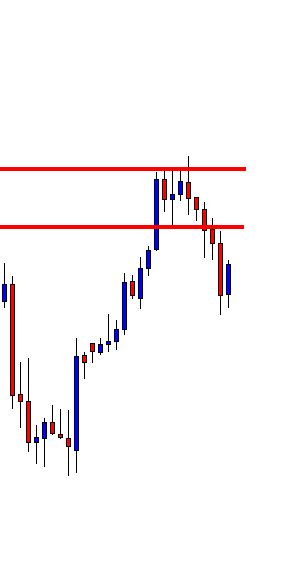
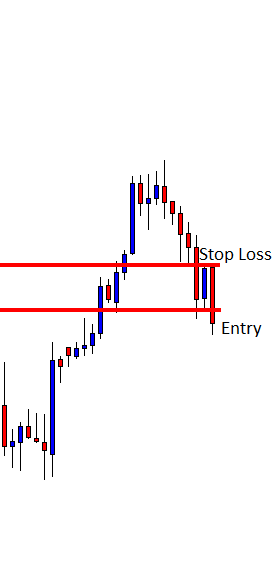
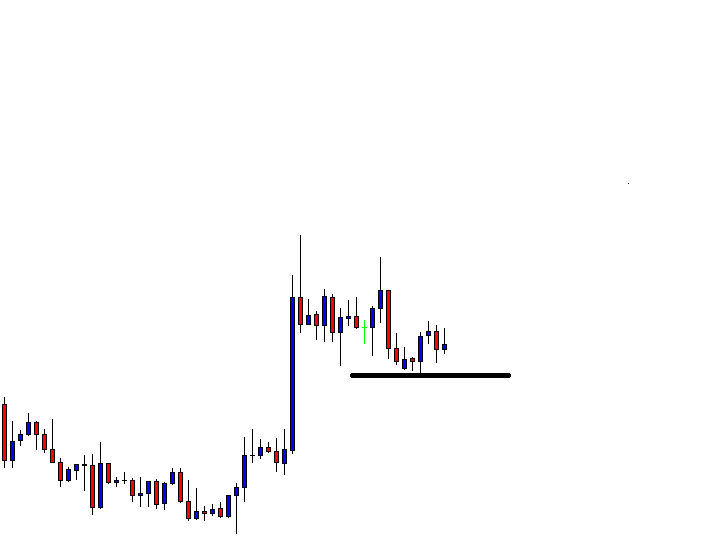
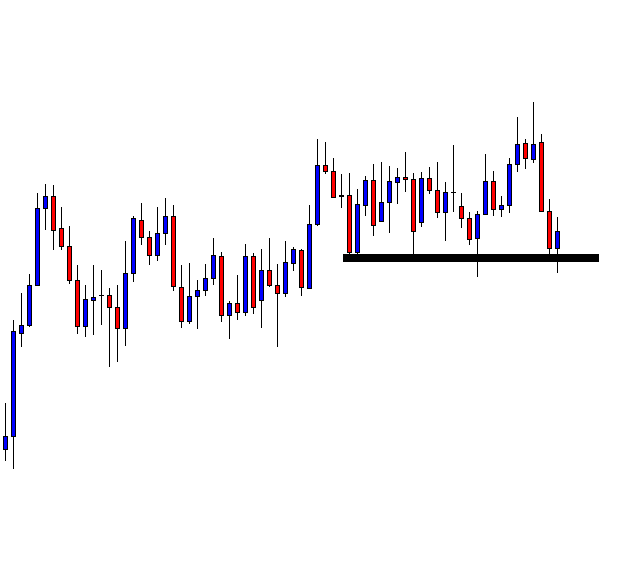
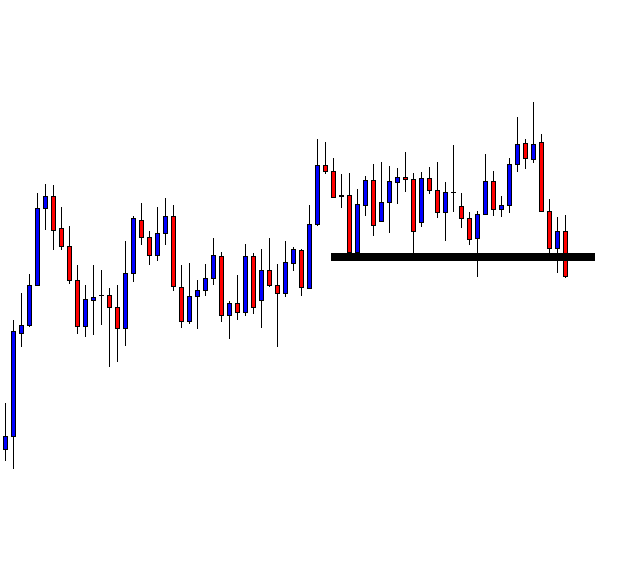
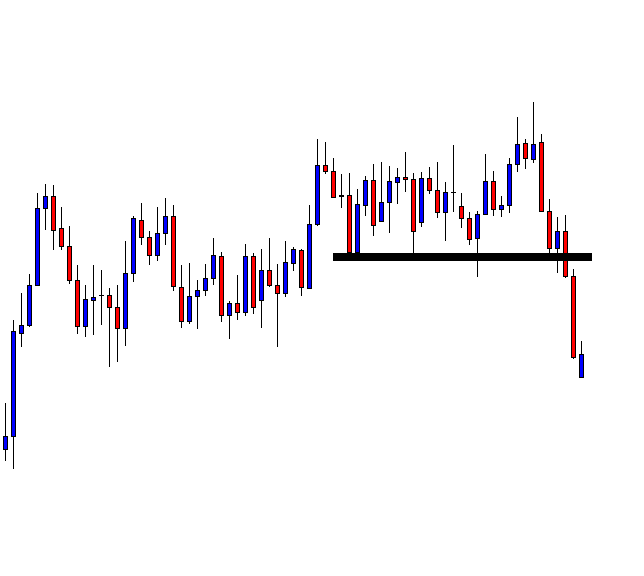
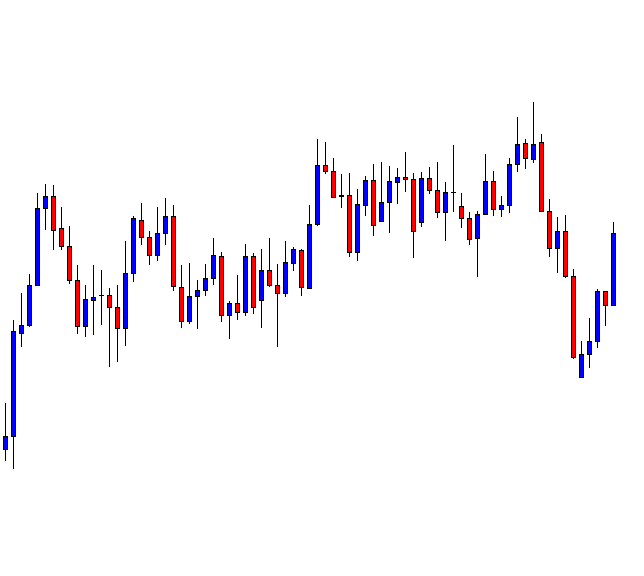
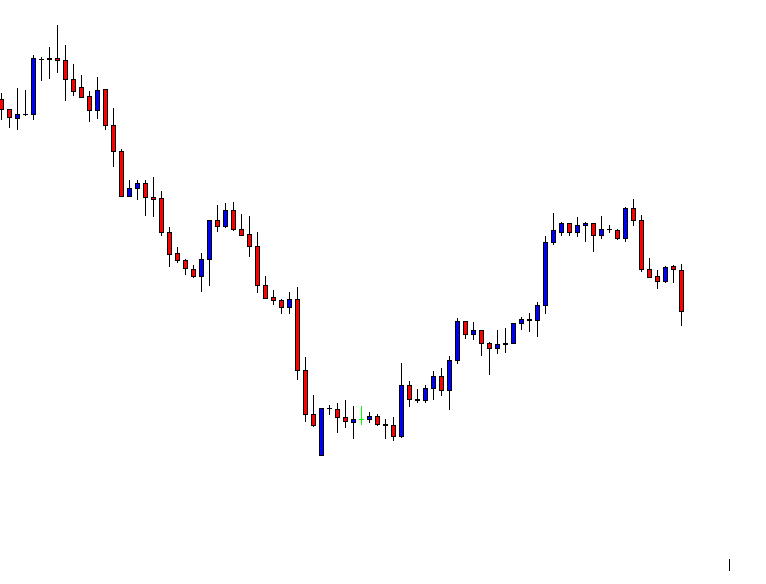
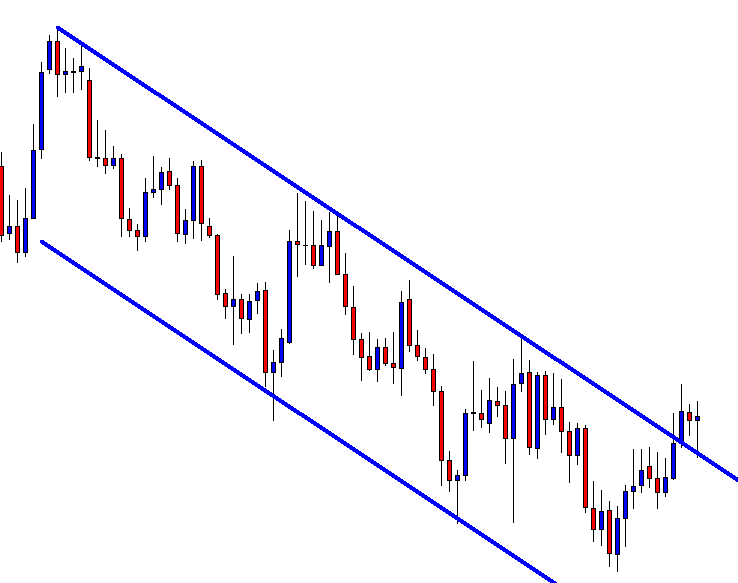
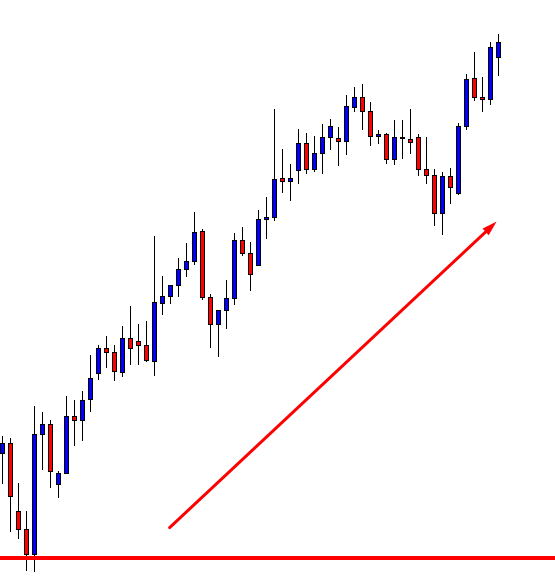
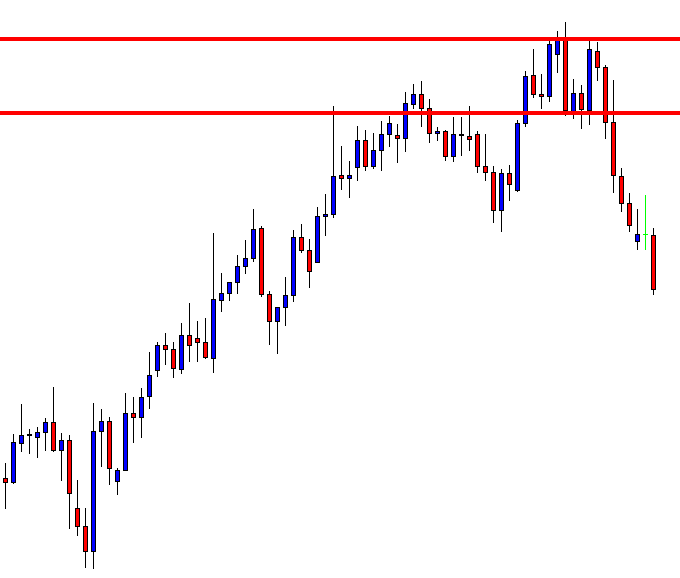
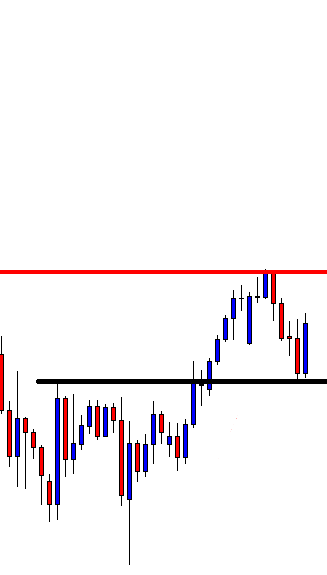
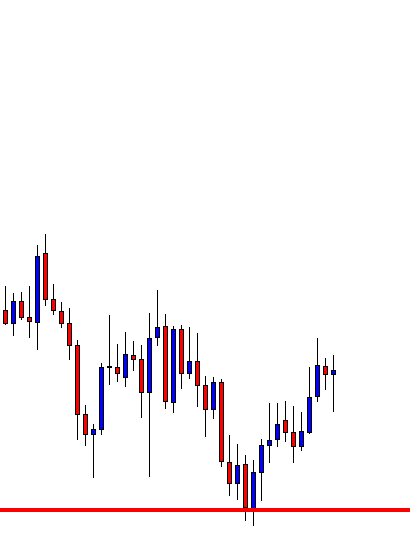
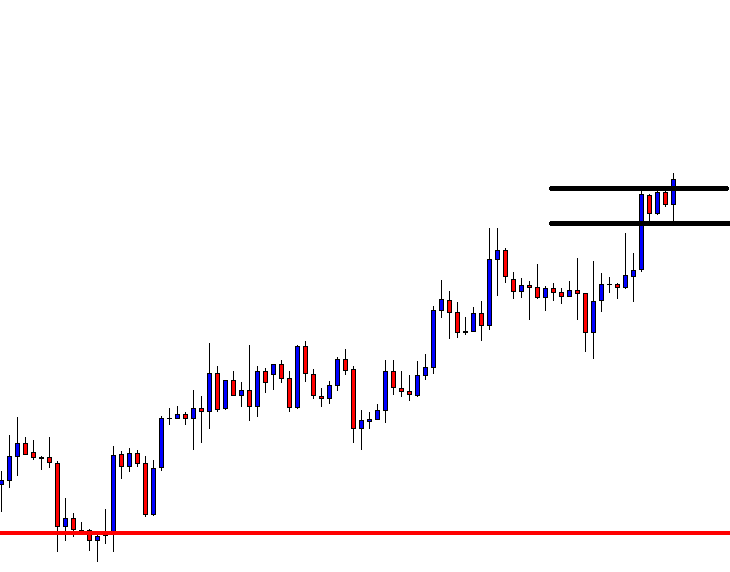
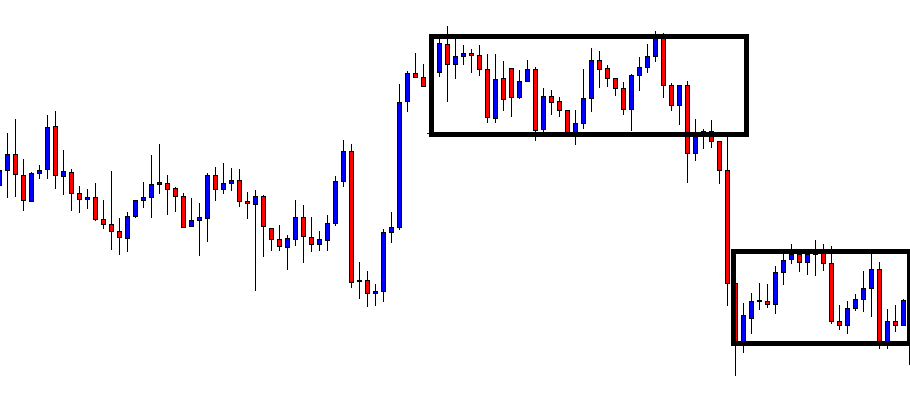
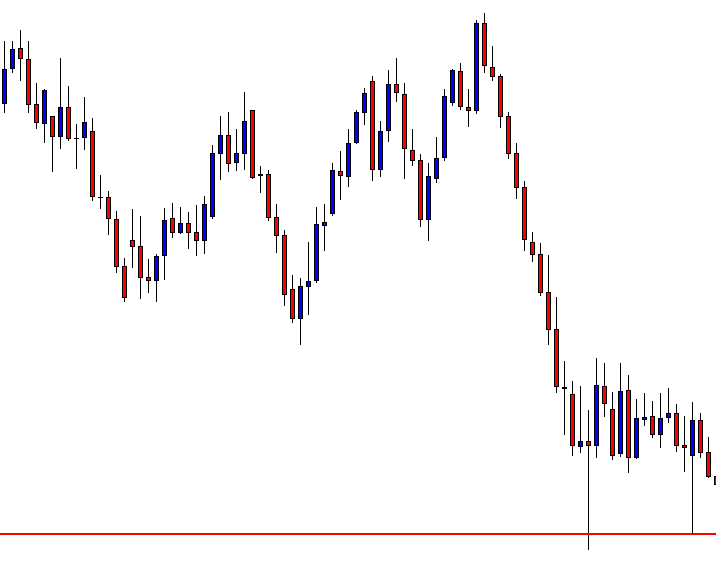
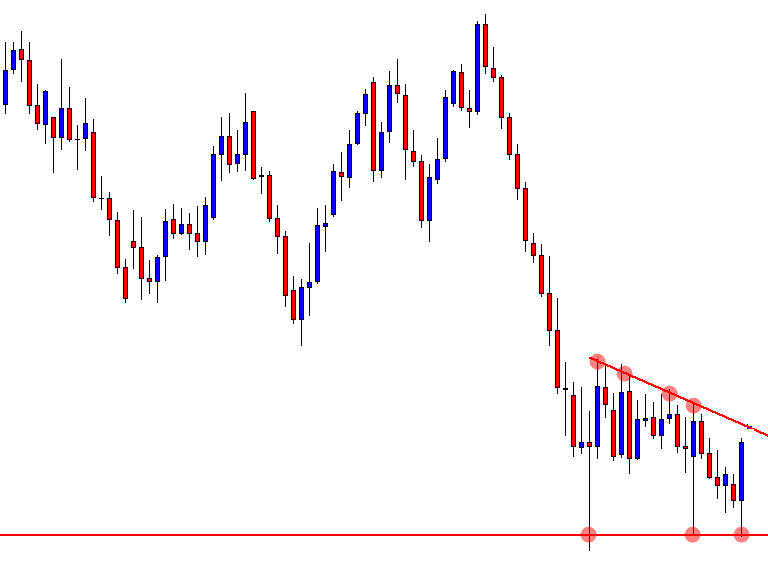
Example D

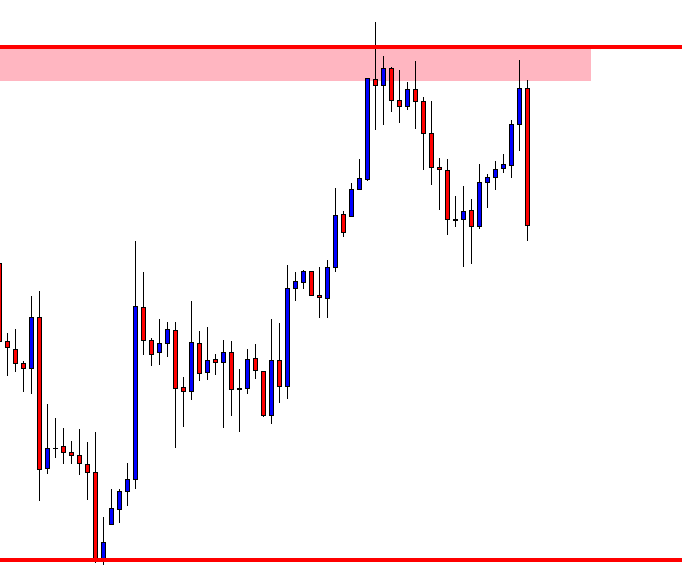
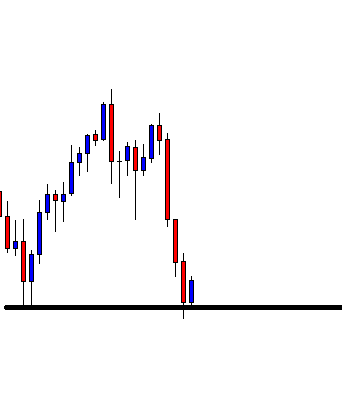
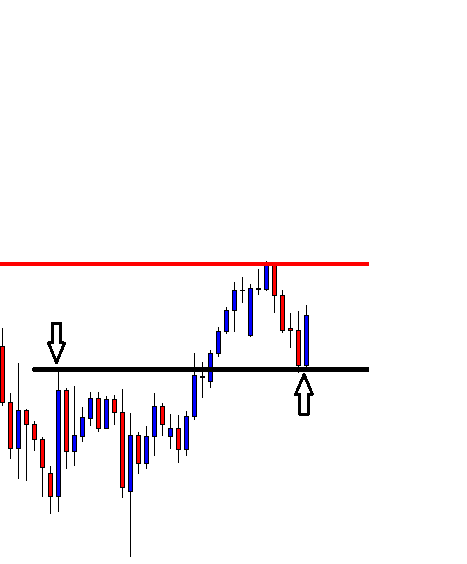
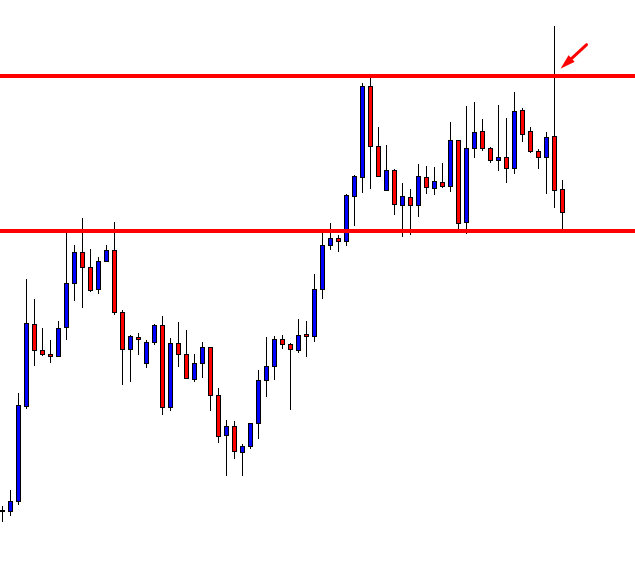
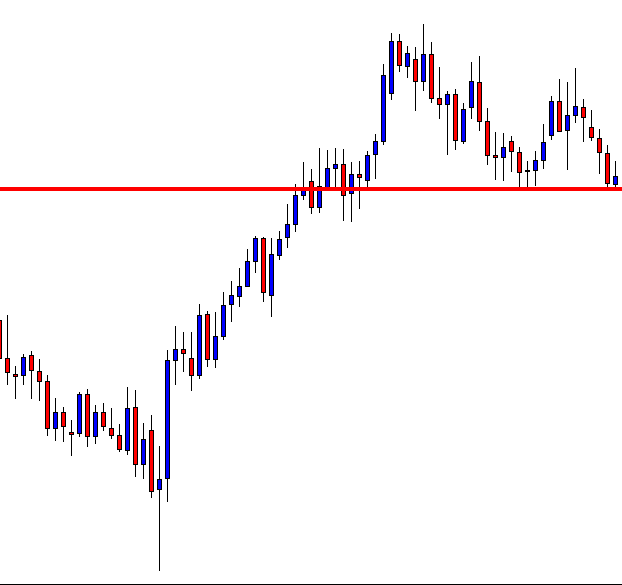
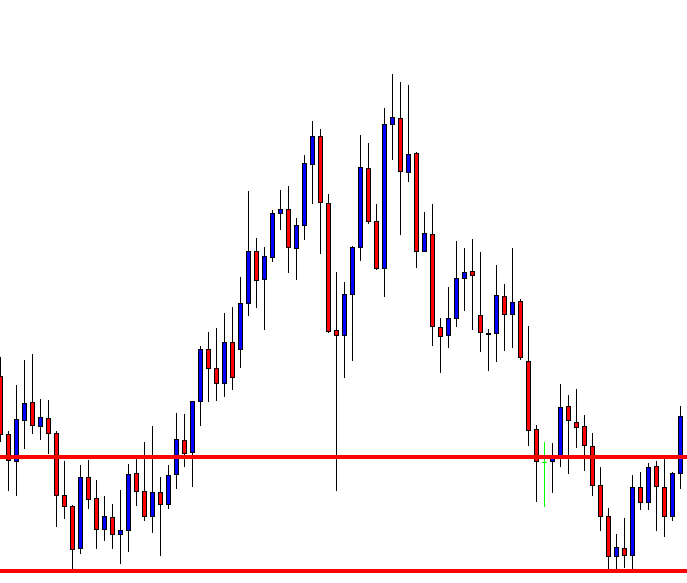
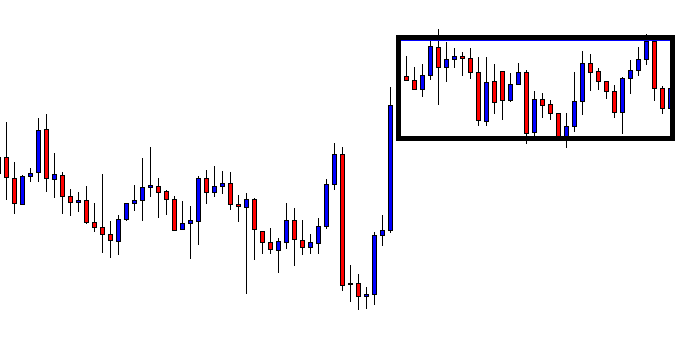
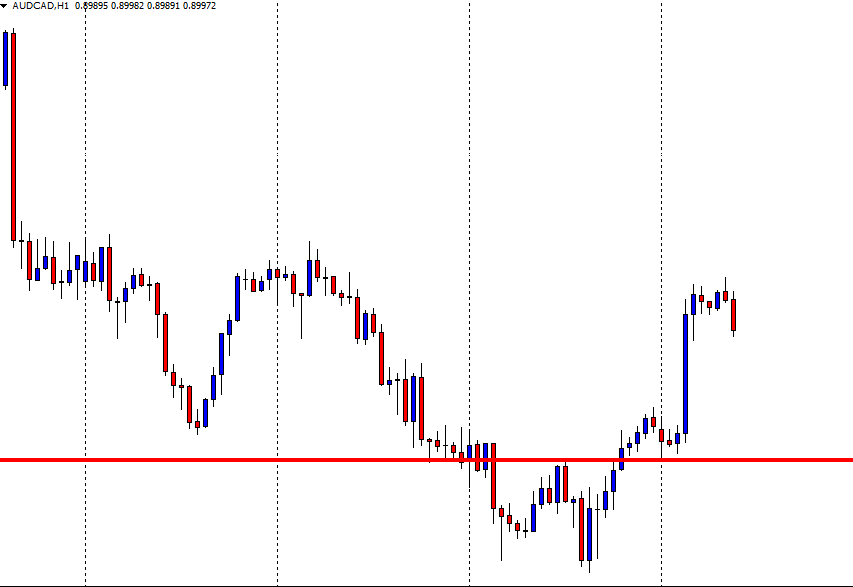
In example ‘D’ we can see that the bulls have been in control of the price action and moved the exchange rate up to trendline ‘A.’ However the subsequence candlestick is a bearish candlestick, which engulfs the body of the previous candlestick, and where price action begins to trend lower. In the middle of the sequence, we see another hammer shape candlestick, but this time it has a longer wick at the bottom, and traders have taken advantage of this and move the price higher. Many of the candlesticks in the remainder of this sequence are very small, and this usually denotes that there is a lack of volume at the present moment in time.
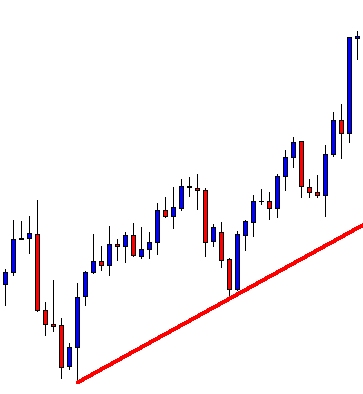
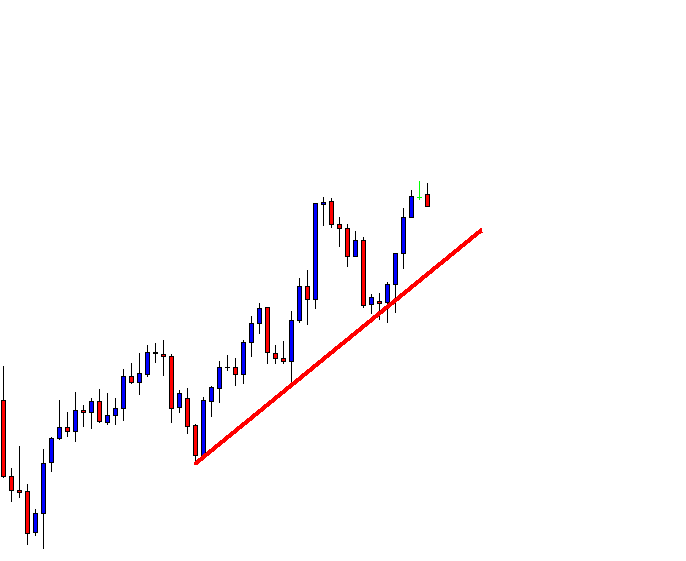
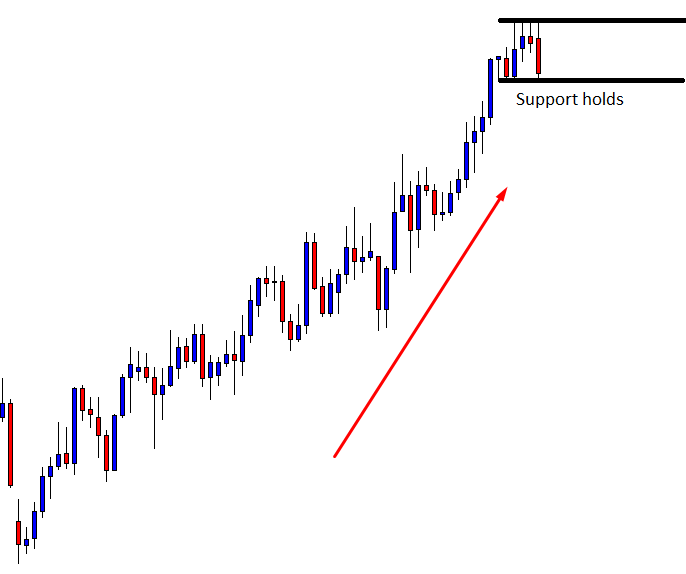
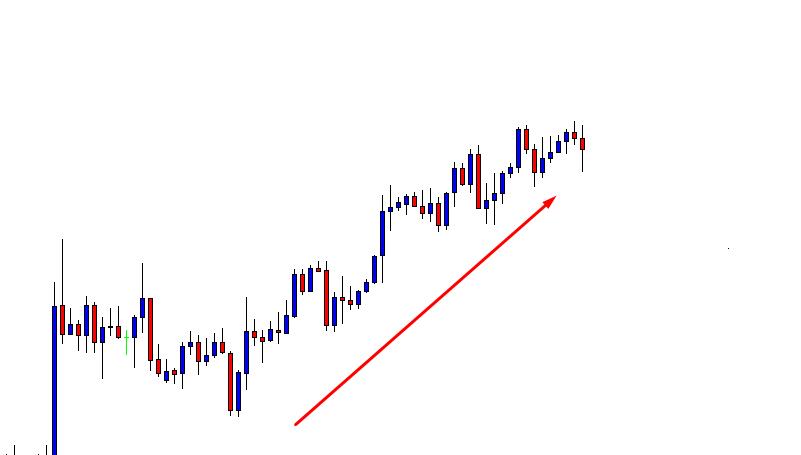
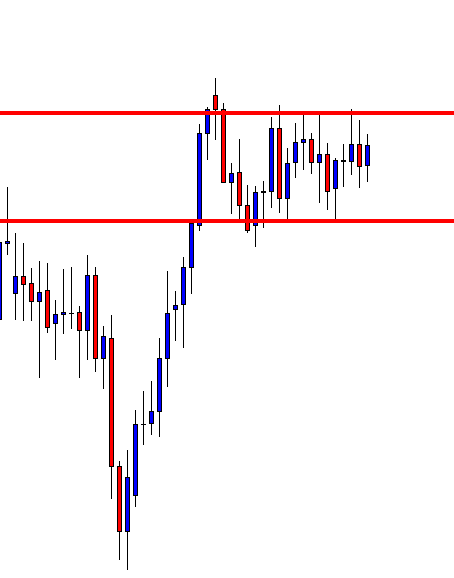
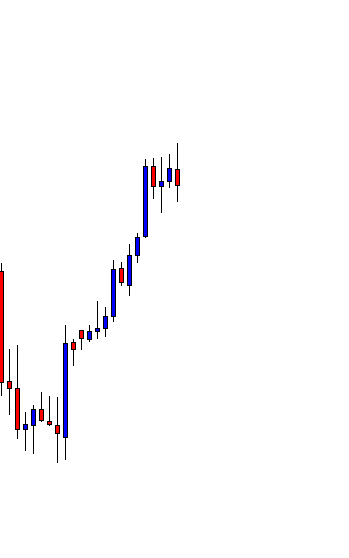
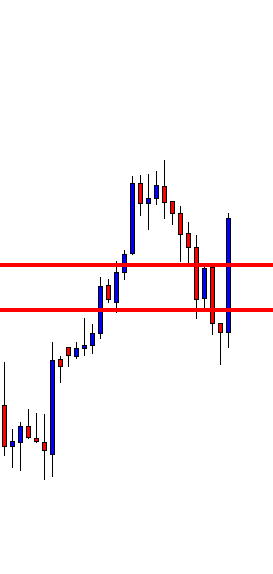
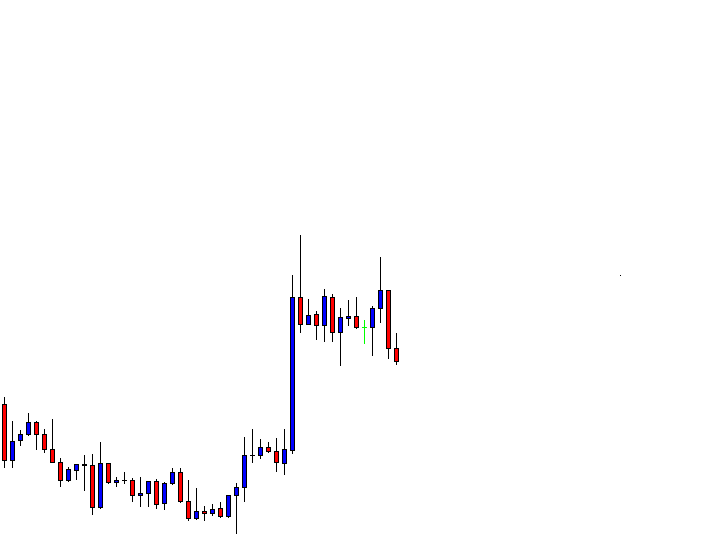
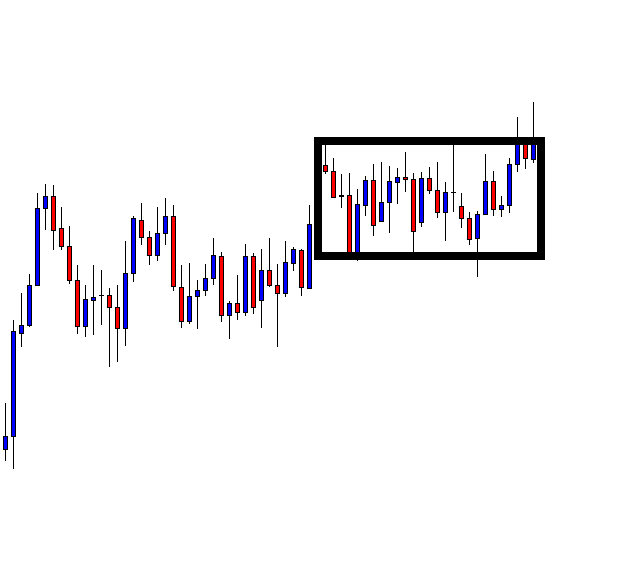
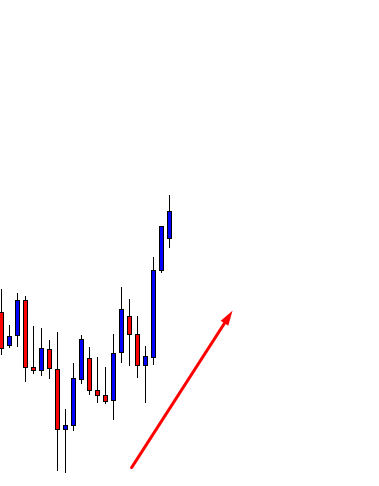
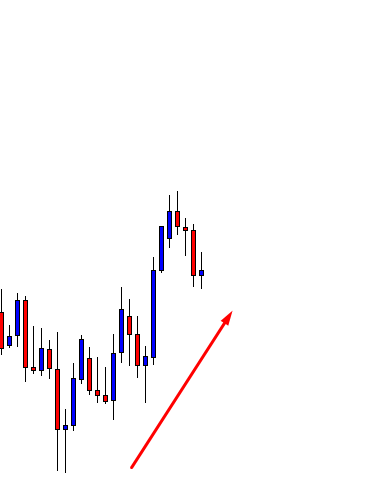
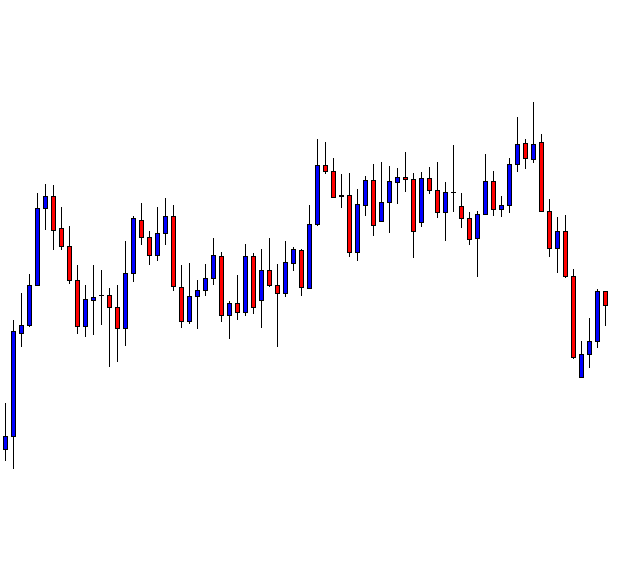
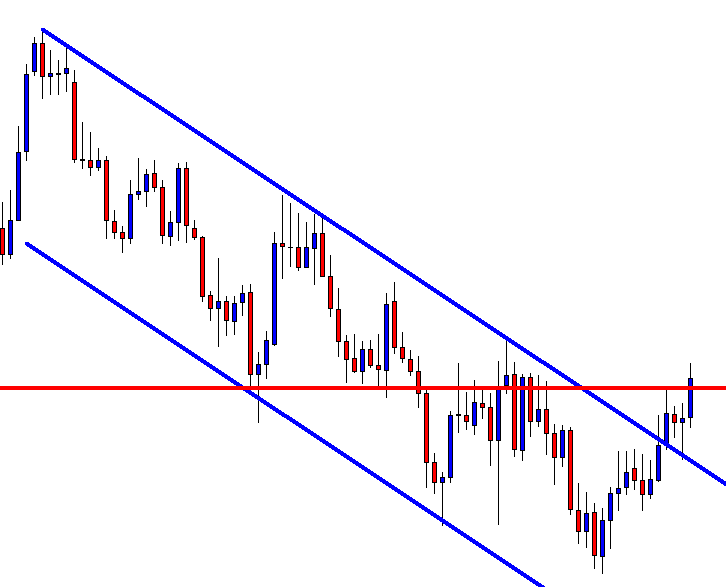
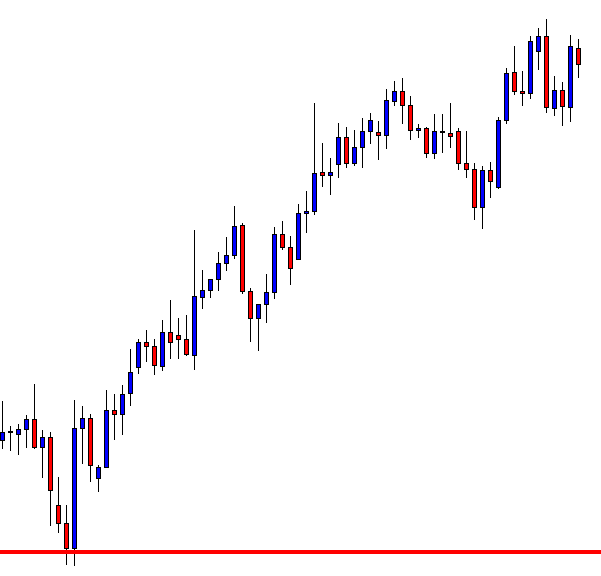
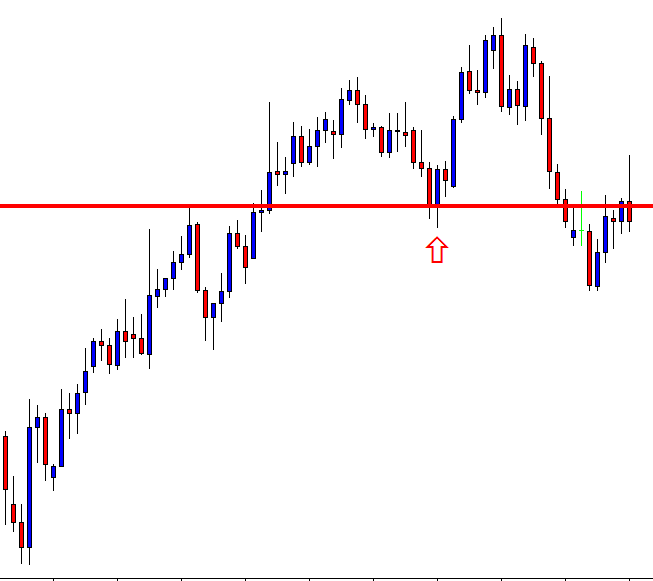
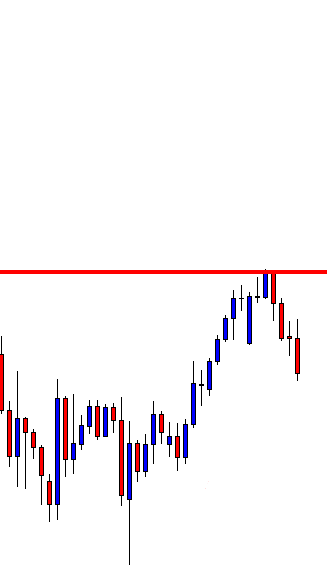
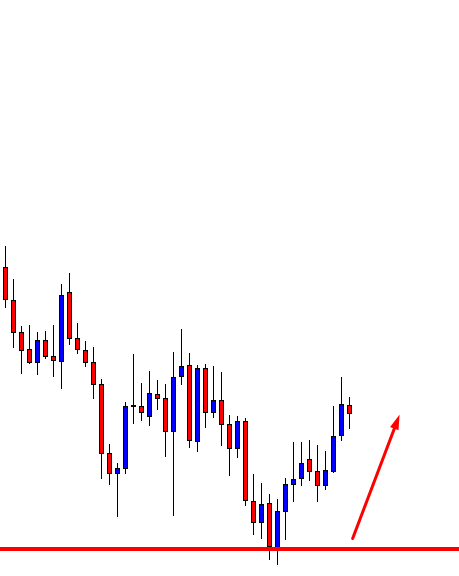
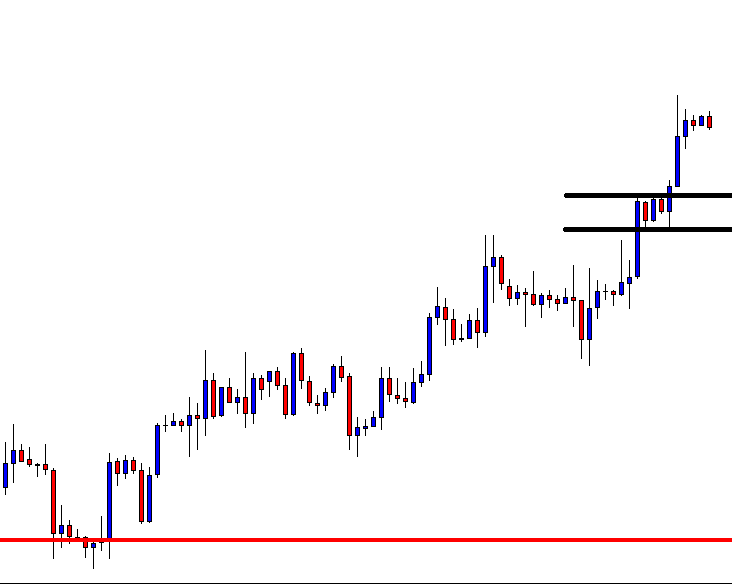
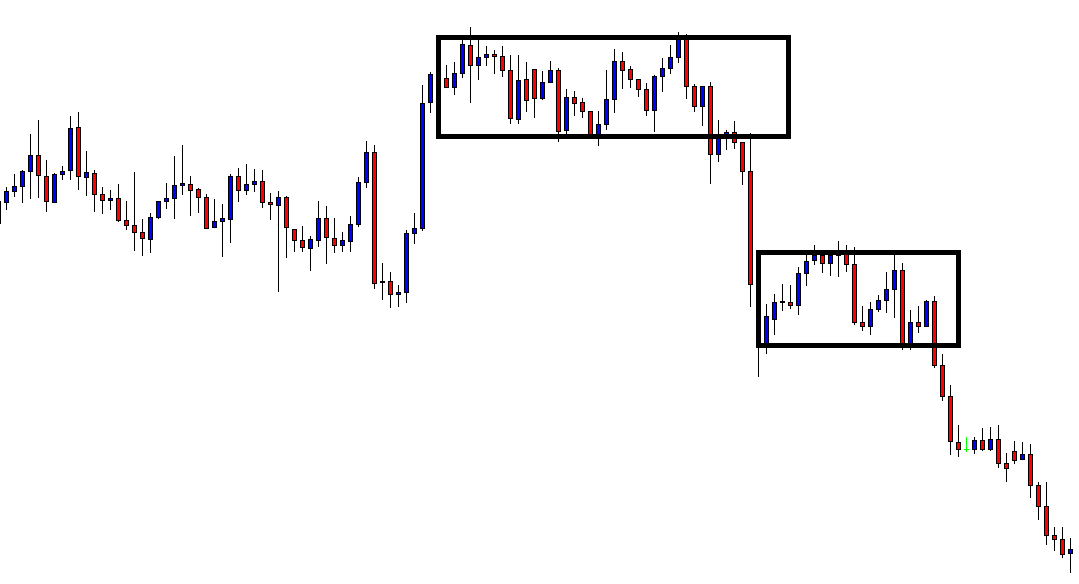
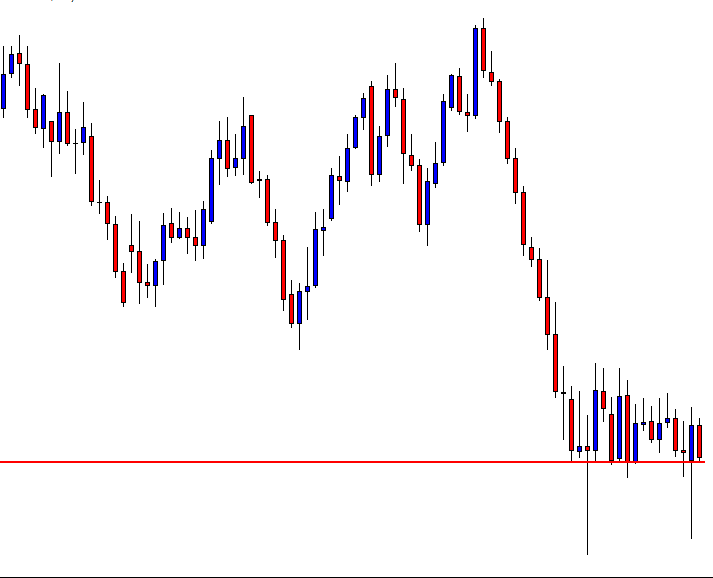
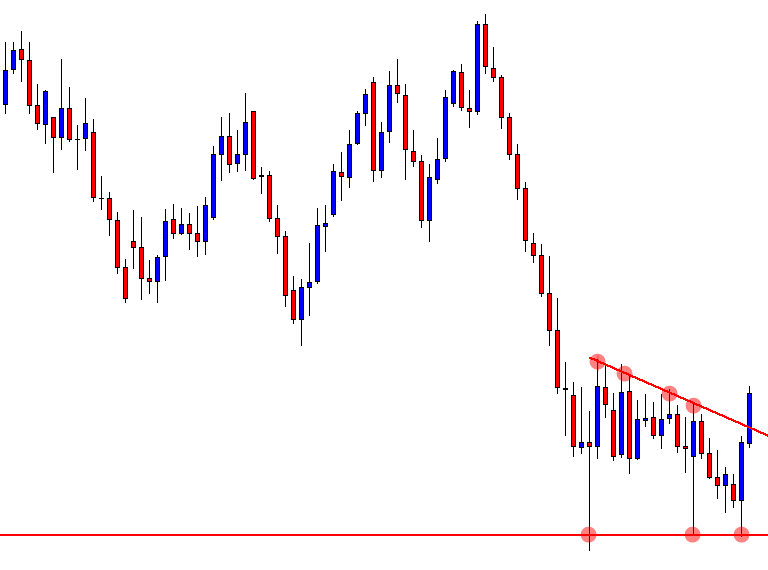
Example E

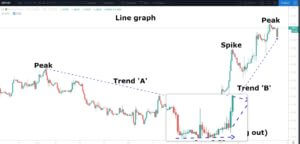
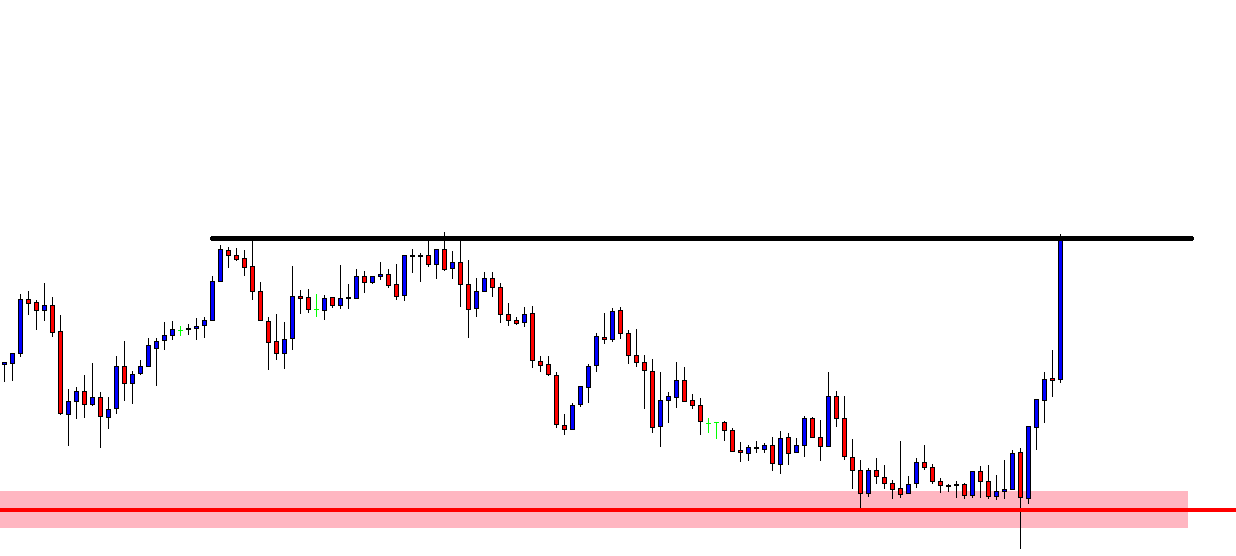
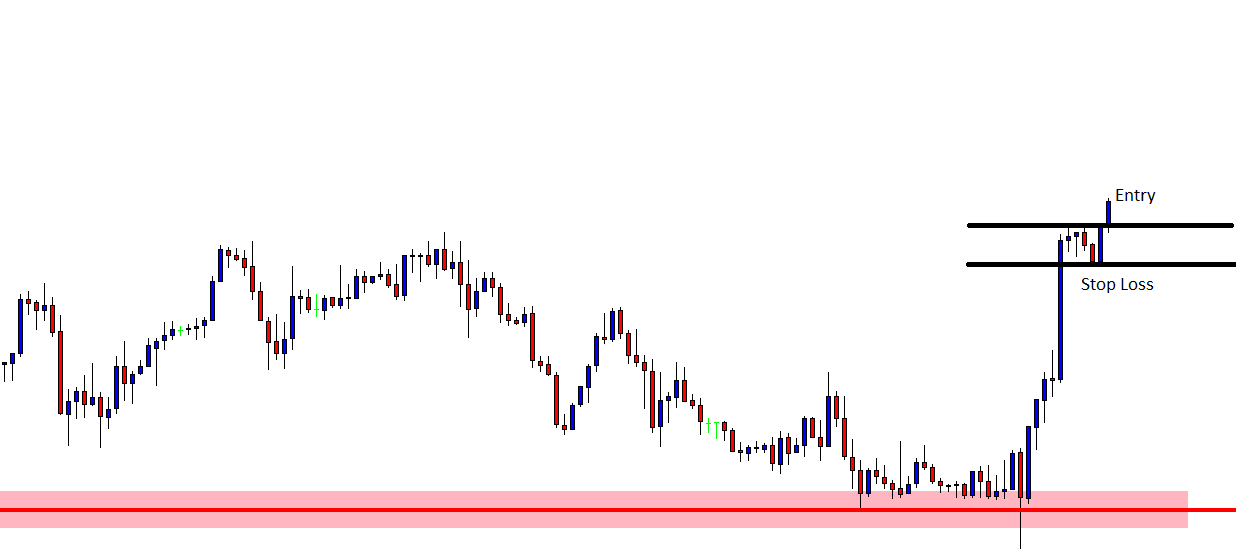
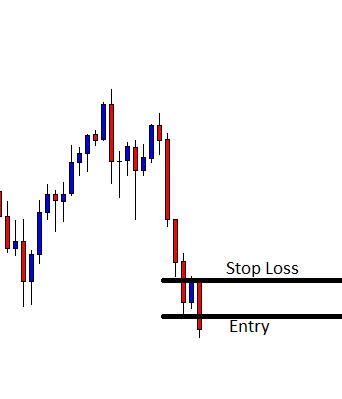
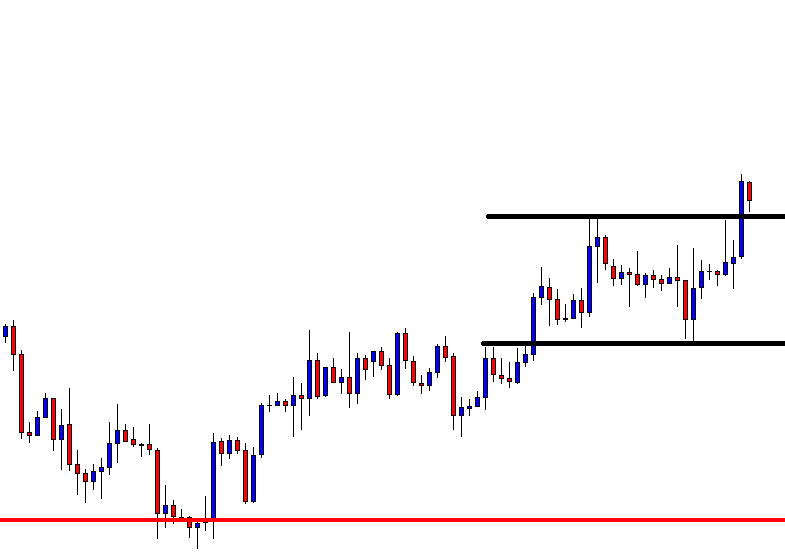
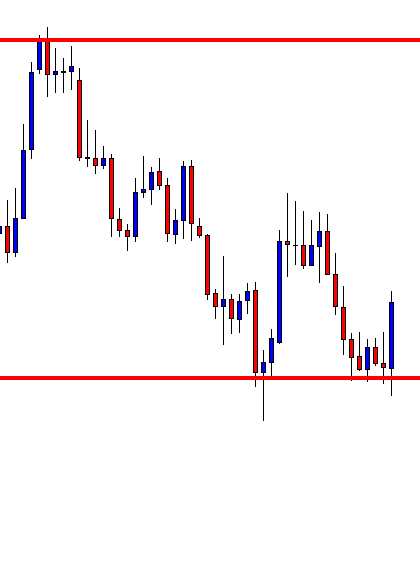
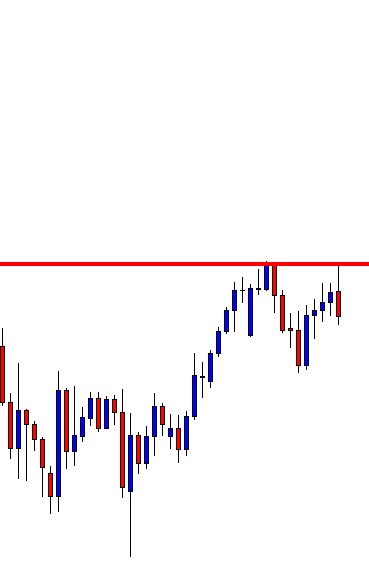
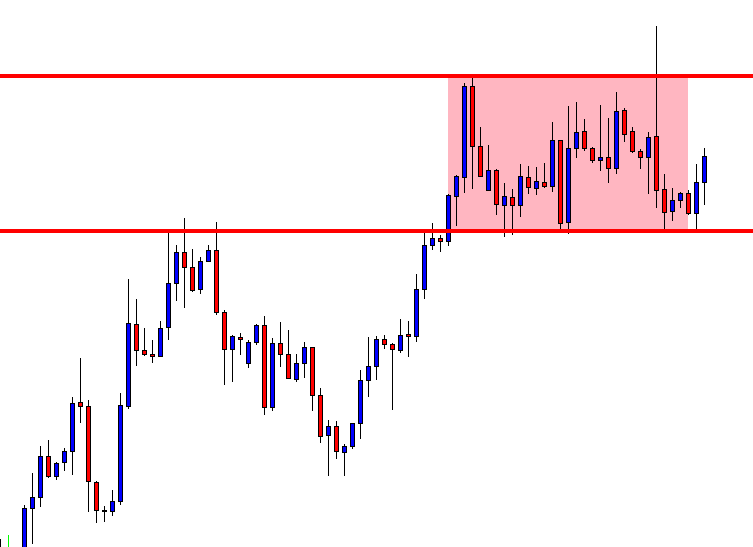
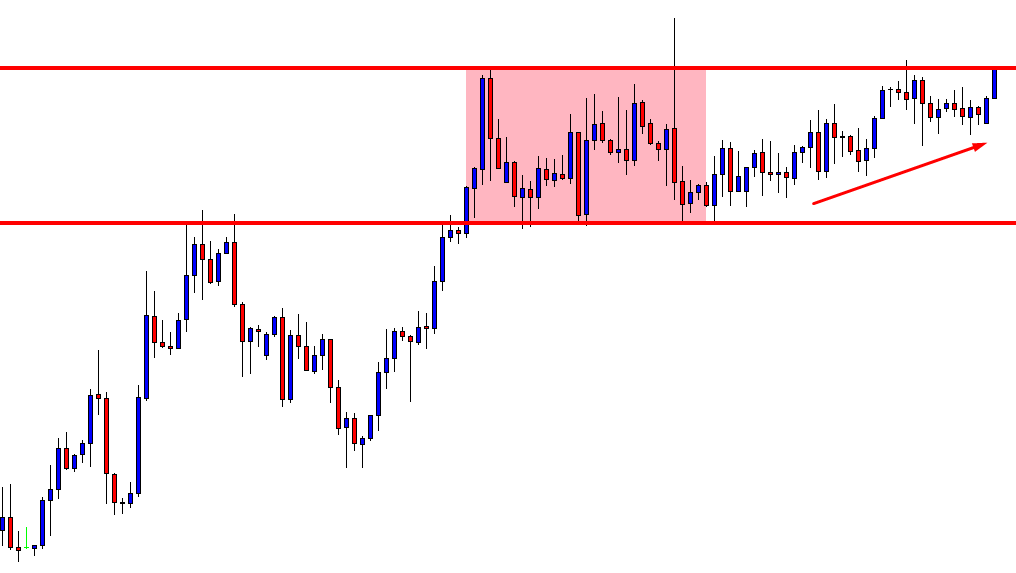
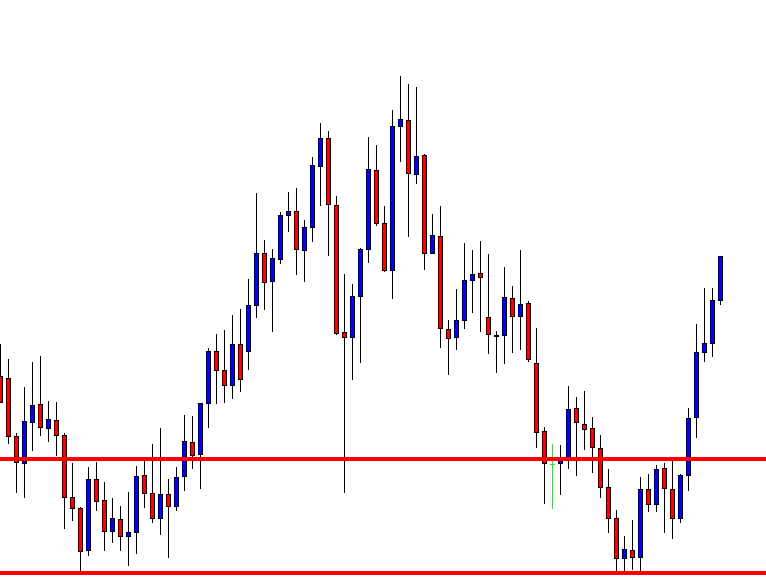
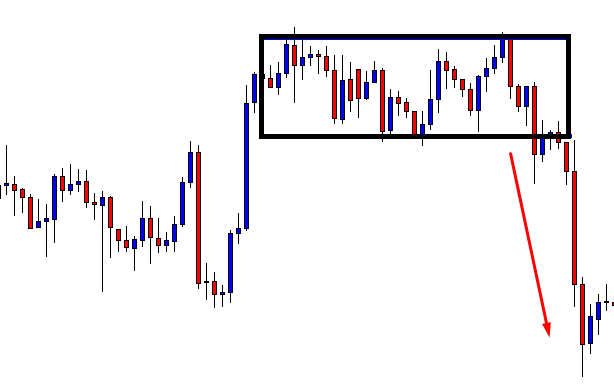
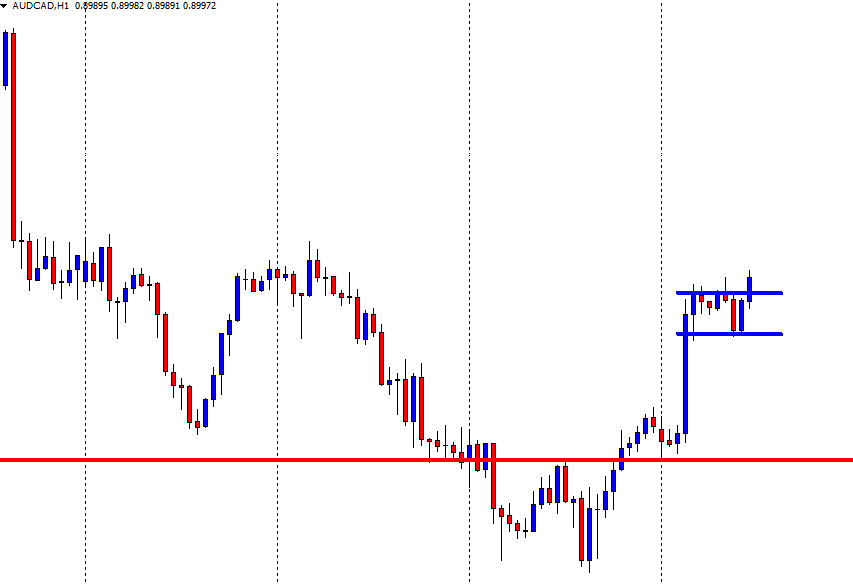
Now we turn our attention to example ‘E,’ where we have magnified the price action around the key 1.22 area. Many of the candlesticks we see have small bodies, and where some of the candlesticks have small wicks; these types of candlesticks are called ‘spinning tops’ and usually denote a lack of direction and a lack of volume in the market. Towards the end of this sequence, we can see that the last two bullish green candlesticks open above the preceding ones, and both of these have long bodies with small wicks, which ingulf the previous candlesticks from the beginning of the move in this highlighted sequence. They form our new bullish move, which we have called trend ‘B.’

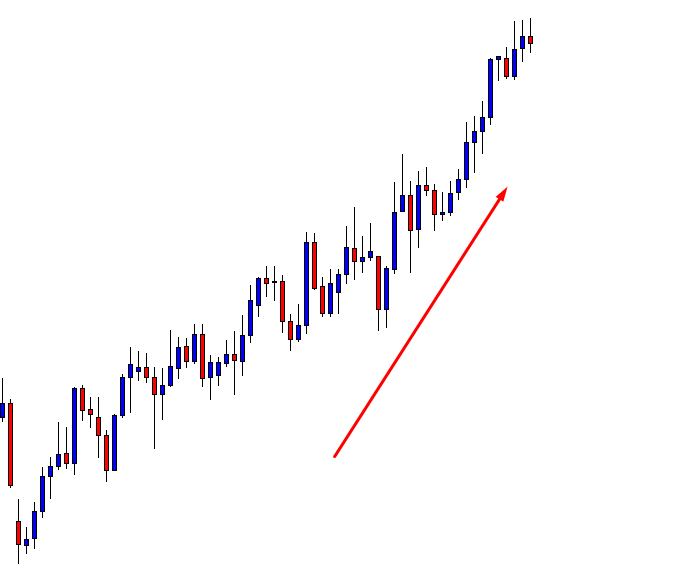
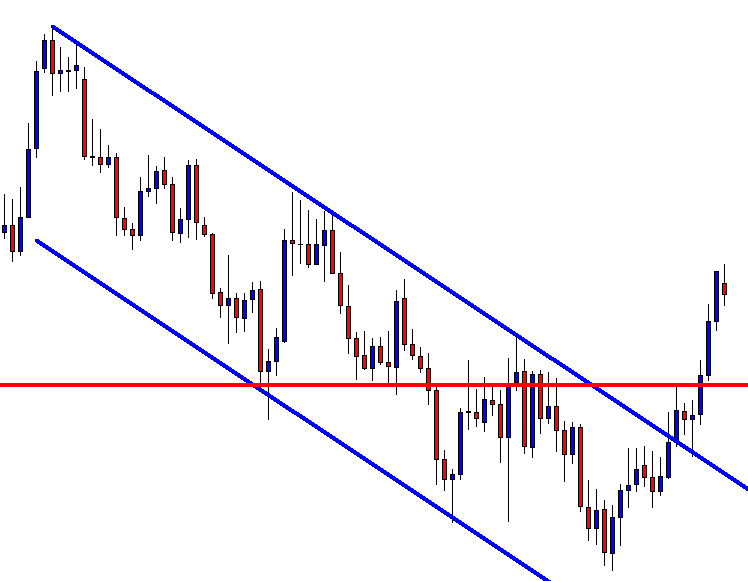
Therefore, the candlesticks become a much better tool to read price action. Suddenly the chaos and randomness ebb away! Remember, the larger the candlestick, the stronger the trend. Candlesticks are the best available tool for mastering price action. They are a leading indicator, and when combined with other technical analysis tools will help you get an edge in your trading! We will identify more Japanese candlesticks later in our course.