Price Consolidation
In any market, but specifically, the Forex market, when we talk about price consolidation, we are referring to the price action, or the up and down movements, of exchange rates of a particular currency pair that occurs between defined levels of support and resistance.
These areas of consolidation are typically seen after, or during trend cycles, either to the upside or downside or during time zone crossovers. At these times, price action will usually become slightly muted and whereby volume in terms of liquidity dries up.
Some people refer to these areas of price consolidation as the markets taking a breather, or times of indecision. At these times, traders will look at what has been happening on a currency pair after a defined trend in either direction, due to technical or fundamental analysis. At which point traders will be wondering if the trend will continue or if there will be a reversal. And therefore, liquidity is taken out of the market until such time as traders pile into the next move.
Therefore, price consolidation can only be identified via technical analysis.
Example A
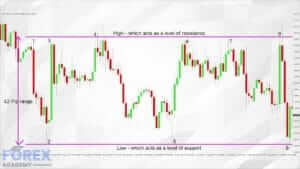
And so let’s look at the example ‘A,’ which is a fairly typical example of what you can expect in the Forex market on an all too regular basis. This is a 15-minute time frame of the EURUSD pair. We are using Japanese candlesticks and some trend lines which we have drawn it onto our chats.
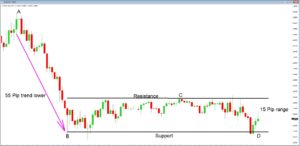
We always read our chats left to right, because they tell a story of where the pair has been moving too and from. We can see that from position ‘A’ there was a bearish trend which is clearly defined by our red candlesticks. Traders pushed the pair lower by 55 pips during this move, before price action pulled back slightly due to indecision by traders.
Position ‘B’ then becomes an area of support, and price action consolidates between this support level and a clearly defined area of resistance, where price action fails to go any higher than position ‘C.’ We then have a period of sideways movement or price consolidation, and where the overall movements between these two lines is restricted to a very small 15 pip range. In the middle of this section we can see that some of the candlesticks are very small, and during some of those 15-minute time frames, price action moves no more than a couple of pips. This is a clear sign that price action is in a consolidation mode, and where traders will be looking for the next breakout from this narrow range.
Example B
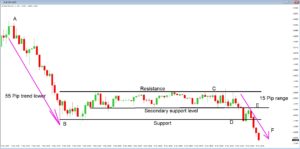
Let’s go back to that chart as per example ‘B,’ which is a few time frames later than the previous. Here we have added a secondary support level. This level was not breached during the midsection of this consolidation period. However, as price action begins to fade to the downside of the consolidation period and breaches the secondary support level and also breaches the original support level briefly before moving up to the secondary support level, which then becomes an area of resistance at position ‘E.’ Price action then falls back to our original support level. We can see that the size of the candlesticks has become larger, and during this later stage where the sellers’ candlesticks engulf those of the final two bullish candlesticks in the series. This indicates to traders that buyers are starting to stay on the sidelines and where sellers believe that they will see a continuation of the trend lower and which originally started at position ‘A.’ Therefore, the activity around positions ‘D’ and ‘E’ become selling opportunities and where a secondary trends lower has been established from this period of consolidation. The longer the period of consolidation, the more likely the market will react with an explosive breakout. Remember, at some stage, the market simply must move on.
Example C
So how do we know if support and resistance is applicable to our chart? Have a look at the example ‘C.’
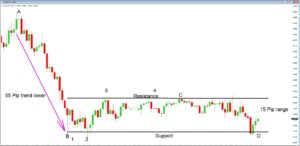
The best way to determine if support and resistance is happening is to establish at least two positions on our chats where the market fails to go lower, and this will be the support or floor, and two positions on our chats where price fails to go higher, and this an area of resistance, or a ceiling. As we can see in our diagram, price action fails at position B’s bearish trend, and we have now called this position 1, Traders try to push the pair lower again and failed at position 2. The move action pushes higher to position 3. A subsequent move fails to go higher at position 4. Therefore this could be considered to be acceptable areas of support and resistance.
We can now use these levels of support and resistance in our risk management strategy, should we wish to take on a trade in either direction with this pair. If we believe the market is likely to break out to the downside eventually, then we should place our stop loss a couple of pips above the highest candlestick formation adjacent to our resistance line.
On the flip side, if we believe the market will reverse the original trend lower, and move to the upside, we would simply need to place our stop loss a couple of pips under the lowest candlestick adjacent to our support line. This is typically how professional traders place this stop losses when trading out from areas of consolidation.