Engulfing candle is the strongest reversal candle. In a bearish market, the buyers wait for a bullish engulfing candle and flip over to the minor chart to take entry. It does not usually go wrong. However, from time to time, things may not go according to traders’ expectations, even with engulfing candle. In today’s lesson, we are going to demonstrate an example of that. Let us proceed.
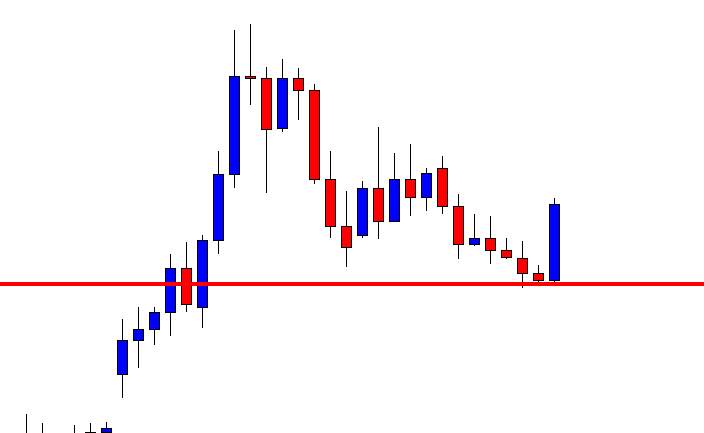
This is a daily chart. The chart shows that the price makes a bearish move and finds its support. It produces a bullish engulfing candle. Thus, the H4 breakout traders may flip over to the H4 chart and wait for the price to consolidate and to create a bullish engulfing candle to go long in the pair. Let us flip over to the H4 chart.
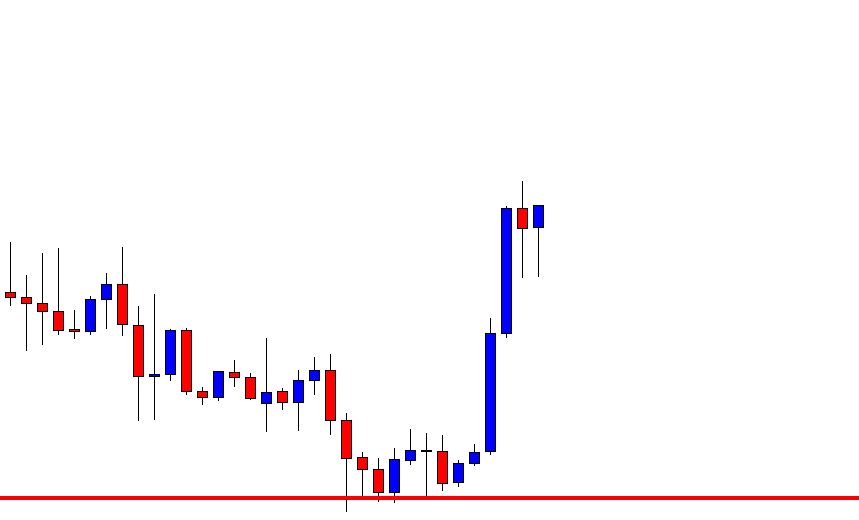
The H4 chart also looks very bullish. The price starts having consolidation. Then, it produces a hammer. It seems the chart may not take too long to produce a bullish engulfing candle breaching consolidation resistance.
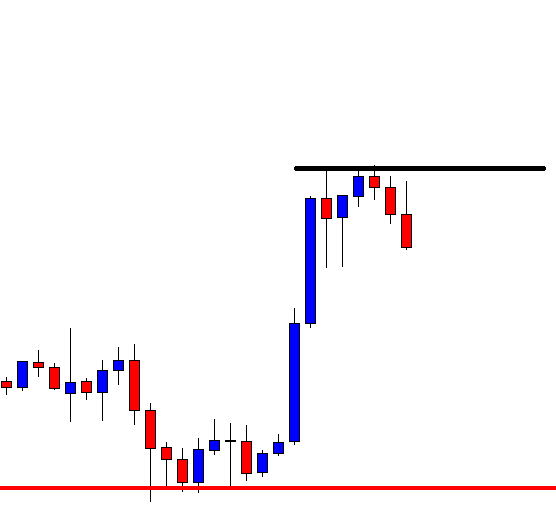
The chart produces another bullish candle closing within consolidation resistance. The price heads towards the South to search for its support. It has been taking longer than the buyers’ expectations. They must not be impatient but keep their eyes on the chart.
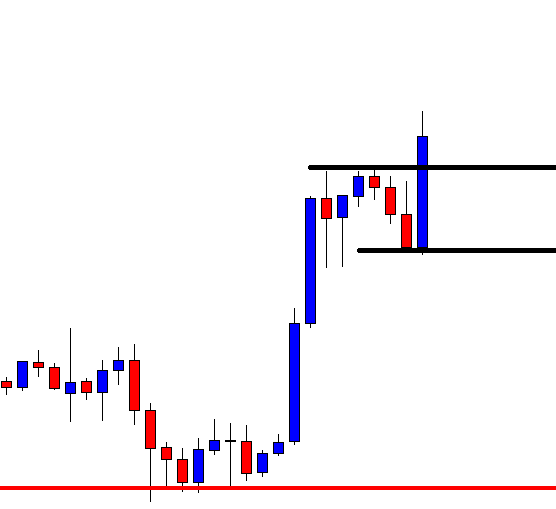
The price finds its support and produces a bullish engulfing candle. The candle closes well above consolidation resistance. The buyers may trigger a long entry right after the last candle closes by setting stop loss below the level of support and by setting take profit with 1R. The signal candle suggests that the buyers find a good deal here. Let us proceed to the next chart to find out what the price does.
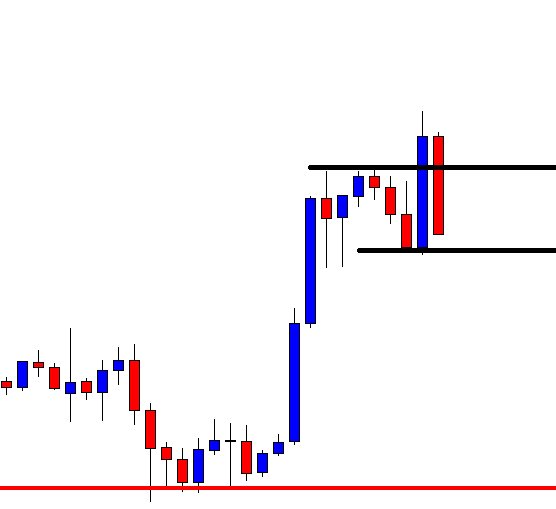
I do not think that the buyers are ready for this. The last candle comes out as a bearish inside bar, but it closes within consolidation resistance and support. It does not hit stop loss yet. The buyers still have a chance to win this. This looks ominous for them, though.
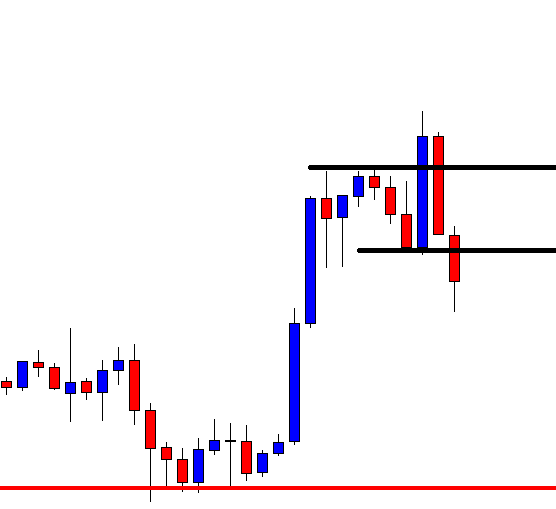
The price hits stop loss now. The last candle comes out as a bearish candle closing below consolidation support this time. All of a sudden, it becomes the sellers’ territory. The H4 buyers must avoid this chart for a while.
The lesson we get from today’s example is a chart, which looks only for the buyers’ turns into opposite within two candles. Things get changed anytime in the Forex market. Thus, traders should not be overconfident with their analysis, strategy at any point in their trading life.