A Breakout Brings More Momentum than any Other Trading Factor

A bearish engulfing candle at a Double Top or consolidation resistance is an excellent signal to go short. However, if a bearish engulfing candle closes right within the support level, it sometimes may create an upside momentum on the minor charts. In today’s article, we are going to demonstrate an example of that.
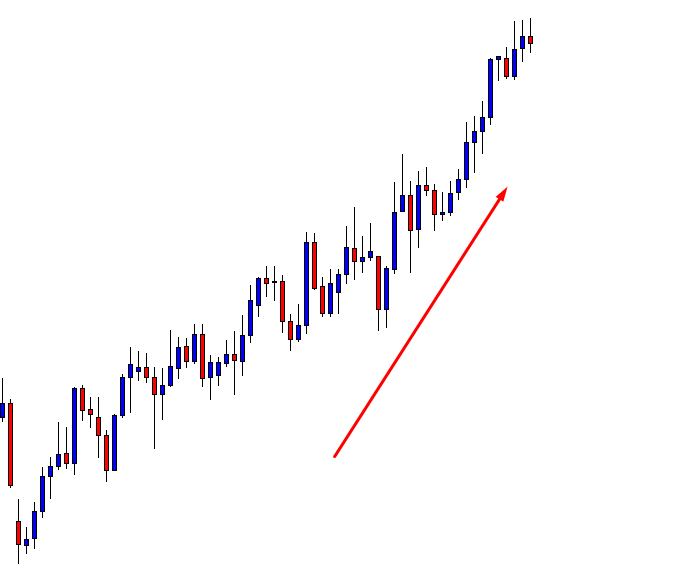
The price heads towards the North with strong bullish momentum. Ideally, traders are to look for opportunities to go long here upon consolidation, followed by upside breakout. The last candle comes out as a bearish candle. It may consolidate and make an upside breakout as things look. Let us go to the next chart to find out what happens next.

The pair produces a bearish engulfing candle. Several rejections and a bearish engulfing candle suggest that traders may want to go short on the pair. If they’re going to go short from here, they are to flip over to the H1 chart since it is an H4 chart. For a reason, I am not showing the H1 chart since the H4 chart itself tells the story that I want to share. Let us look at the H4 chart with another equation.
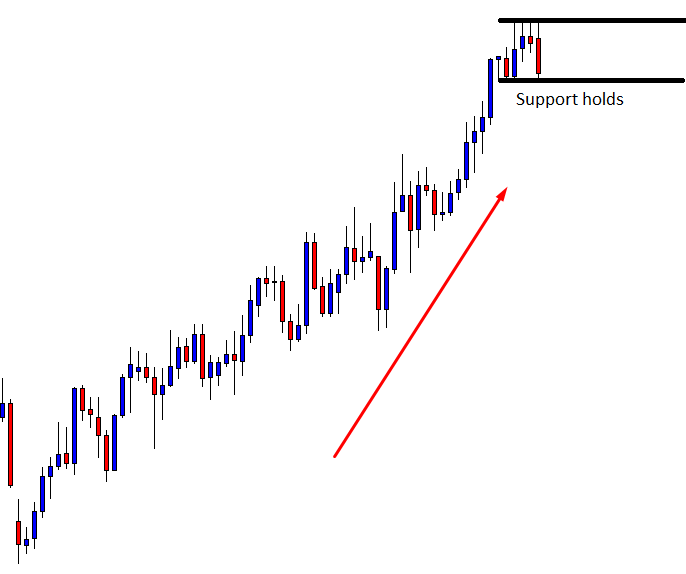
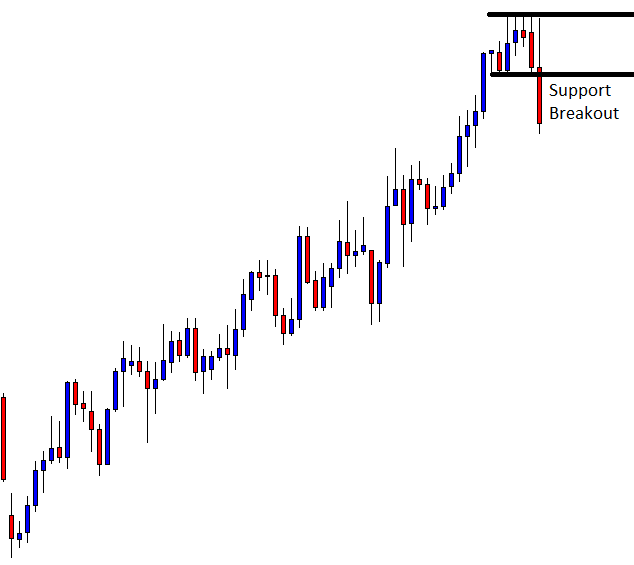
The candle closes right at a level where the price has bounced earlier. This is an explicit support level, which may play an essential part in the minor charts. Soon we find out how the pair reacts from here.
Look at the last candle. The candle comes out as a bearish engulfing candle. However, look at the upper shadow. It goes up to the consolidation resistance. With some brokers, because of the high spread factor, some traders’ Stop Loss may be swept away. The last candle, after having a strong rejection at around the resistance level, closes below the support. The sellers are to flip over to the H1 chart, wait for consolidation and bearish breakout to go short on the pair.
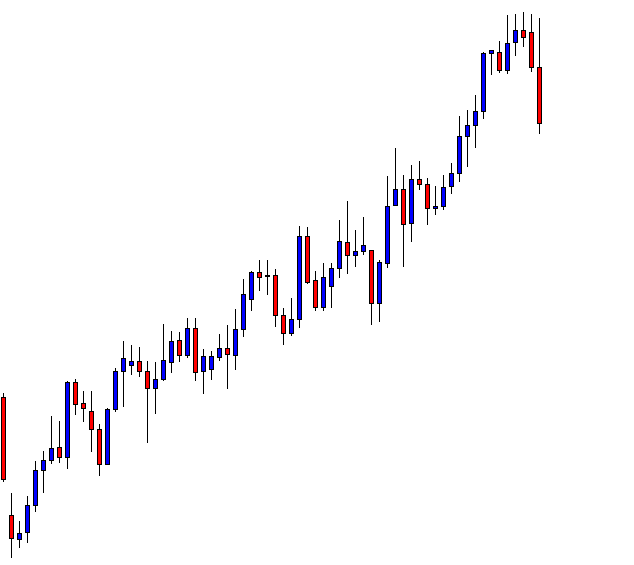
Again, I am presenting the H4 chart to show the next price movement.
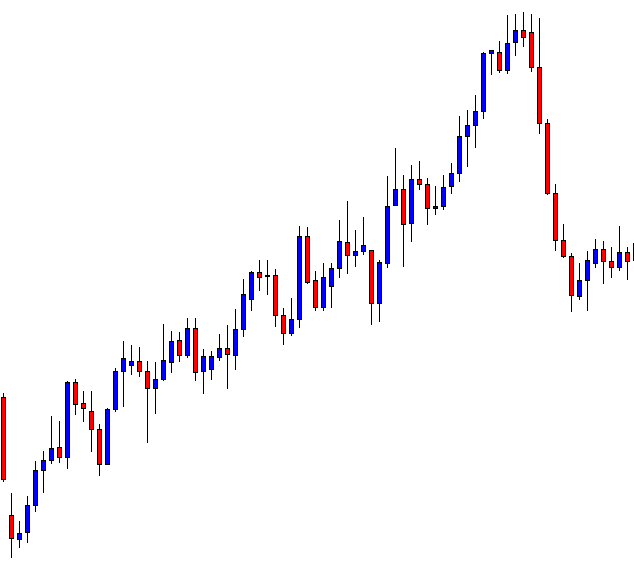
The price does not look back this time. It heads towards the South with strong bearish momentum. The H1 chart may have offered some entries, as well. What lesson do we get from these examples?
- In an H4-H1 combination, after an H4 reversal candle, traders are to flip over to the H1 chart to take an entry.
- The last swing high or swing low on the H4 chart is to be counted.
- If the reversal candle closes right within the last swing high or swing low, it may push the price towards another direction, produce spike and sweep away our Stop Losses.