On Tuesday, gold prices were trading in a tight area of 1,462 – 1,452 as traders were mostly staying out of the market during the Asian and European sessions. All of a sudden, we noticed a dramatic buying trend in gold, which lead its prices towards 1,472 and even higher. Most of the buying came in response to U.S. President Donald Trump’s action of slapping tariffs on Brazil and Argentina.
Besides this, Construction spending from the United States also dropped to -0.8% from the expectations of 0.3% and weighed on the U.S. dollar. The ISM Manufacturing prices showed a minor drop of 46.7 from expected 47.0.
On the trade deal front, the U.S. dollar remained under pressure after the demand of tariffs removal as a part of the phase-one deal by the Chinese government. Trump, in response, told Commerce Secretary Wilbur Ross, who reported the media that Trump would not back off from tariff hike on December 15 if China would not sign the phase-one deal by then.
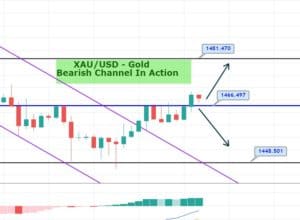
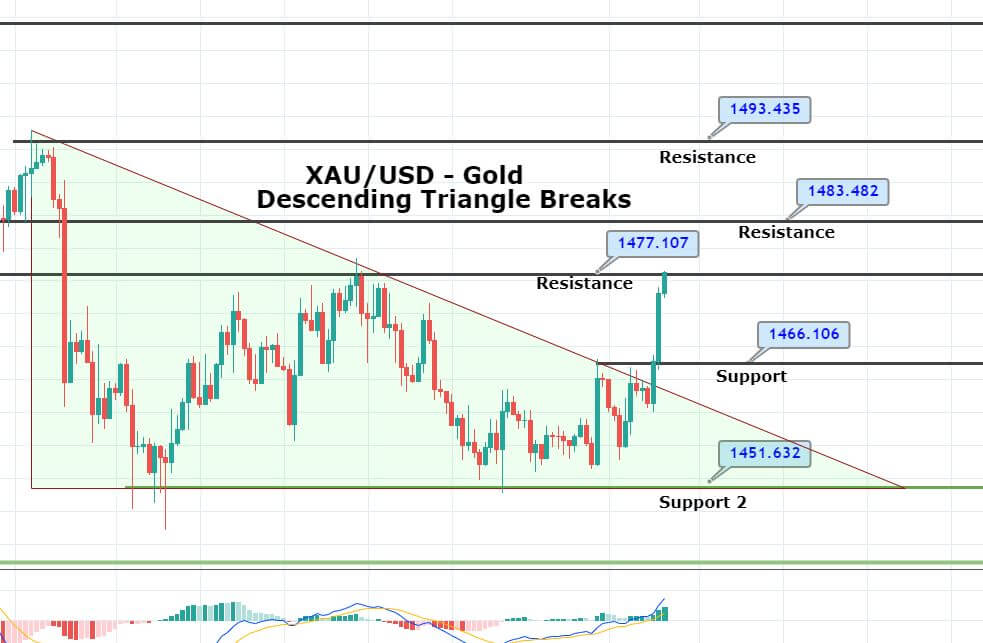
Taking a look at the technical side of gold, the metal is trading around 1,474 area with an immediate resistance around 1,476. The precious metal has violated the descending triangle pattern, which is now supporting gold around 1,466 area.
Support Resistance
1,455.8 1,467.31
1,449.15 1,472.18
1,437.64 1,483.69
Pivot Point 1,460.66
On the 240 minutes chart, gold may form three white soldiers pattern, which typically represents chances of a bullish bias among traders. Likewise, the leading indicators, such as RSI and MACD, are also suggesting the odds of a bullish trend in gold. Consider staying bullish above 1,466 and bearish below 1,476/77 today. Good luck!