In the Forex market, most pairs start trading with a gap after weekends. Most of them are not visible on charts such as the H1, H4, or the daily. Some pairs begin with a big gap, which is visible even on the major charts. It gets difficult for price action traders to trade and make a profit when a pair starts with an evident gap. In today’s article, we are going to demonstrate an example of this.

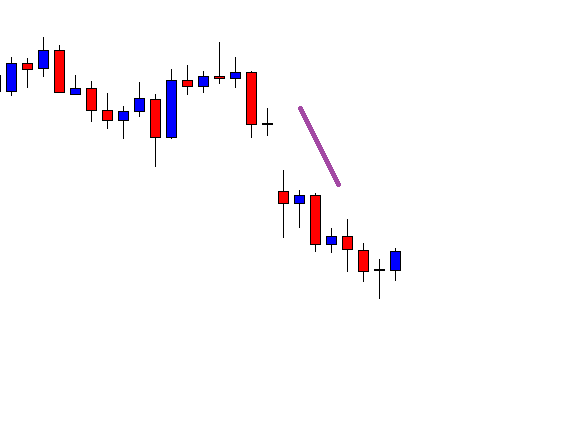
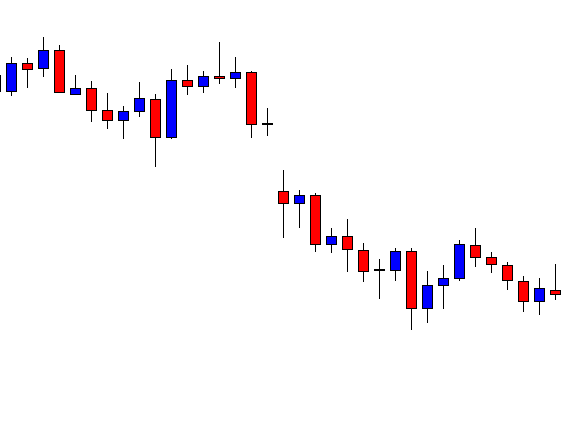
The trend starts with a bearish engulfing candle, which is a strong indication that the trend may sustain for a long time. The sellers are to wait for the price to consolidate and strong bearish reversal candle to go short on this chart. However, do not miss that the chart has a gap followed by trend continuation. It finds its support since it produces a doji candle followed by a bullish engulfing one.
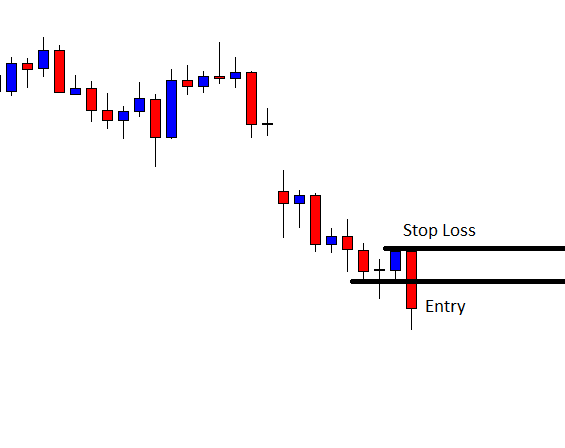
The price finds its resistance as well. Look at the last candle on the chart. It is a bearish engulfing candle closing well below the level of support. Usually, the sellers may trigger a short entry right after the last candle closes in such price action. It is not a usual chart since it has a gap. Let us assume we have triggered a short entry here.
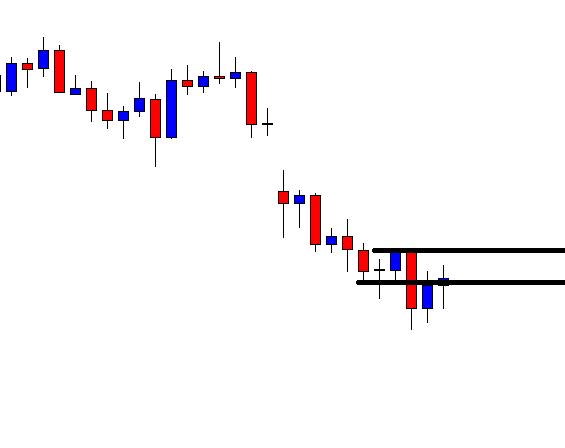
The next candle comes out as an inside bar bullish candle. The last candle comes out as a doji candle closing right at the breakout level. The bear still has control.

The last candle on this chart breaches through the level of stop loss. The trade does not go according to the sellers’ plan. The trend initiating and the breakout candle gets a 10 on 10. However, it gets us a loss. Do not forget this could happen any time with any trade setup. With this chart, something works against price action traders in both buying and selling. Can you guess what that is? Yes, it is the ‘Gap.’ Let us proceed to the next chart. It may create more drama.

It produces a spinning top. The buyers may think that they have a chance to take control next if it produces the next candle as a bullish engulfing candle.
It does not. It continues heading towards the South again at a slower pace. A chart with a big gap may act weird like this. Thus, it is best to avoid taking entry on a chart with a big gap.