In today’s lesson, we are going to demonstrate an example of an H4 chart offering entry after consolidation. The price does not head towards the breakout direction after triggering the entry as expected. It is Friday and the market is going to close. The question is whether we hold the position during the weekend or close the position. Let us find this out.

This is an H4 chart. The chart shows that the price heads towards the North with good bullish momentum. The last candle comes out as a bearish inside bar. The chart belongs to the buyers. The price may make a bearish reversal from here. The sellers must wait to get a strong bearish reversal pattern to go short in the pair.

The chart produces another bearish candle followed by a doji candle. The buyers may wait for the price to make a breakout at the wave’s highest high to go long in the pair.
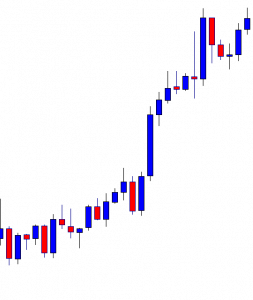
The price heads towards the North but does not make a bullish breakout. If the chart produces a bearish reversal candle around the level, it may get bearish. On the other hand, the buyers may still be hopeful that they get a bullish breakout to push the price towards the North further.
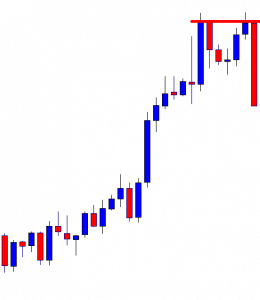
The chart produces a bearish engulfing candle right at the double top resistance. It makes a breakout at the neckline as well. Thus, the sellers may keep their eyes on the chart to go short and drive the price towards the South.
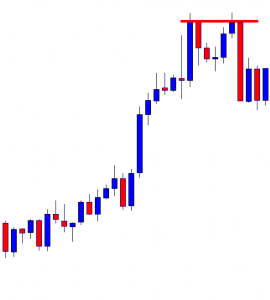
The price consolidates for a while. It produces a bearish reversal candle, but it does not make a bearish breakout to offer a short entry. The last candle comes out as a bullish candle. Both the buyers and the sellers must wait and let the price decide to give them a direction.
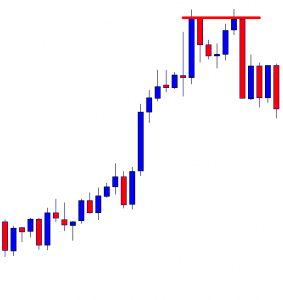
The chart produces a bearish engulfing candle closing well below consolidation support. The sellers may trigger a short entry right after the last candle closes by setting take profit with 1R. Let us proceed to the next chart to find out how the trade goes.
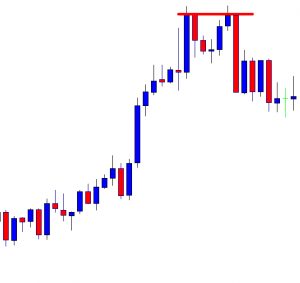
The price consolidates again. The chart upon producing a bearish engulfing candle at a double top resistance and getting consolidation, it does not move towards the trend’s direction. The sellers do not expect that. However, this is how the market goes. The market is going to close within three hours. Do the sellers close the position?
It is an H4 chart. If it were other intraday charts such as the H1, 15 M, 5M, we may close the position. In this case, the reversal candle is an engulfing candle; the reversal pattern is a double top; the price consolidates accordingly, and the signal candle comes out as a bearish engulfing candle as well. Thus, considering these factors the sellers may hold the position.


