Forex traders often struggle with spikes on their trading charts. The Line chart does not show spikes, but Candlestick Chart does. Price action traders usually use candlestick charts as one of their weapons to trade effectively. Thus, they face this problem every now and then. There is no sure method confirming which spikes are to be ignored, and which are not to be ignored. We have to be sensible about that. In today’s lesson, we find out a kind of spikes that are not to be ignored. Let us get started.
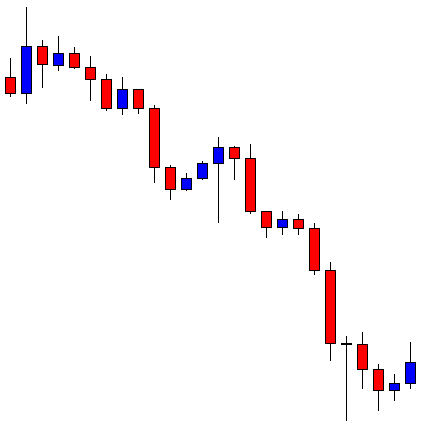
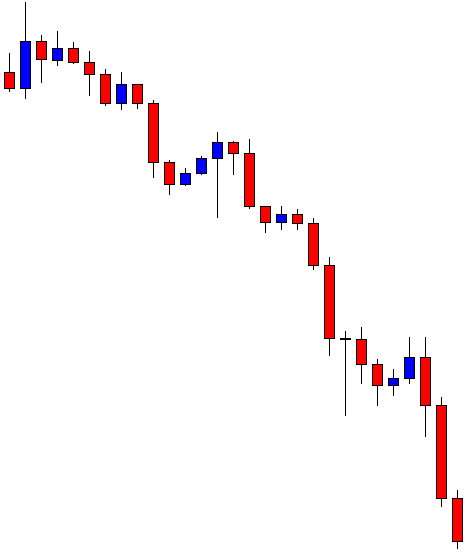
The price heads towards the South with good bearish momentum. It finds its support and produces a bullish reversal candle. The last candle comes out as a bullish candle as well. The sellers are to wait for a bearish reversal candle to go short in this chart.
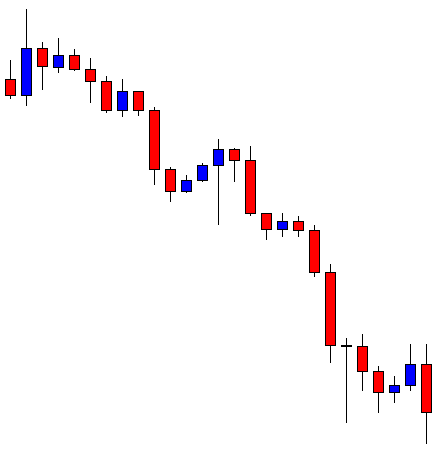
Here comes the bearish reversal candle that the sellers wait in such price action. We have not drawn any resistance line. If we closely observe, we find that the last two candles’ bodies suggest a line of resistance. Candles’ bodies play a significant role in determining the support/resistance line. Let us draw a line of resistance here.
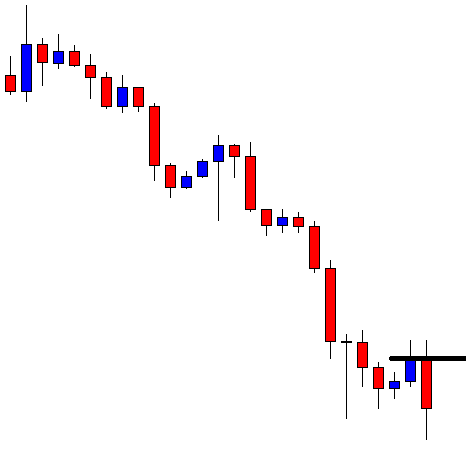
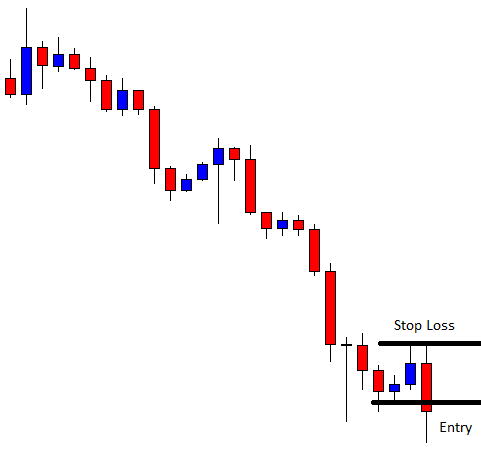
Here it is. The combination of the last two candles and their bodies suggests that we may draw a line right above their bodies. In most cases, we are to do this. However, the last two spikes have something more to think about. If we closely look, we find that the last two spikes are lined up. They have had their rejection at the same level. This means that the line is significant, which must not be ignored. Thus, if we want to take entry here, we may count the line above as the level of resistance. Let us have a look at the chart below with more drawn lines.
Look at the Stop Loss level. To be safe, we may not ignore such levels, where the price gets rejected multiple times. The candles may end up having spikes, but these spikes shall be counted to determine our stop loss, take profit, and breakout level. Let us not proceed to find out how the entry goes.
The trade setup works well for the traders. The price heads towards the South with more bearish pressure. It gets 1R to the sellers in a hurry. Now many of us may say the price never goes back to the level. In 80% of cases, the price does not go back near to the resistance. In the rest of the 20% cases, it may go. That is when we are to take an unnecessary loss. As they say, it is better to be safe than sorry. Let us be safe with spikes like these.


