Introduction
Most retail traders have a greedy mentality, so they always prefer to trade the breakouts to catch the home run. They believe in considerable gains in huge moves. Trading smaller moves are something they are not interested in because it takes a lot of work and time to scan the market. The problem with breakout trading is that the majority of the breakouts fail. To make consistent money from the market, professionals always prefers to fade the breakout. The fading breakout essentially means trading a false breakout.
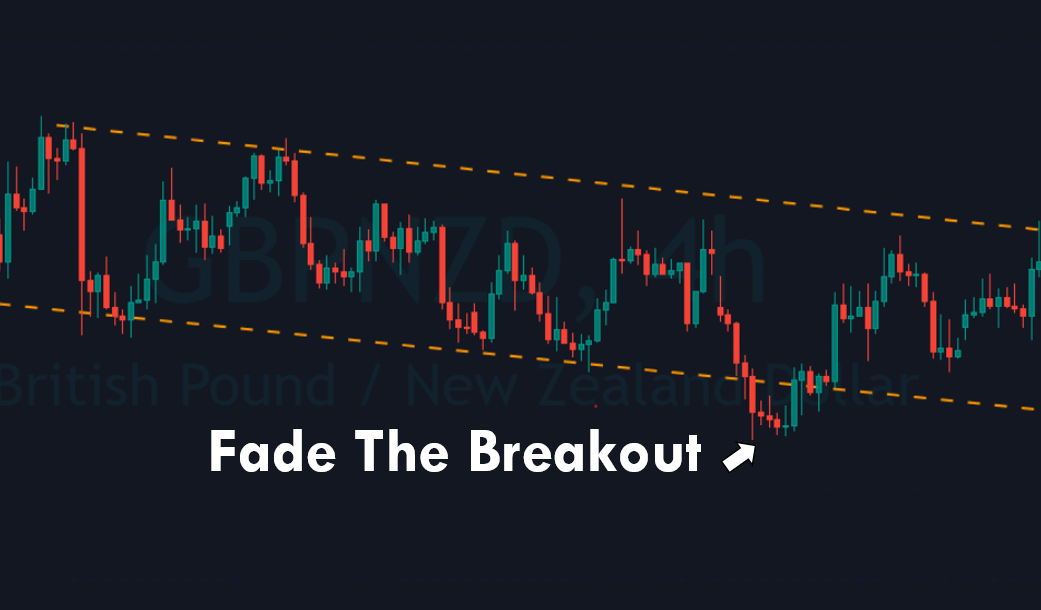
Fading Breakouts = Successfully trading the False Breakout
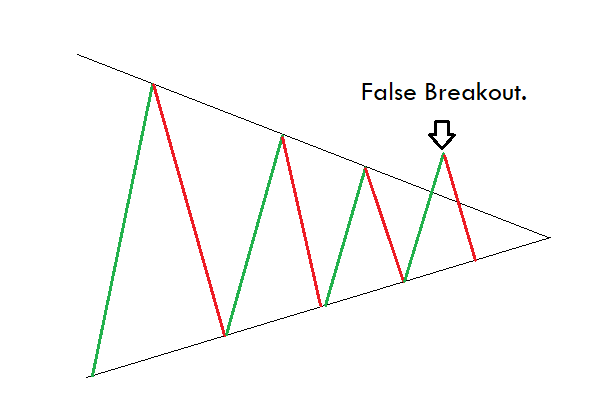
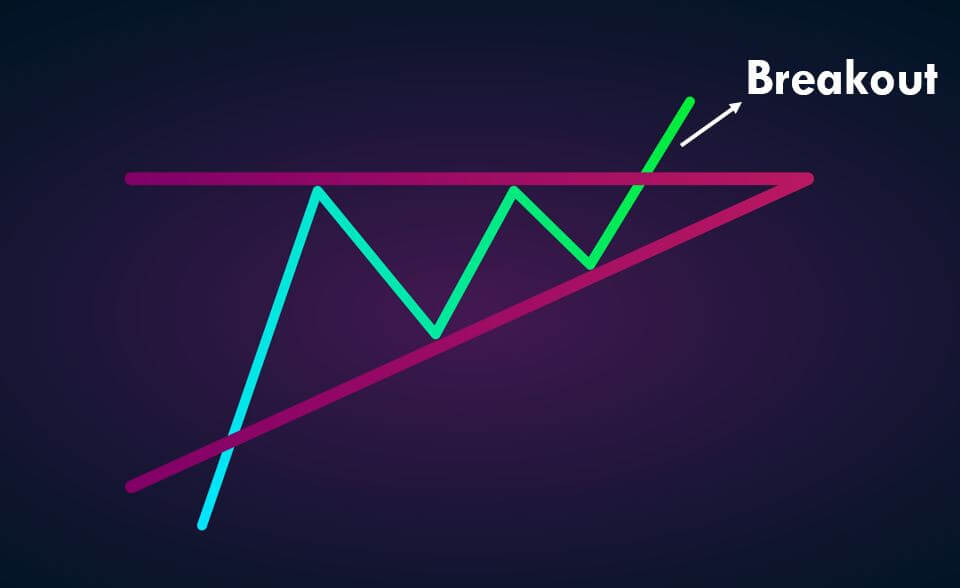
The image above represents the formation of a false breakout, which gives us a potential sell opportunity. Experienced industrial traders are always interested in fading the breakout because they know the crux of it. Most of the time, when the price action attempts to fade the breakout, it fails and closes back inside any of the major levels. Therefore, fading the breakout is always a smarter move than avoiding it.
Trading Strategies
Always remember that fading the breakout is a short term strategy. Therefore, please do not expect a home run while taking these trades. What we are doing here is that we are trading the false breakout moves. During the fight between the buyers and sellers, we will witness the initial moves, often failing to give the breakouts.
We are just taking advantage of these exact moves. In the end, one party always wins, and we will eventually get the breakout on the price chart. Instead of waiting for the home run, it is always advisable to trade some smaller moves, and if the market allows the home run, we must definitely go for it.
Buy Trade
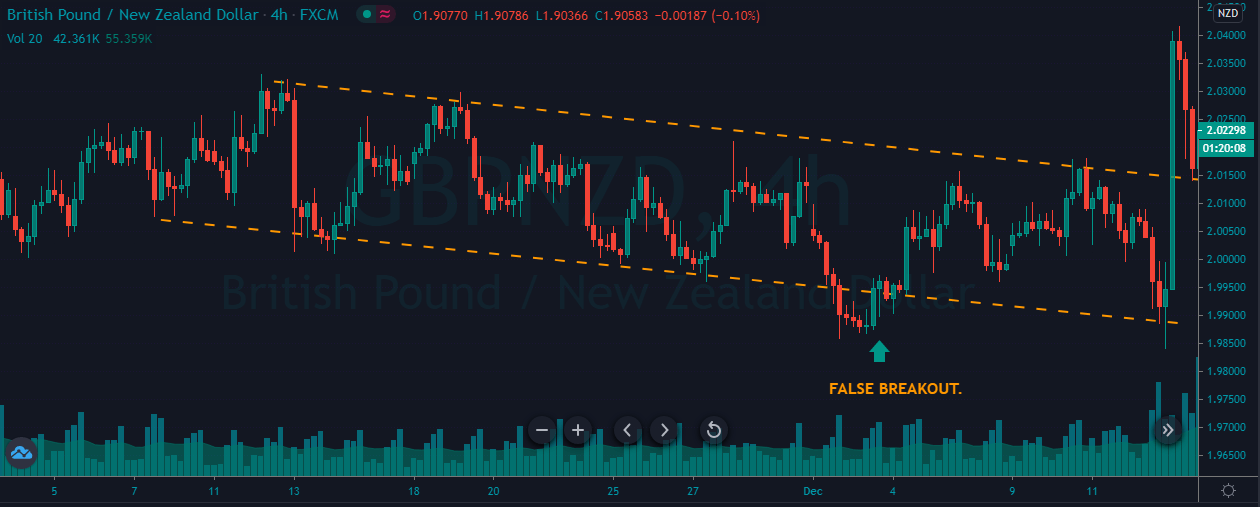
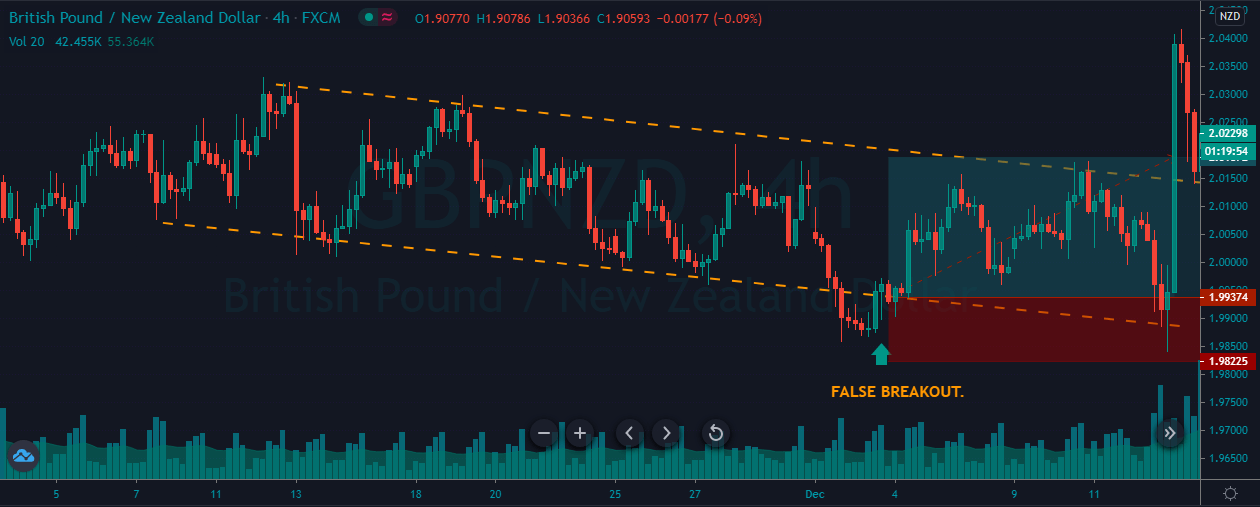
The price chart below represents a false breakout in the GBP/NZD Forex pair.
As we can see in the below chart, where the price action breaks below the channel, it came back right into the channel, indicating a false breakout. After the breakout, we can see the price action holding at the support zone. We decided to go long after we saw the red candles struggling to go down and when a clear big Green Candle is formed. Instead of being disappointed that the breakout didn’t happen to take the trade, these small trades inside the major areas come handy to make money.
Sell Trade
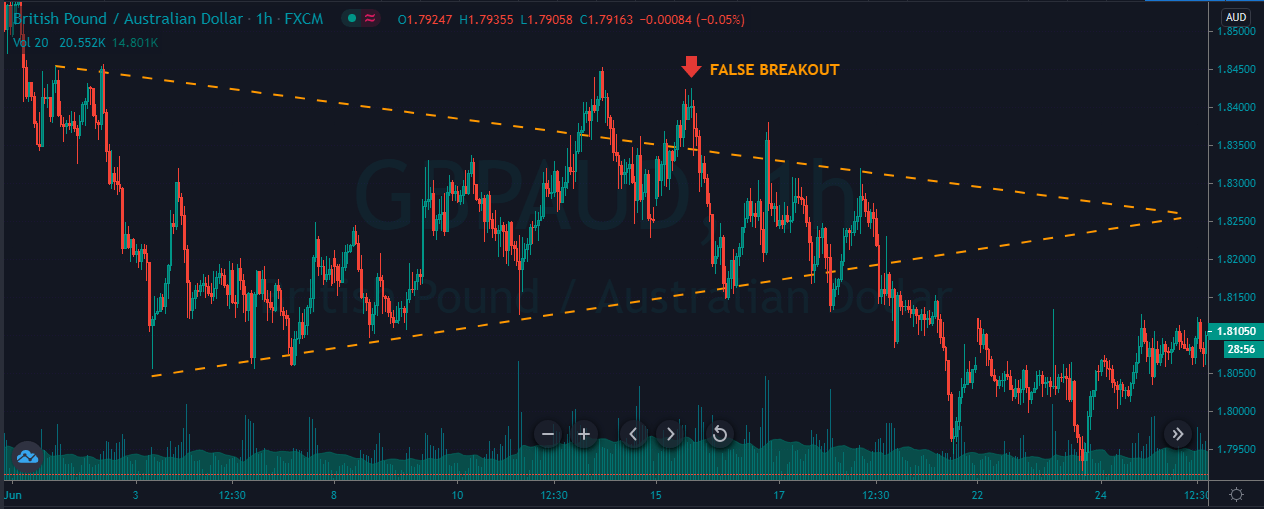
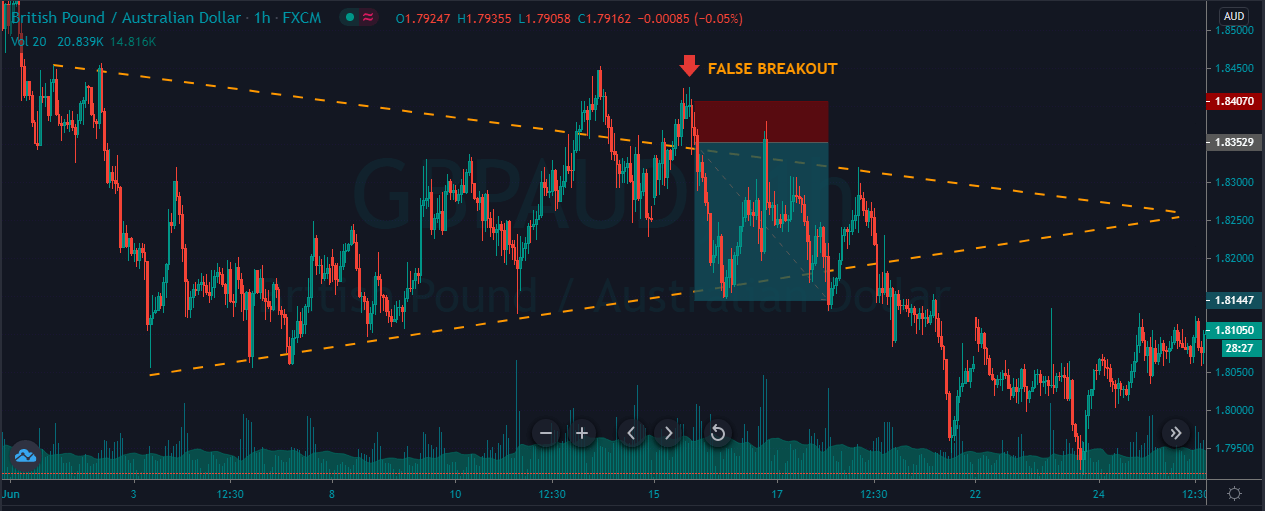
The image below represents the formation of a false breakout in the GBP/AUD Forex pair.
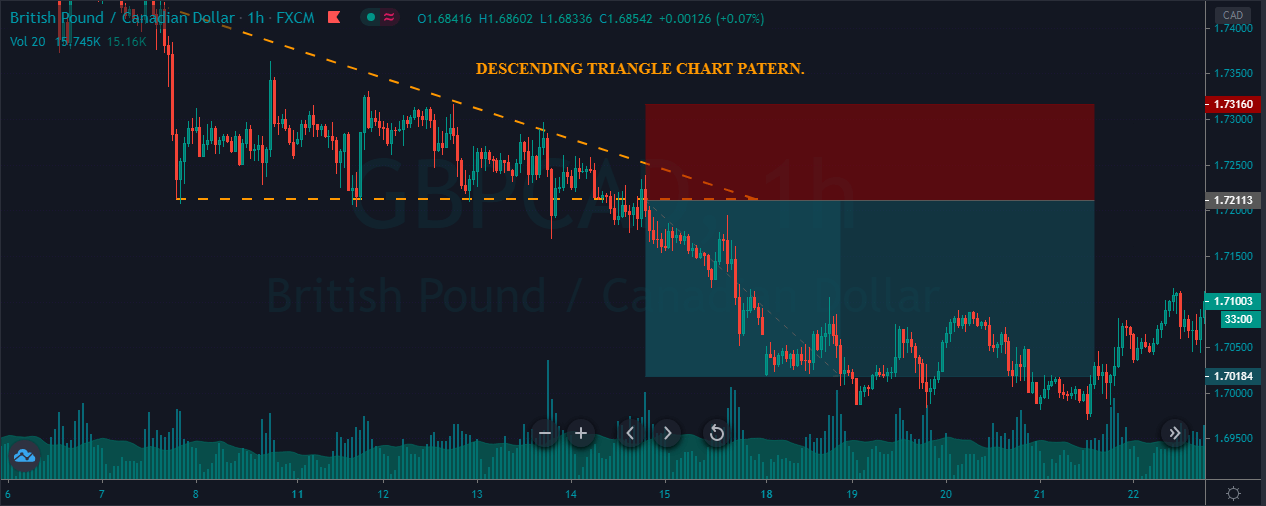
As you can see, the image below represents our entry, exit, and stop-loss in this pair. When the price failed to go above the major level, it is an indication for us to take a trade inside the triangle. Therefore, when the price came back, we took the sell entry to the most recent support area. The stops above the entry should be good enough.
Another Sell Trade
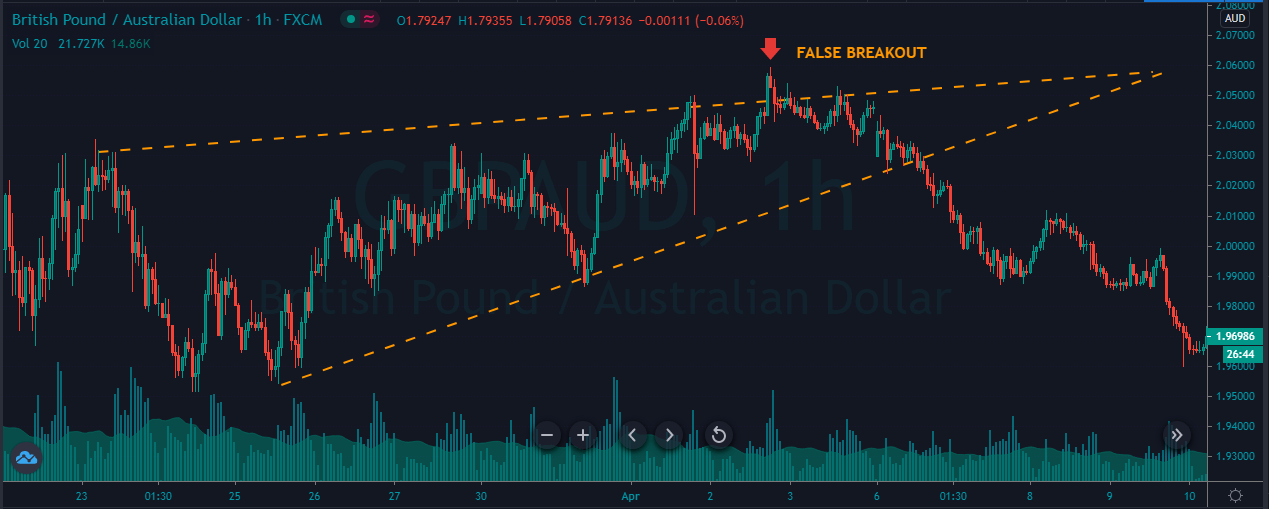
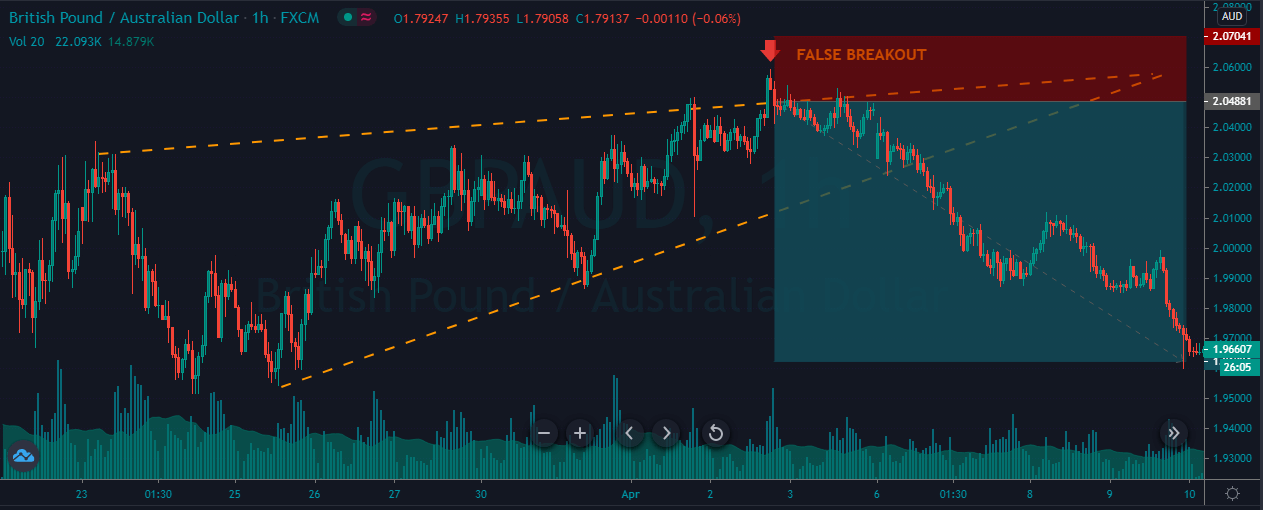
The image below represents a false breakout in the GBP/AUD Forex pair.
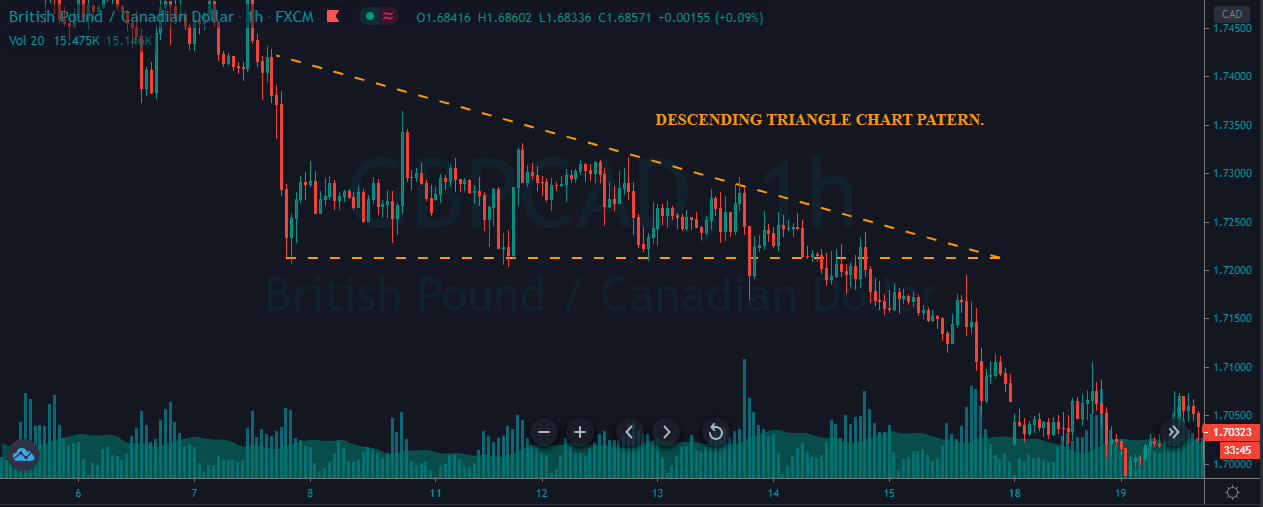
As you can see, when the prices failed to break the trend line and started to hold below the trend line, it was a sign that it is a failed breakout. It also indicates that the sellers are going to take over the market when we look-in the price action perspective. In this trade, we choose not to close our position at the most recent higher low. Instead, we went for the actual breakout. The holds below the support area is an additional confirmation for us to go to the most recent lower low area.
That’s about Fading the breakout, and we hope you find this lesson informative. Let us know if you have any questions in the comments below. Cheers!

