Categories
Forex Course

148. How To Fade The Breakout By Successfully Trading It?

Introduction

Most retail traders have a greedy mentality, so they always prefer to trade the breakouts to catch the home run. They believe in considerable gains in huge moves. Trading smaller moves are something they are not interested in because it takes a lot of work and time to scan the market. The problem with breakout trading is that the majority of the breakouts fail. To make consistent money from the market, professionals always prefers to fade the breakout. The fading breakout essentially means trading a false breakout.

Fading Breakouts = Successfully trading the False Breakout
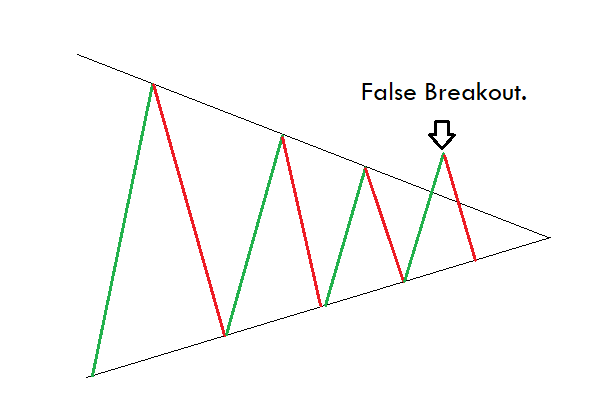
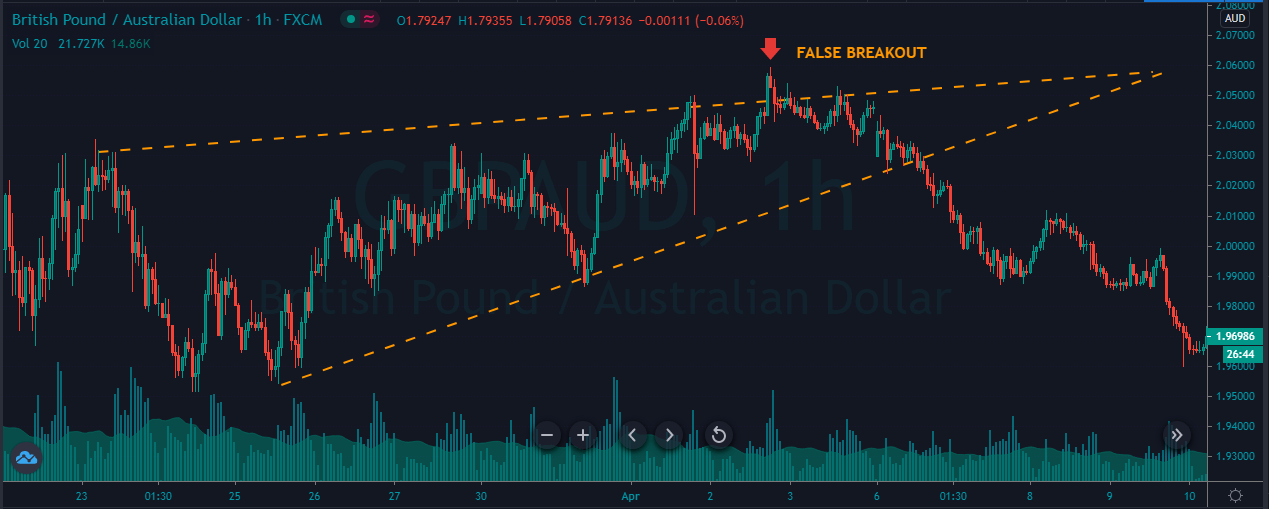
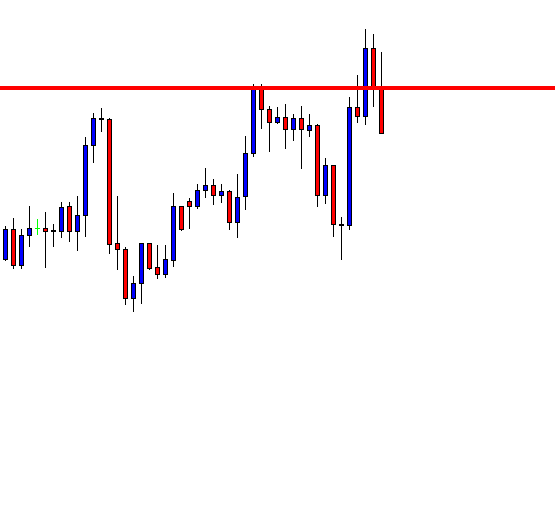
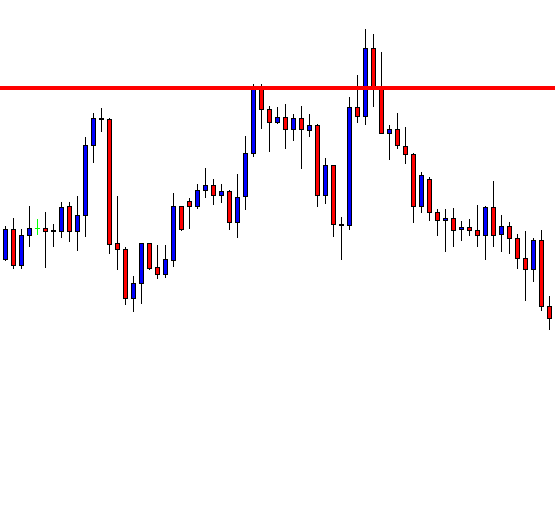
The image above represents the formation of a false breakout, which gives us a potential sell opportunity. Experienced industrial traders are always interested in fading the breakout because they know the crux of it. Most of the time, when the price action attempts to fade the breakout, it fails and closes back inside any of the major levels. Therefore, fading the breakout is always a smarter move than avoiding it.

Trading Strategies

Always remember that fading the breakout is a short term strategy. Therefore, please do not expect a home run while taking these trades. What we are doing here is that we are trading the false breakout moves. During the fight between the buyers and sellers, we will witness the initial moves, often failing to give the breakouts.

We are just taking advantage of these exact moves. In the end, one party always wins, and we will eventually get the breakout on the price chart. Instead of waiting for the home run, it is always advisable to trade some smaller moves, and if the market allows the home run, we must definitely go for it.

Buy Trade

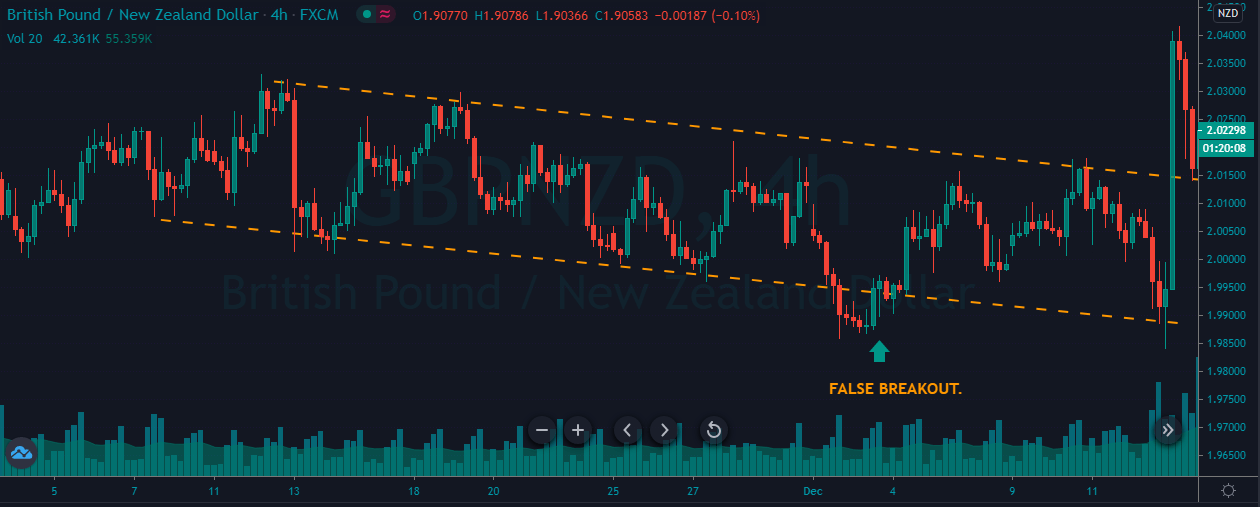
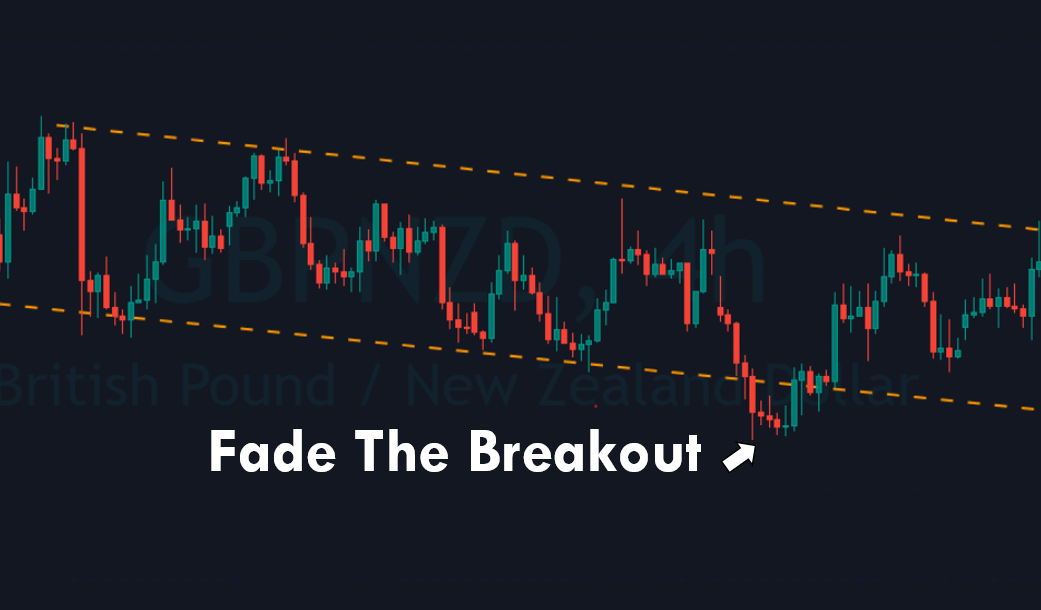
The price chart below represents a false breakout in the GBP/NZD Forex pair.

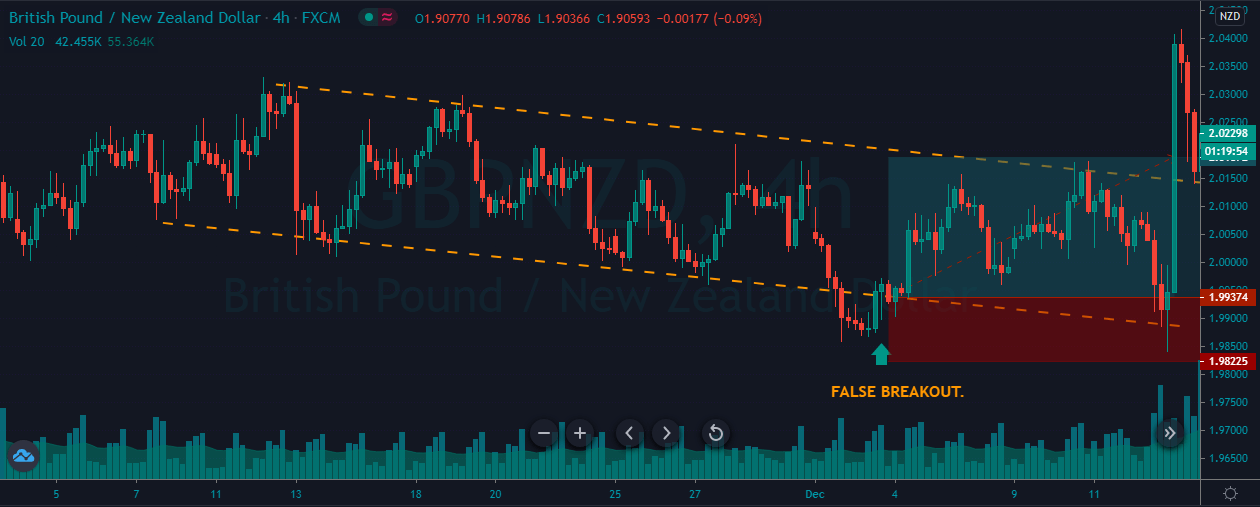
As we can see in the below chart, where the price action breaks below the channel, it came back right into the channel, indicating a false breakout. After the breakout, we can see the price action holding at the support zone. We decided to go long after we saw the red candles struggling to go down and when a clear big Green Candle is formed. Instead of being disappointed that the breakout didn’t happen to take the trade, these small trades inside the major areas come handy to make money.

Sell Trade

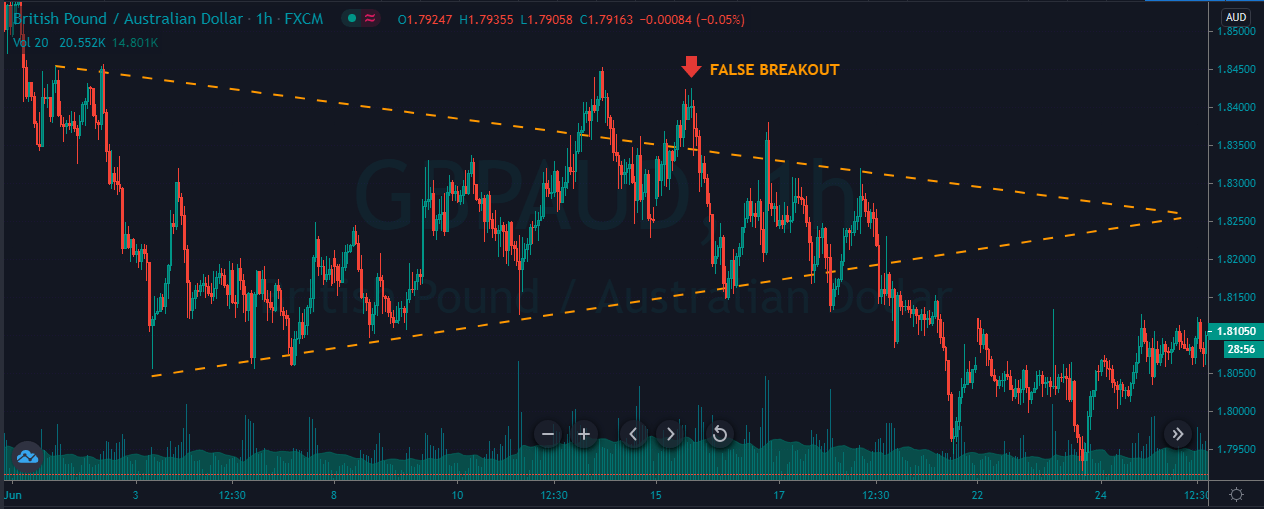
The image below represents the formation of a false breakout in the GBP/AUD Forex pair.

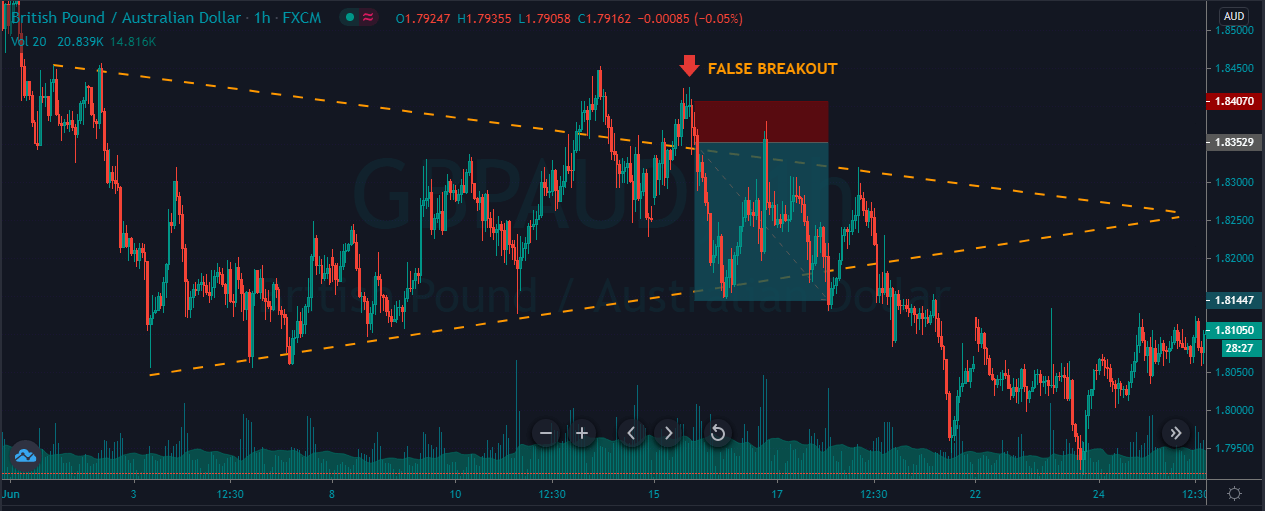
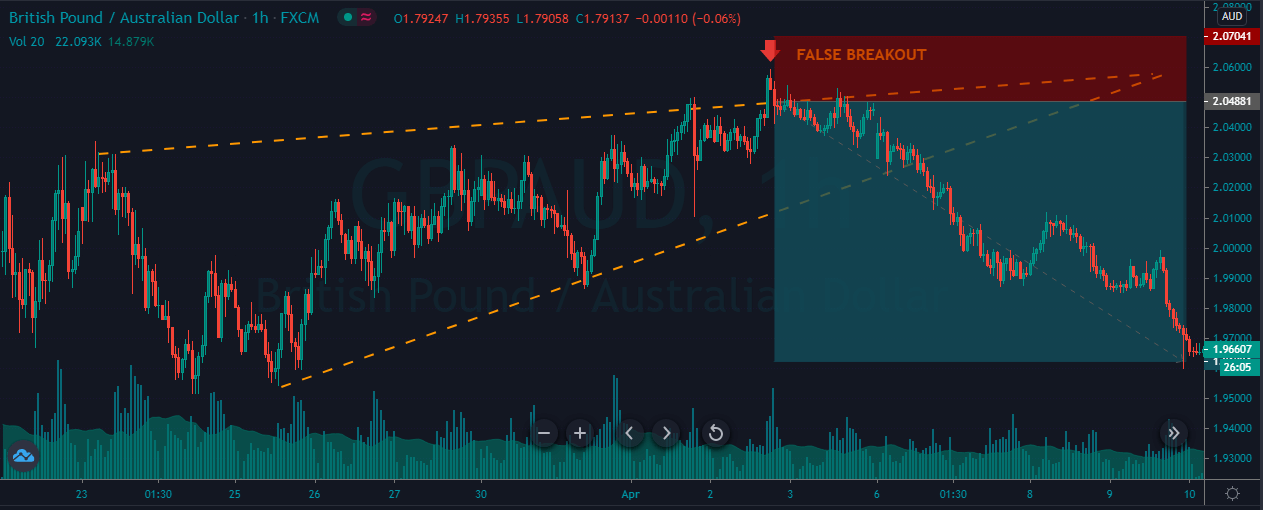
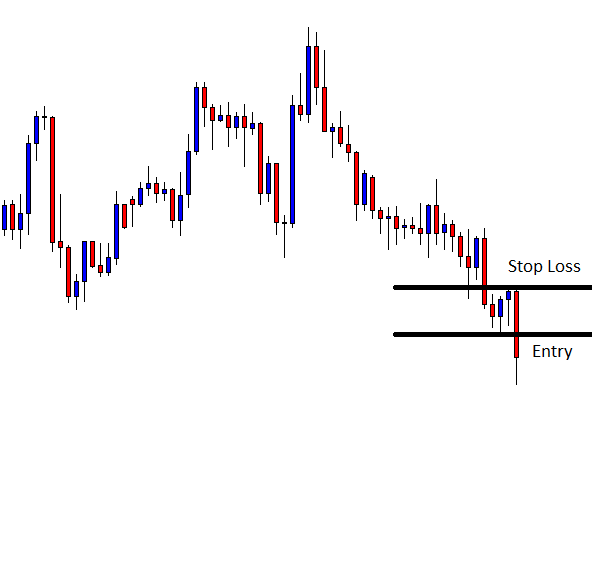
As you can see, the image below represents our entry, exit, and stop-loss in this pair. When the price failed to go above the major level, it is an indication for us to take a trade inside the triangle. Therefore, when the price came back, we took the sell entry to the most recent support area. The stops above the entry should be good enough.

Another Sell Trade

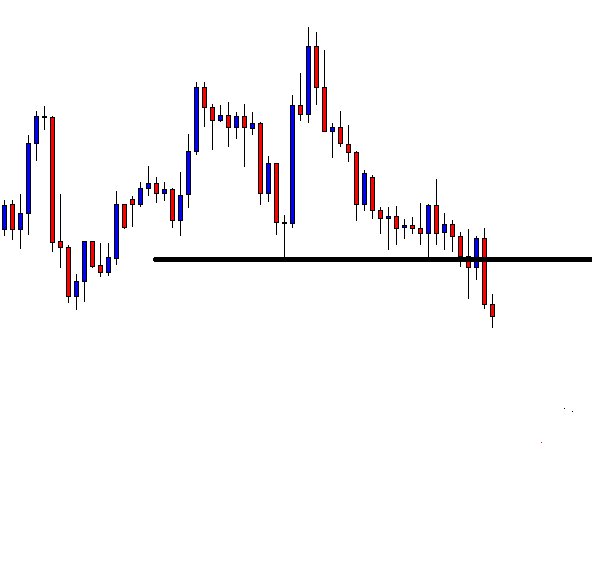
The image below represents a false breakout in the GBP/AUD Forex pair.

As you can see, when the prices failed to break the trend line and started to hold below the trend line, it was a sign that it is a failed breakout. It also indicates that the sellers are going to take over the market when we look-in the price action perspective. In this trade, we choose not to close our position at the most recent higher low. Instead, we went for the actual breakout. The holds below the support area is an additional confirmation for us to go to the most recent lower low area.

That’s about Fading the breakout, and we hope you find this lesson informative. Let us know if you have any questions in the comments below. Cheers!

Categories
Forex Basic Strategies Forex Trading Strategies

Trading False Breakouts Like a Professional Forex Trader

Introduction

Often there are times in the market when the price breaks a certain significant level, and most of the novice traders immediately jump into the market. But, suddenly, the price reverts quickly, stopping out these traders or putting them in a losing position. Most of the experienced traders would have exited their positions when they realized they are trapped by the big whales like industry or institutional traders.

But beginner traders often become the victims of these false breakouts, and it affects their psychology as well. They will start doubting their trading strategies, and the fear element will surpass their confidence. Instead of falling into the negative state of mind, traders should learn how to use these false breakouts to their advantage so that they can profit from it. In this article, let’s discuss how to trade the false breakouts properly.

Most of the traders often consider false breakouts as a negative thing in the market. The general perception is that, by trading the false breakouts, they are taking the unnecessary risk, or it is not the correct way to trade. Some traders also believe that simple breakouts are more comfortable to trade. It is true, but simple breakouts won’t provide a great risk-reward, and also, it is not a consistent way to trade the market. On the other hand, successful & experienced traders see the false breakout logically and consider it as an opportunity to make some quick profits.

There are a lot of ways to trade false breakouts. Some traders trade them in conjunction with indicators, and some use it with trend lines and support resistance. In this strategy, we will show you the most appropriate way of trading false breakouts.

Trading the false breakout by using the major S&R levels

False breakouts occur in all types of markets, such as Forex, Stocks, Futures, and Options. They also occur in all kinds of market conditions. But the critical thing to remember is that every false break out is not worthy enough to trade. Always consider trading the false breakouts by following the trend of the market. That is, if the trend is up, look for the buy-side false breakout and in a downtrend, look for sell-side false breakouts.

Step 1 – Find the trend of the higher timeframe

This step is simple yet crucial because we need to confirm the trend of the market. Keep in mind that most of the lower timeframes always follow the direction of the higher timeframe. To explain this strategy, we are examining the uptrend of the GBP/USD forex pair.

Step 2 – Look for the significant S&R in the lower timeframe

Most of the false breakouts occur near the support and resistance level. The reason brokers and market movers use these levels is to manipulate the market as is these areas act as a significant supply-demand zone. This makes it easier for the bigger players to fill more orders.

Step 3 – Look for the false breakouts at the S&R level

As we know by now, most of the false breakouts happen at major support resistance area. A trader can set the alarm on the price chart to see when the price action is at a major level. When the price breaks these levels, wait for the false breakout to trade the market.

In the below image, GBP/USD was in an uptrend. On 15 Min chart during the pullback phase, prices started holding at the support area. On 29th Nov, look at the first circle where the price action prints the false breakout. But there is no way to trade that breakout. Because after that, the price action dipped below the support area, which is a sign of a false breakout. So it is an indication to go long on the GBP/USD forex pair.

Step 4 – Entry, Stop loss and Take profit

A trader should be entering the market when the price action holds at the significant support resistance area as it confirms that the levels are active to hold the prices. \

Take profit placement depends on your trading style. If you are an intraday trader, we suggest you close your position at a recent high. If you are a swing trader, look for another false breakout to load more positions. You can also use the recent high or any support resistance area of the higher timeframe to close all of your positions.

Most of the false breakouts are sure shot trades in the market. Place the stop loss just below the recent low, or at the closing of the most recent candle. If you are a conservative trader, then put stop loss bit spacious to your entry point.

In the below image, we have placed the stop loss just below the closing of the recent candle, and we have captured the 4R trade in the market.

Bottom line

It is essential to learn the logic and psychology behind any false breakout. Most of the time, the risk is small in these types of trades, and it is important not to be greedy while placing more extended targets. If there is no momentum in the market, close your positions, and if the trend is healthy to go for longer moves. You can still trade the regular breakouts, but throw relatively less money when compared to the false breakout trades. Also, make sure to practice trading false breakouts in a demo account until you master it. We hope you liked this article. Cheers!

Categories
Forex Basics Forex Price-Action Strategies

A Story of a False Bullish Breakout

In today’s lesson, we are going to demonstrate an example of a short entry that is derived from a false breakout. It contains two lessons. Let us get started.

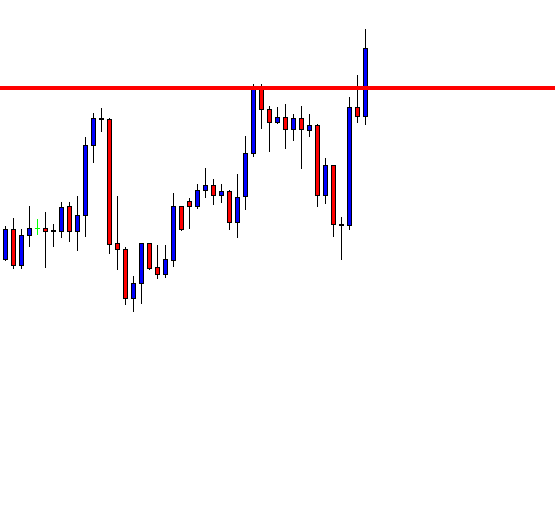
The price heads towards the North and makes an upside breakout. The buyers are to keep their eyes on the pair to go long upon consolidation and bullish reversal candle at the breakout level. Let us find out what happens next.

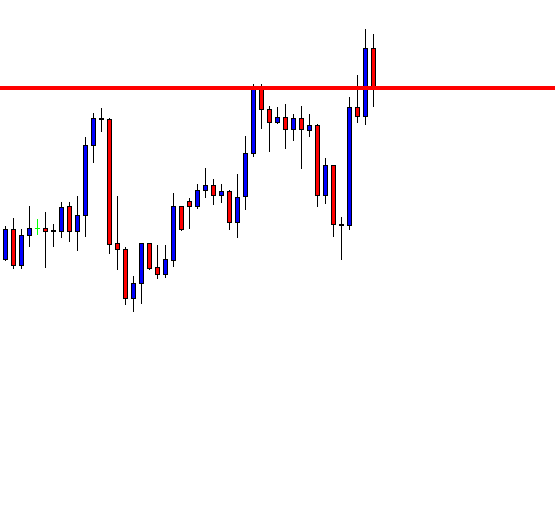
Wow! This is a copybook corrective candle, which closes right at the breakout level. A bullish reversal candle followed by a breakout at the highest high would get the buyers engaged in buying the pair.

The buyers might not have even thought about it. They are to let the sellers dominate in the pair, while sellers should wait for the breakout confirmation and a bearish reversal candle to go short on the pair. However, they have to calculate that the last swing low is not too far.

The price keeps going towards the South without having apposite consolidation. It consolidates just before the support. The price has been bearish but has not offered any short entry on this chart. Meanwhile, it has made another bearish breakout. The sellers shall be hopeful again. Look at the chart below.

This is an explicit breakout, and the next candle confirms it. The consolidation and the price breakout at the lowest low would be a signal to go short. Let see what the price does this time.

Price action traders have been waiting for this. The price consolidates and makes another breakout. By setting Stop Loss above the resistance, an entry may be triggered right after the last candle closes.

This is how it goes. The price produces consecutive four bearish candles. The very last candle comes out as an Inside Bar. Most traders may come out with their profit; some may still hold their trade by locking some profit.

 Lessons

We learned two lessons from here

  1. False breakout usually drives the price towards the opposite direction.
  2. Risk-reward is always a factor. It does not offer an entry within the first support since risk-reward is not lucrative. It offers an entry on the second breakout, where there is not support nearby.

The Bottom Line

In the beginning, it may sound too many things to remember in price action trading. It is right to some extent. However, if we practice hard, study with the recent price behavior on the chart with as many pairs as we can, surely it will get easy for us.