Categories
Forex Elliott Wave

Analyzing the Triangle Pattern – Intermediate Level – Part 1

The triangle is a corrective pattern that has five internal segments. In this educational article, we will review how to analyze the triangle formation.

Triangles and their Characteristics

Within the set of corrective structures defined by R.N. Elliott, triangle formations are more complex to analyze compared to flat and zigzag patterns. This complexity occurs because there is no specific time span that marks the end of this structure.

Despite the complexity of the triangles, it is the most common Elliott pattern to find in the real market. The knowledge of this formation will help wave analysts to understand the price position within the market.

Construction Rules

The construction rules defined for the triangle pattern are detailed as follow:

– Triangles have five internal waves, regardless of the complexity of the inner segments.
– A complete three-wave corrective structure builds each part that makes up the triangle.
– The triangle can have a bullish or bearish inclination. However, its internal structure should not change.
– The triangle has six reference points of the same degree, the origin of wave A, and the end of waves A, B, C, D, and E. From these six extremes, the wave analyst should only channel four points through the contraction lines. The points to consider are the end of wave A with the end of wave C and the end of wave B with the end of wave D.
– The base-line of the triangle is the line that joins the end of waves B and D, and its function is similar to the guideline that joins waves 2 and 4 in an impulsive wave.

The following figure represents the construction model of the triangle pattern.
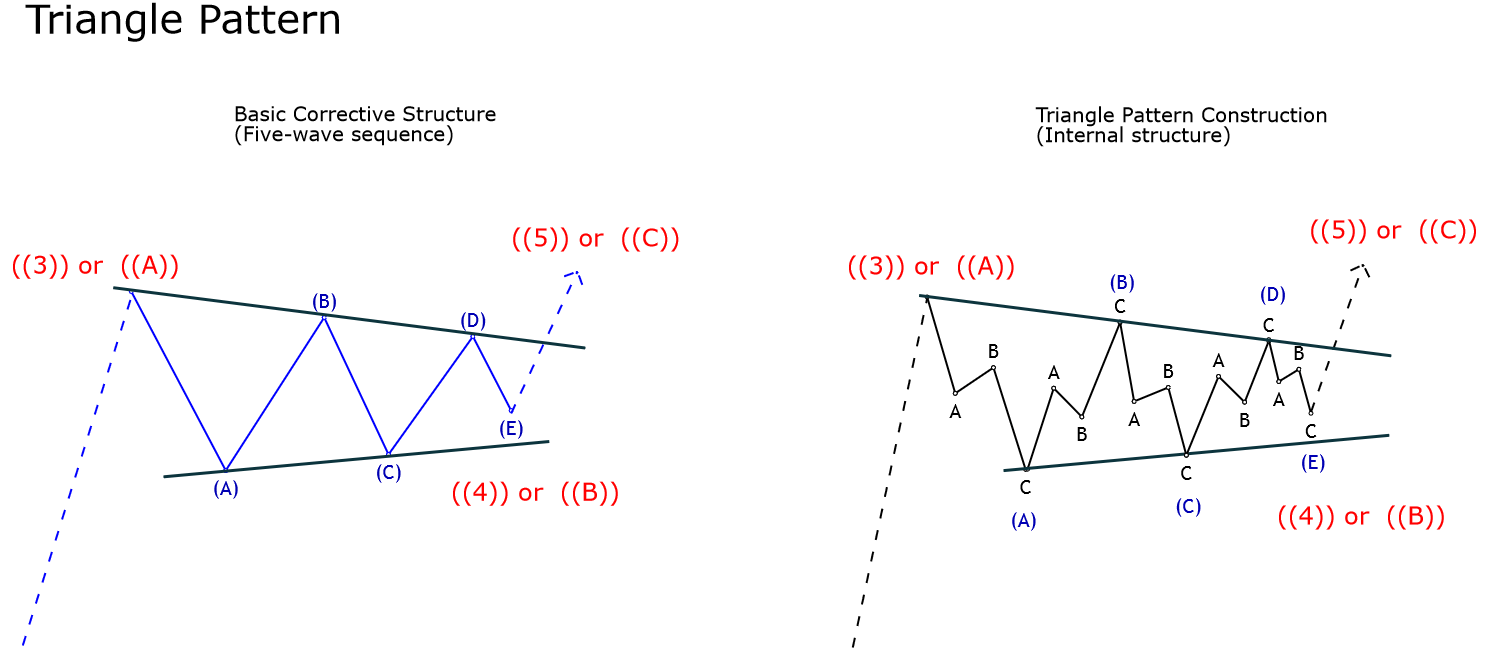
As can be noted, the triangle pattern tends to appear in a fourth wave or a wave B, in some exceptional cases, this pattern could appear in a second wave.

GBPUSD Consolidates in a Triangle Sequence

The next figure illustrates the GBPUSD pair in its 4-hour timeframe. In the chart, we observe that the Cable rallied since September 03rd when the price found its bottom at level 1.19589.

Once the GBPUSD pair moved in three waves identified in green, the fourth wave consolidated sideways, developing an expanding triangle.

The triangle pattern reveals the alternation principle in terms of time and price.

The GBPUSD pair alternated in terms of time being the triangle pattern more extended in comparison with the second wave. In the same way, the retracement developed by the second wave is sharp compared with the narrow correction realized by the fourth wave.

JP Morgan Consolidated in a Triangle Pattern

The chart below shows JP Morgan Chase & Co (JPM) in its log-scale 2-day timeframe. The ticker JPM developed a bullish impulsive sequence subdivided in five waves from early 2016 when the price found buyers at $52.50 per share.
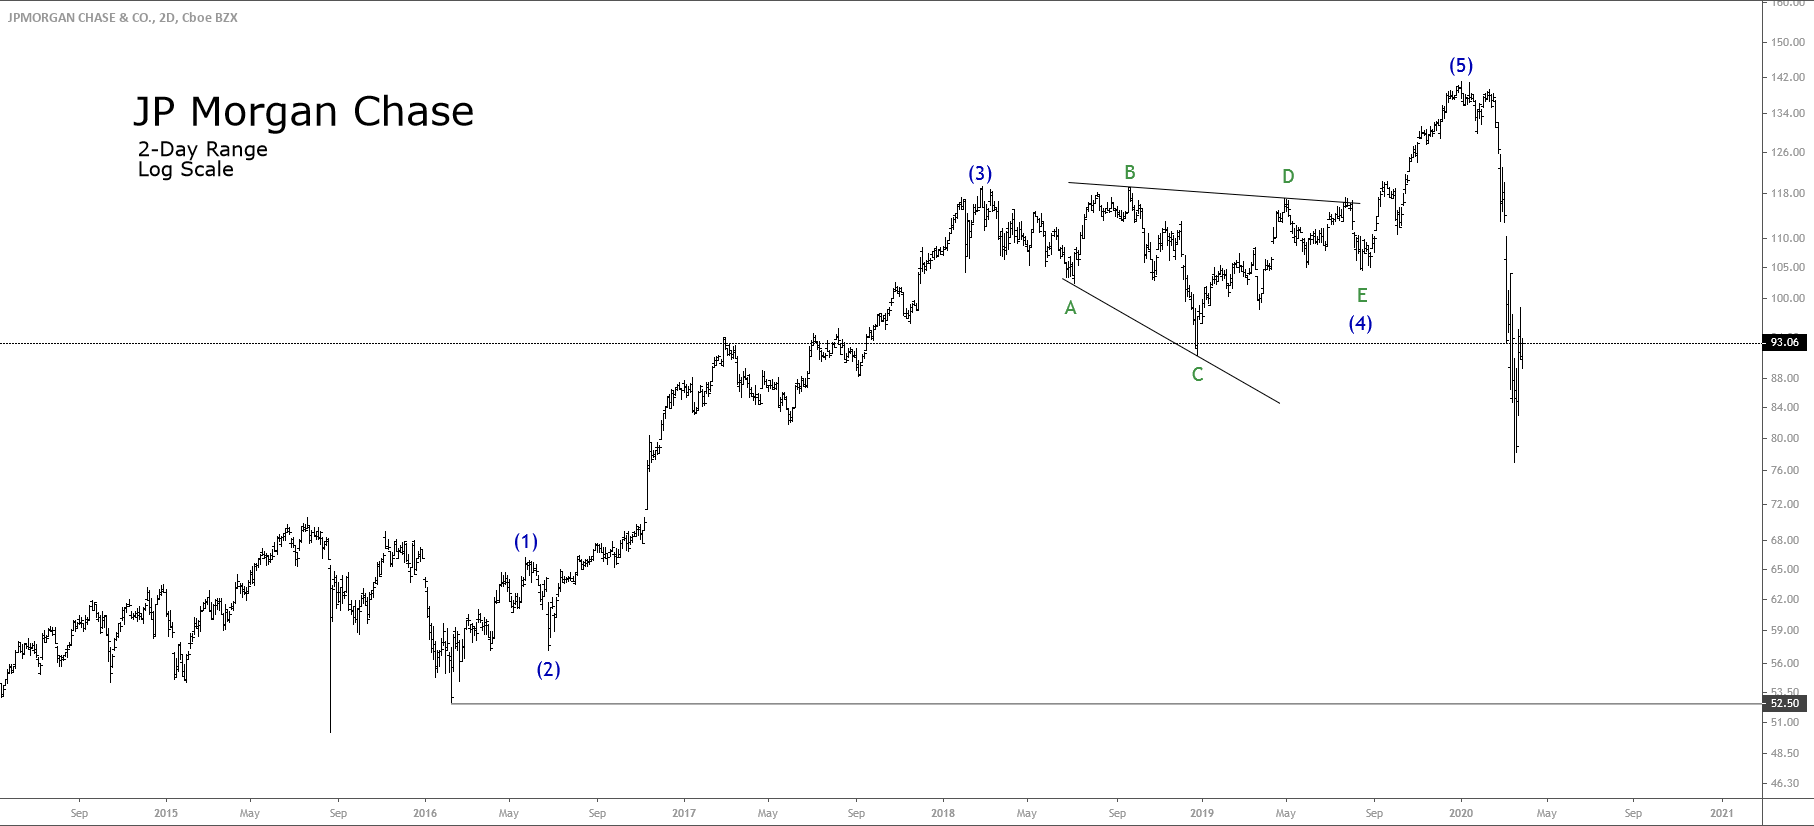
In the same way, the third wave that was formed corresponds to an extended wave, which makes us conclude that the first and fifth waves will not be extended, and they will be similar in terms of price, time, or both. In this case, both waves are identical in terms of time.

On the other hand, we observe that JPM consolidated developing an expanding triangle pattern with a slight bearish bias. Besides this structural bias, the internal sequence is respected by the price action.

Also, we distinguish the wide extension of the triangular sequence, which moved from late February 2018 until mid-August 2019, when JPM ended its internal wave E labeled in green.

Once JPM completed its fifth internal segment, the price action continued its previous bullish trend and soared to record highs at $141.10 per share.

Conclusions

From the cases analyzed, we can verify the Genn Neely’s affirmation that suggests that “the triangle pattern is a common formation that appears in the market.”

Also, we verified how the alternation principle works in the real market, while a corrective wave is simple, the other will be complex.

Finally, according to the examples reviewed, the triangle pattern could appear independently of the market analyzed,  as on currencies, stocks, indices, etc.

In the next article, we will review the different variations of the triangle pattern.

Suggested Reading

  • Neely, G.; Mastering Elliott Wave: Presenting the Neely Method; Windsor Books; 2nd Edition (1990).
Categories
Forex Elliott Wave

Trading the Elliott Wave Principle – Part 5

Triangles are the third fundamental Elliott wave corrective structure. In this educational article, we will review the guidelines to trade this pattern.

The basics

The triangle structure is a corrective formation with a 3-3-3-3-3 internal sequence. Triangles usually tend to appear in waves four and B.

In this formation, volume tends to decrease as the triangle progresses. Also, it characterizes by the balance between bull and bear traders.

The following figure illustrates the trading setup for a contracting triangle. The entry is triggered once the price action strikes and closes above the end of wave (D) labeled in black degree.


To place the potential targets, we can measure the Fibonacci projection from the origin of wave ((3)) or ((A)) labeled in red, and the lowest level of the triangle. The first target will be at 61.8%, and the second target at 100%.

The trading setup is invalid if the price pierces the wave (A) labeled in black degree.

Golden triangle

Gold, in its weekly chart, shows the guideline of an Elliott wave contracting triangle in progress. The bullish sequence starts on November 30, 2015, once the yellow metal found buyers at $1,046.54 per ounce.

The golden metal made the first rally until early July 2016 at $1,375.15 per ounce. After this move, Gold made an up and down sideways movement till late April 2019.

Now that we have identified the start of a price cycle, we have to face the question, “do I recognize an Elliott wave pattern?”

In this case, we start from the most straightforward formation, which could correspond to a Contracting Triangle.


Now that we have recognized a wave pattern, we advance to the second stage, which is to define our trading plan. Following the triangle setup guideline, we have to expect the breakout of wave (D) labeled in black at $1,346.75.

The theory says that the first profit target must be at 61.8% of the Fibonacci projection. However, this level is under the entry-level. In this case, we place the first profit target at the 100% level at $1,453.78. The second profit target will be at the 127.2% level at $1,543.80 per ounce.

The invalidation level is theoretically below the wave (A) labeled in the black degree at $1,122.10.

Now that we have defined the trading plan, the third stage is to manage the trade and risk. The first step is to reduce the risk. In this case, we move the protective stop from the theoretical invalidation level to the end of the wave (E) at $1,266.39, as shown in the next figure.


Once that we have reduced the risk and the trade advances, the trader must eradicate the risk. In this example, after Gold reached the first profit target at $1,453.78, we move the protective stop to the entry-level.

As an alternative to eliminate the risk, the protective stop could be placed considering the entry-level plus the trade costs, for example, commission costs and swap.


The last step of the trade management, before the trade reaches the final profit target, is to protect open profits. This last stage depends on the criteria of each trader.

Categories
Forex Elliott Wave

Fundamentals of Elliott Wave Theory – Part 2

Waves develop in two classes, impulses and corrections. Impulsive movements are characterized by having a five-wave structure. Corrective waves, on the other hand, growth creating a three-wave structure. In this article, we will introduce the concept of motive waves, corrective waves, and cycles.

Motive waves

Motive waves receive this denomination because they create movement, or “impulse” to the price action, as it follows a trend. In the following figure examining the case of a bull market, waves 1, 3 and 5, are impulsive waves. This structure is analogous for a bear market.


Corrective waves

Corrective waves, as the name implies, are characterized by pushing back the price of the dominant trend. From the previous figure, waves 2 and 4 correspond to the corrective waves.

Cycle concept

As we have seen previously, a wave is composed of five waves, and a complete cycle is composed of eight waves, an impulsive part and a corrective part. For convenience in the identification process, we will label motive waves with numbers and corrective waves with letters. Later we will see the usefulness of wave identification to understand the stage in which the market under study is.


When an eight-wave cycle is completed, a new cycle of the same degree begins, as shown in the following figure. This formation generates a five waves sequence of a higher degree. At the moment, you should not be worried about the identification symbols. Elliott defined the labels and should be understood as a tool to help in the study, and not an objective in itself.


Recognizing this structure is essential to understanding the nature of the wave theory.