
The EURCAD cross reveals a mid-term consolidation formation that looks like an incomplete triangle pattern. This pattern continues in development since March 18th, when the price topped at 1.59914. In this context, this chartist pattern suggests the continuation of the previous movement, in the

The following 12-hour chart depicts the EURCAD action consolidating after a sharp rally, the cross began on February 19th when it found fresh buyers on 1.42637 and ended on 1.59914 on March 18th.
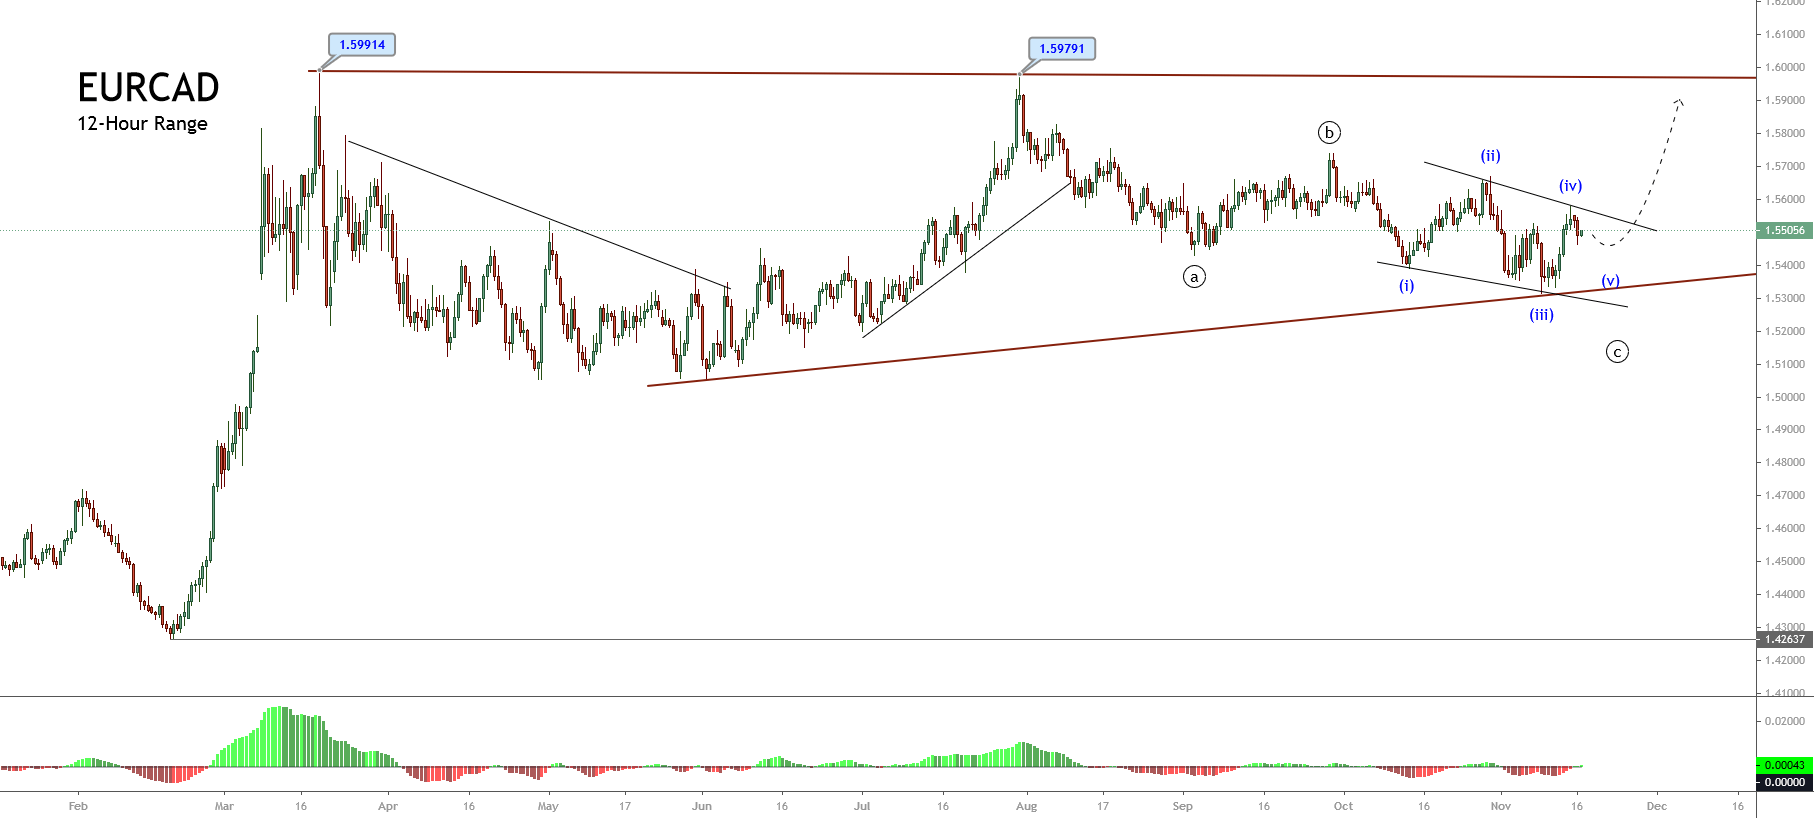
In terms of the Elliott Wave Theory, the corrective pattern presents a three-wave subdivision; the last downward move of Minute degree identified in black began at 1.59791, and current advances in its wave ((c)) in black. Likewise, its internal structure unveils four internal moves of the Minuette degree labeled in blue.
Considering that the wave ((c)) in blue looks unfinished, the EURCAD cross could develop a new decline corresponding to its fifth wave. On the other hand, the breakout of the line that connects the end of waves (ii) and (iv) should confirm the new upward sequence that could boost the price likely toward the psychological barrier of level 1.59.
Short-term Technical Outlook
The short-term Elliott wave view unfolded in the following 4-hour chart, reveals the incomplete descending wave ((c)) of Minute degree labeled in black, which could start to advance in its fifth internal leg marked in blue.
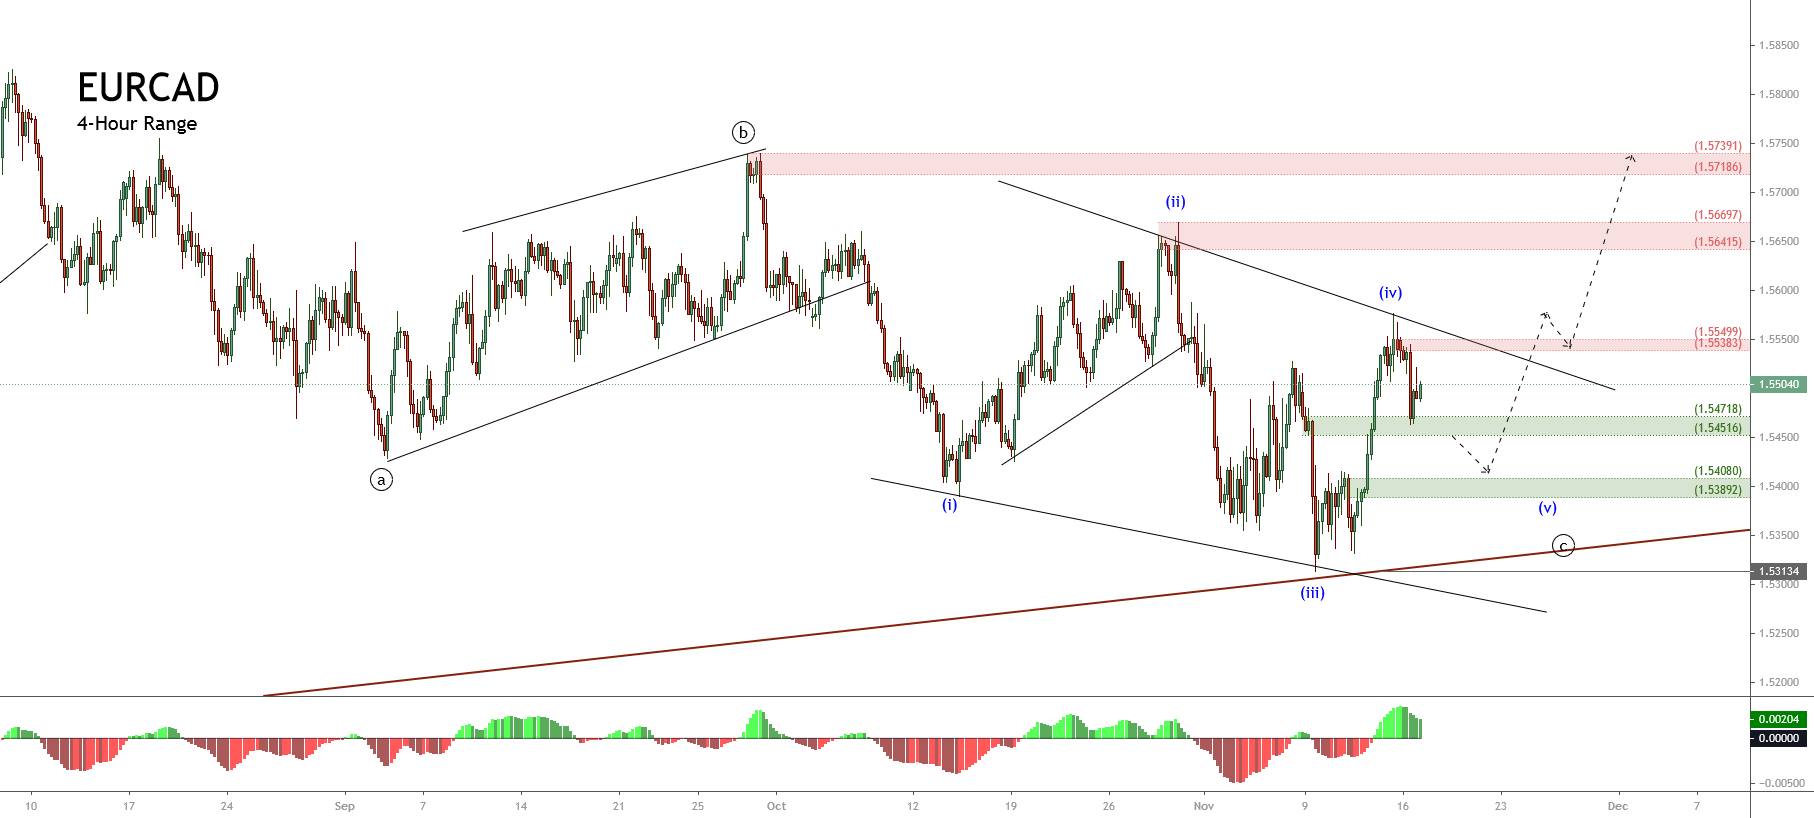
In this context, the price could decline and found fresh buyers in the demand zone between 1.5471 and 1.5451; it even could extend its retracement to the area of 1.5408 and 1.5389, where the EURCAD cross could start to bounce.
If the price reacts mostly upward and surpasses the supply zone between 1.5538 and 1.5549, the EURCAD bias should start to turn primarily bullish. Likewise, the short-term bullish target can be found in the supply region bounded by 1.5718 and 1.5739.
Finally, if the price penetrates and closes below 1.5312, the bullish scenario will be invalid, and likely, the cross could extend its declines in “free fall.”