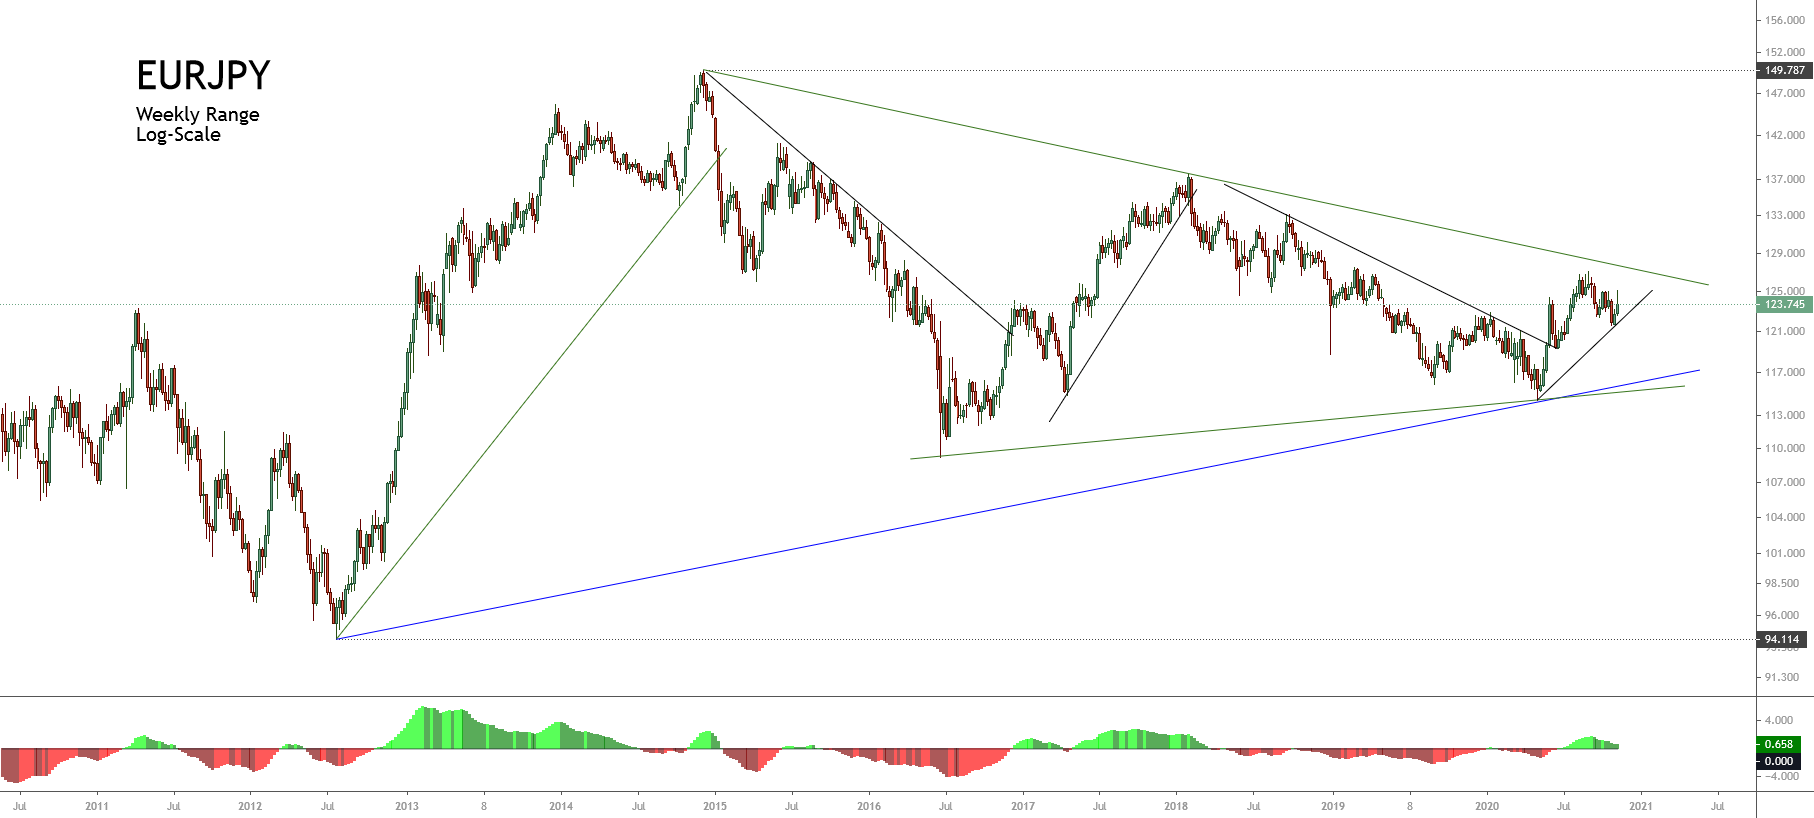
In mid-November, we commented about the technical market context of the EURJPY cross, as its big picture displayed in its weekly chart revealed a technical formation identified as a triangle pattern, which continues progressing since mid-2014.

Moreover, our previous mid-term Elliott wave analysis in its 12-hour chart revealed the advance of an incomplete corrective structure of Minor degree, which currently advances in wave B in green.
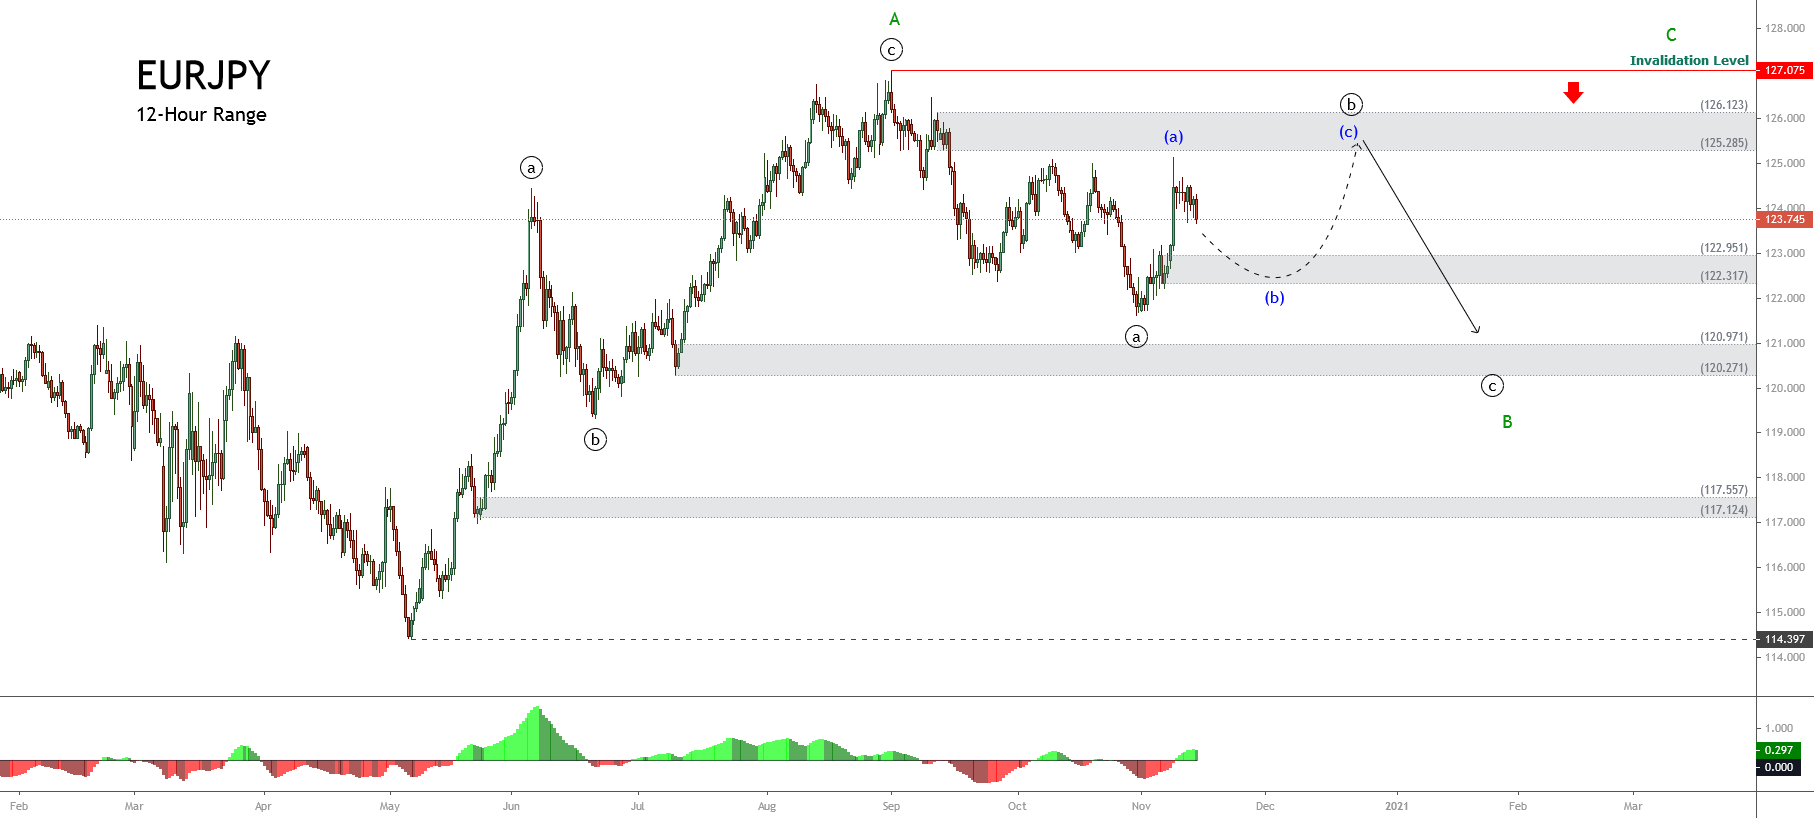
In this regard, our main outlook anticipated the progress in its wave ((b)) of Minute degree identified in black. The internal structure also suggested a limited decline toward the demand zone between 122.951 and 122.317. Once reached, the price could have completed the internal wave (b) of Minuette degree labeled in blue.
Once the cross completed its wave (b), in blue, the cross should begin its wave (c), in blue, with a potential target in the supply zone between 125.285 and 126.123.
Technical Outlook
Currently, the EURJPY cross in its 12-hour chart reveals the bounce from the previous demand zone forecasted, where the price began to advance in its wave (c) in blue.
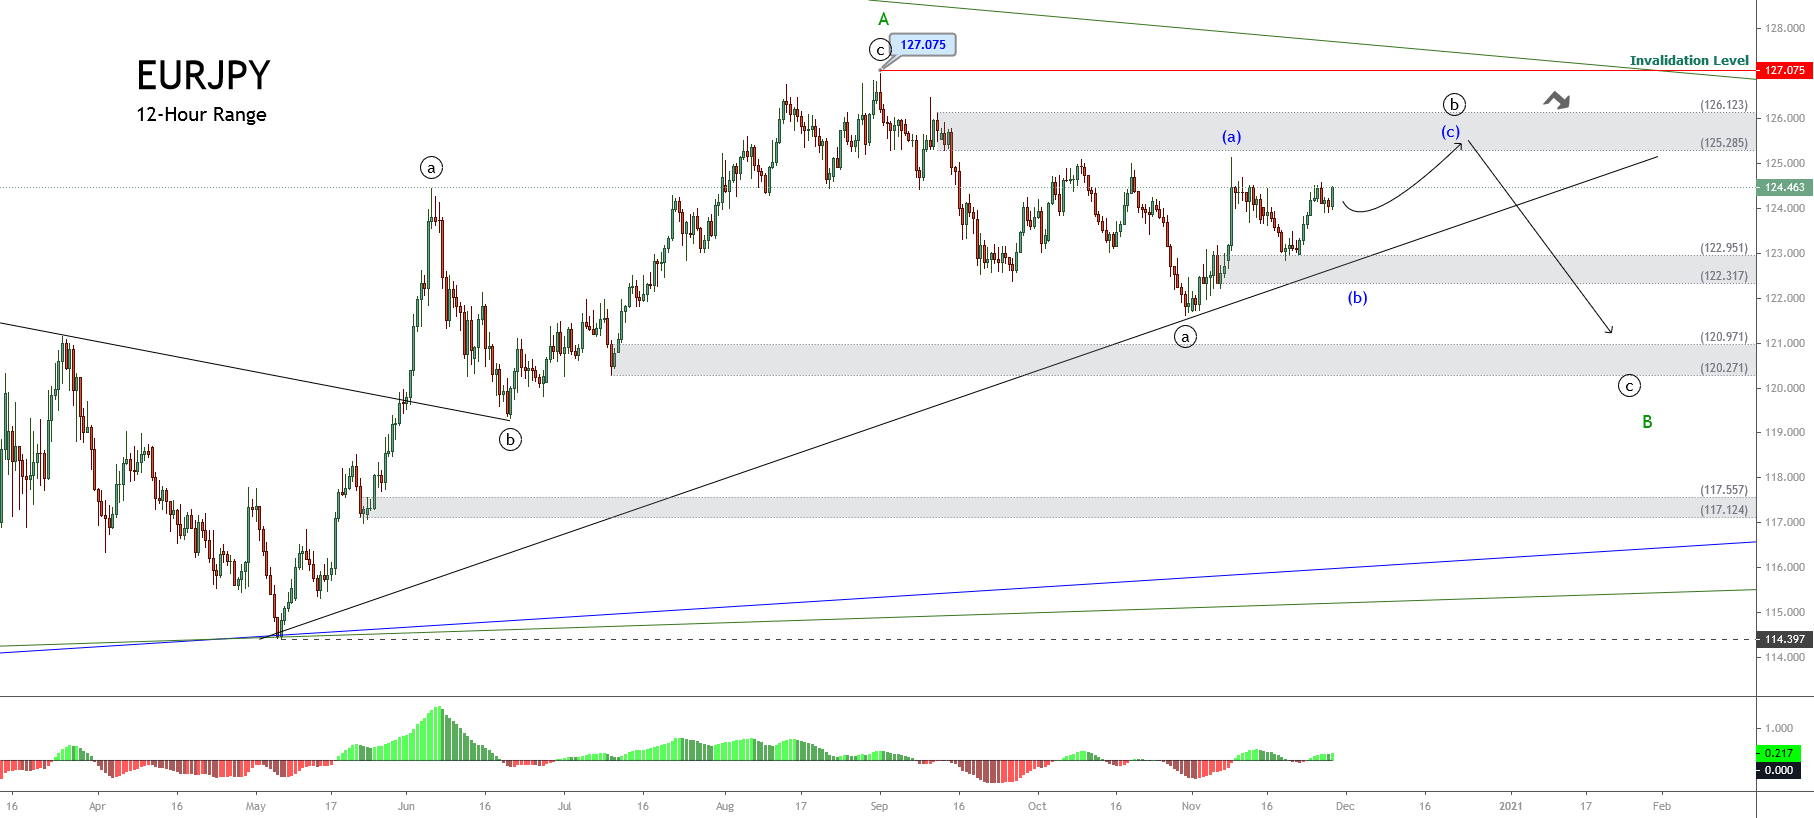
In the previous chart, we distinguish wave (c)‘s upward progress, which should evolve in a five-wave sequence according to the Elliott Wave theory. The figure also shows the potential target zone between 125.285 and the psychological barrier of 126.
This price landscape brings us three potential scenarios for the current upward movement:
- First scenario: The EURJPY cross reaches the supply zone between 125.285 and 126.123, completing its wave ((b)) in black, and the price starts to decline in an internal five-wave sequence corresponding to wave ((c)).
- Second scenario: The cross’ short-term rally fails to surpass the end of wave (a), in blue, and begins to decline. This scenario should be indicative of strong bearish pressure.
- Third scenario: EURJY price action surpasses the invalidation level located on 127.075. In this case, the cross could be creating a bullish breakout of the long-term triangle, suggesting the continuation of the long-term bullish trend.
Nevertheless, before placing any position on the bearish side or continue on the bullish side, the price action must confirm the end of wave ((b)) in black.