
Overview
The EURAUD cross moves mostly bearish in a downward sequence that began in early October. The price action suggests that the cross could develop a new low before complete the bearish sequence still in progress.
Technical Big Picture
The EURAUD cross penetrated the sideways trading zone developing the second bearish leg of its three-wave movement that looks incomplete. Likewise, once the current bearish wave ended, the cross could start a new rally subdivided into a five-wave sequence.
The following chart represents the EURAUD cross in its 12-hour range, in which the sideways trading range goes between 1.60332 and 1.65744. This consolidation formation found its bottom on June 02nd, and its top corresponds to a pivot level that turned into a long-term key level.
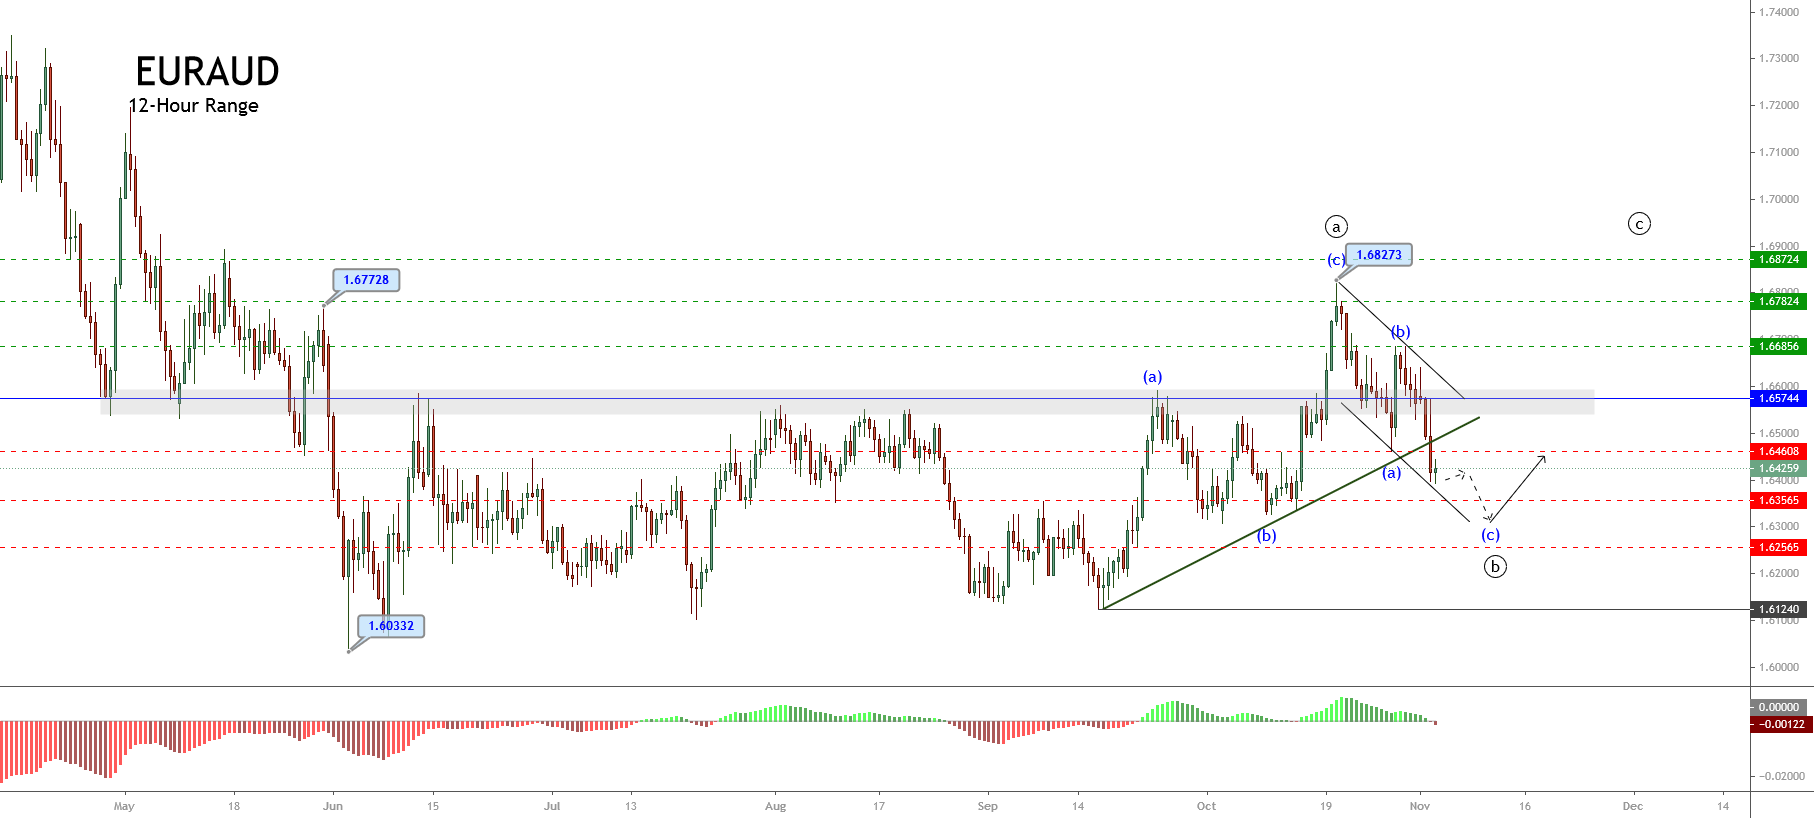
Consequently, as long as the price keeps moving below this level, the short-term bias will continue being bearish. However, the May 29th breakout of the 1.67728 level, when the cross rallied topped at 1.68273, suggests the possibility of a new upward sequence.
Concerning its Elliott wave analysis, the current bearish sequence corresponds to an incomplete wave ((b)) of Minute degree labeled in black, which began when the price found fresh sellers at 1.68273.
Currently, the EURAUD cross advances in its internal wave (c) of Minuette degree identified in blue. Its completion could suggest a new rally that could drive the price toward the October high zone.
The short-term key supports and resistance levels are as follows:
• Resistance 1: 1.66856
• Resistance 2: 1.67824
• Resistance 3: 1.68724
Pivot Level: 1.65744
• Support 1: 1.64608
• Support 2: 1.63565
• Support 3: 1.62565
Technical Analysis Outlook
The short-term outlook for the EURAUD cross and under the Elliott Wave perspective exposes the bearish advance in the third wave of Subminuette degree identified in green, which belongs to the wave (c) of Minuette degree labeled in blue.
The following 3-hour chart shows the intraday consolidation activity that suggests the equilibrium between bull and bear traders. In terms of the wave theory, the consolidation structure should correspond to wave iv of Subminuette degree.
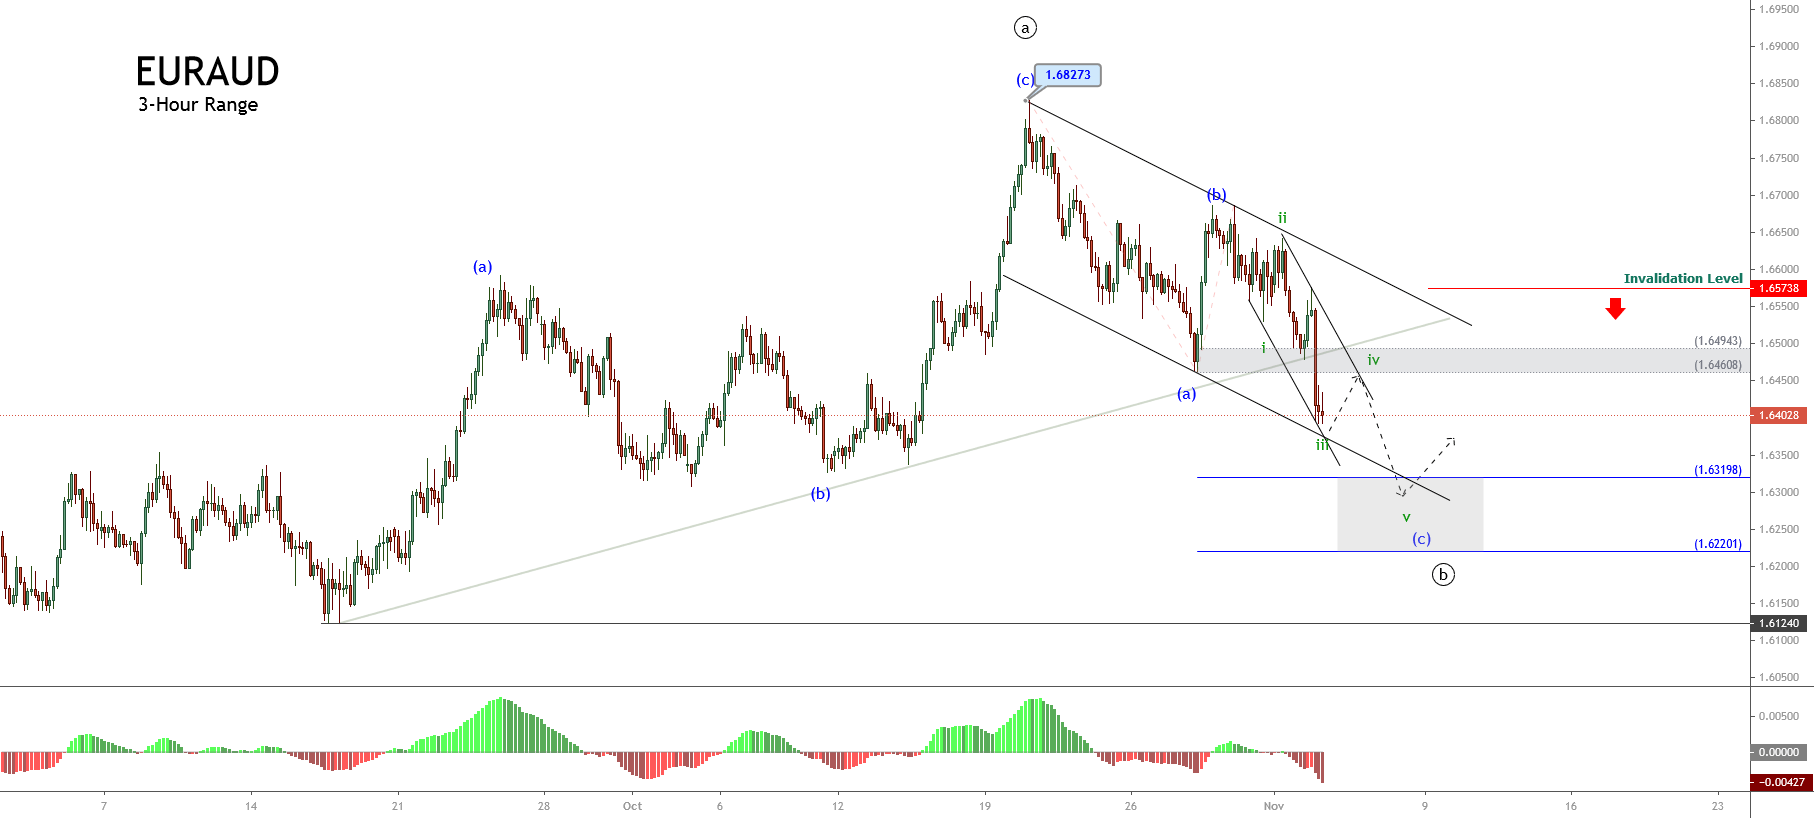
The Elliott wave structure suggests the possibility of a limited upside until 1.6460 and 1.6494, where the price could find fresh sellers expecting to join their limited positions with a potential target in the area between 1.63198 and 1.62201. This decline should complete the fifth wave that belongs to wave (c) identified in blue.
Finally, the invalidation level of the bearish scenario locates at 1.6573.