Last week, the USDCHF pair developed a sideways movement pattern that looks like an inverted head and shoulder pattern. However, the primary mid-term trend remains dominated by bearish sentiment. Examine with us these three charts to help you foresee the pair’s potential movements in the coming sessions.
Inverted Head and Shoulder Pattern?
The USDCHF pair illustrated in the following 12-hour chart seems to develop a sideways formation after the accelerated decline observed during the second half of November 2020. After easing from the psychological support of 0.89, the price began to consolidate in a range between 0.8917 and 0.8757.
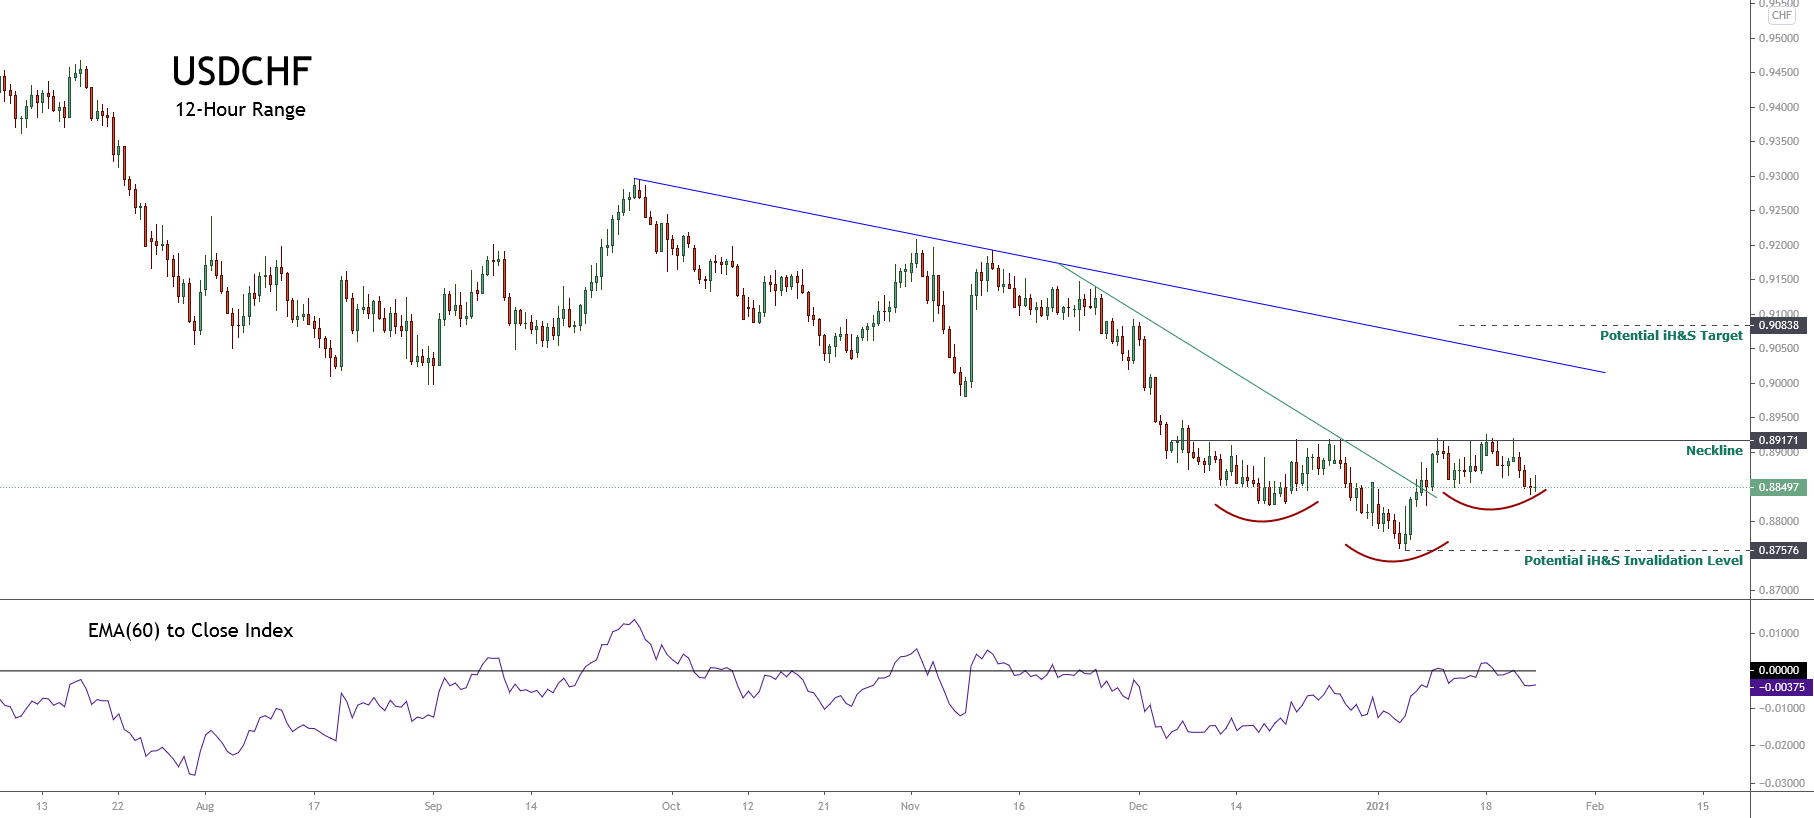
In the previous chart, the USDCHF seems to be forming an inverse head and shoulder (iH&S) pattern, suggesting a likely bullish reversal movement. According to chartist analysis, the iH&S formation will be confirmed if the price breaks and closes above the neckline located at 0.89171.
For this reversal scenario, the invalidation level is located below the head, which holds its lowest level at 0.87576, corresponding to the low touched last January 06th.
Elliott Wave View Suggests Exhaustion
The big picture of the USDCHF pair exposed in its daily chart reveals the incomplete bearish impulsive sequence of Minute degree labeled in black, suggesting a limited decline.
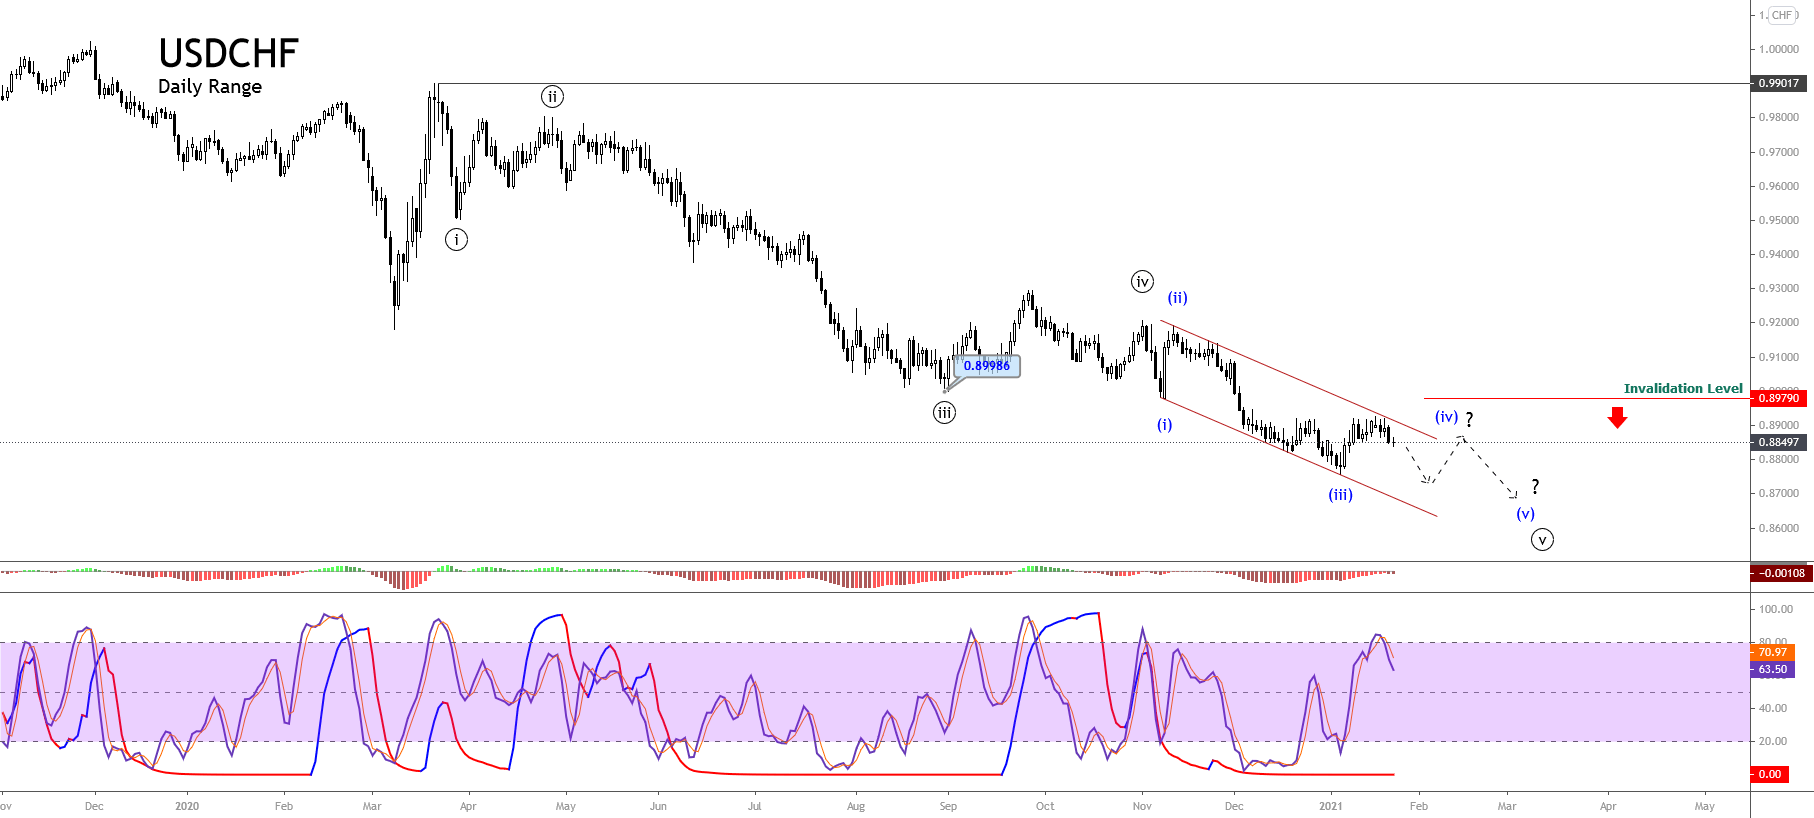
As illustrated in the last chart, the USDCHF began a downward impulsive sequence of Minute degree on March 23rd when the price found fresh sellers at 0.99017. The price action reveals the completion of its third extended wave bearish move, which found support at 0.89986 in late August 2020, starting to advance mostly sideways in its wave ((iv)) in black.
Once the sideways corrective formation corresponding to the fourth wave in black finished, the pair began to continue its declines in the wave ((v)) of Minute degree, which currently seems developing its wave (iv) of Minuette degree identified in blue.
On the other hand, the timing and momentum oscillator reveals that the bearish pressure still controls the price action. In this context, the price would see a further decline, confirming Elliott Wave’s outlook of a pending fifth wave of Minuette degree.
This bearish continuation scenario’s invalidation level stays at 0.8979, which corresponds to the end of wave (i).
Price Action Reveals Indecision
The USDCHF pair in its daily chart unfolded in the bellow chart shows an indecision candle corresponding to the last Friday’s session, leaving a narrow body and long-tailed candlestick pattern. This market context carries us to expect a pause in the downward movement developed in previous trading sessions.
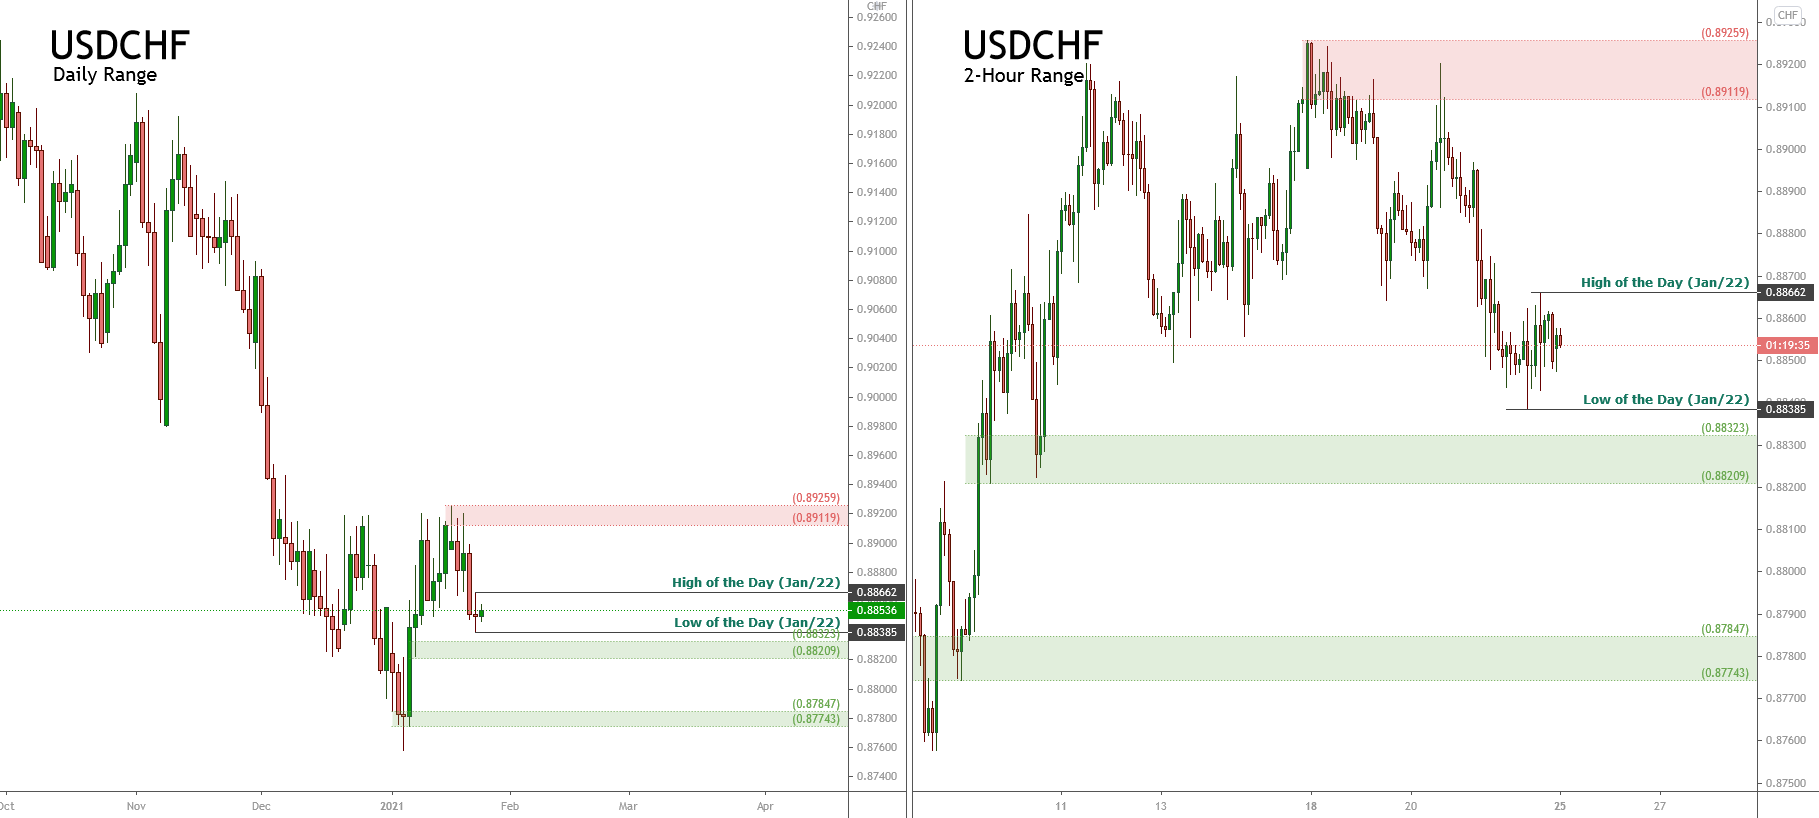
The confirmation of the bearish scenario will occur if the price closes below the LOD at 0.88385. Conversely, a reversal signal could be established by a Monday 25th session’s close if it exceeds Friday’s high of 0.88662.
In summary, the USDCHF pair develops a sideways formation that looks like an incomplete inverse head and shoulders pattern suggesting the potential bullish reversal sequence if the price soars above the neckline located at 0.89171. However, the Elliott wave outlook suggests further declines, corresponding to a possible wave (v) of Minuette degree labeled in blue. In this context, the price action reveals the indecision of the next direction. If the price decides to continue its decline, the USDCHF could re-test January’s 06 low zone.