
EURUSD’s big picture reveals an acceleration in its uptrend, which is progressing since the second half of March when the price reached and confirmed its bottom of 1.06359. In this context, since the price saw its yearly low, the common currency is up over 15.2% to date.
Technical Overview
The following 2-day chart illustrates the EURUSD pair shows the primary trendline plotted in blue. We see the trend continuing its progression on the bullish side. The secondary trend identified with the green trendline reveals an acceleration of price action since early November when the common currency found support at 1.16025.
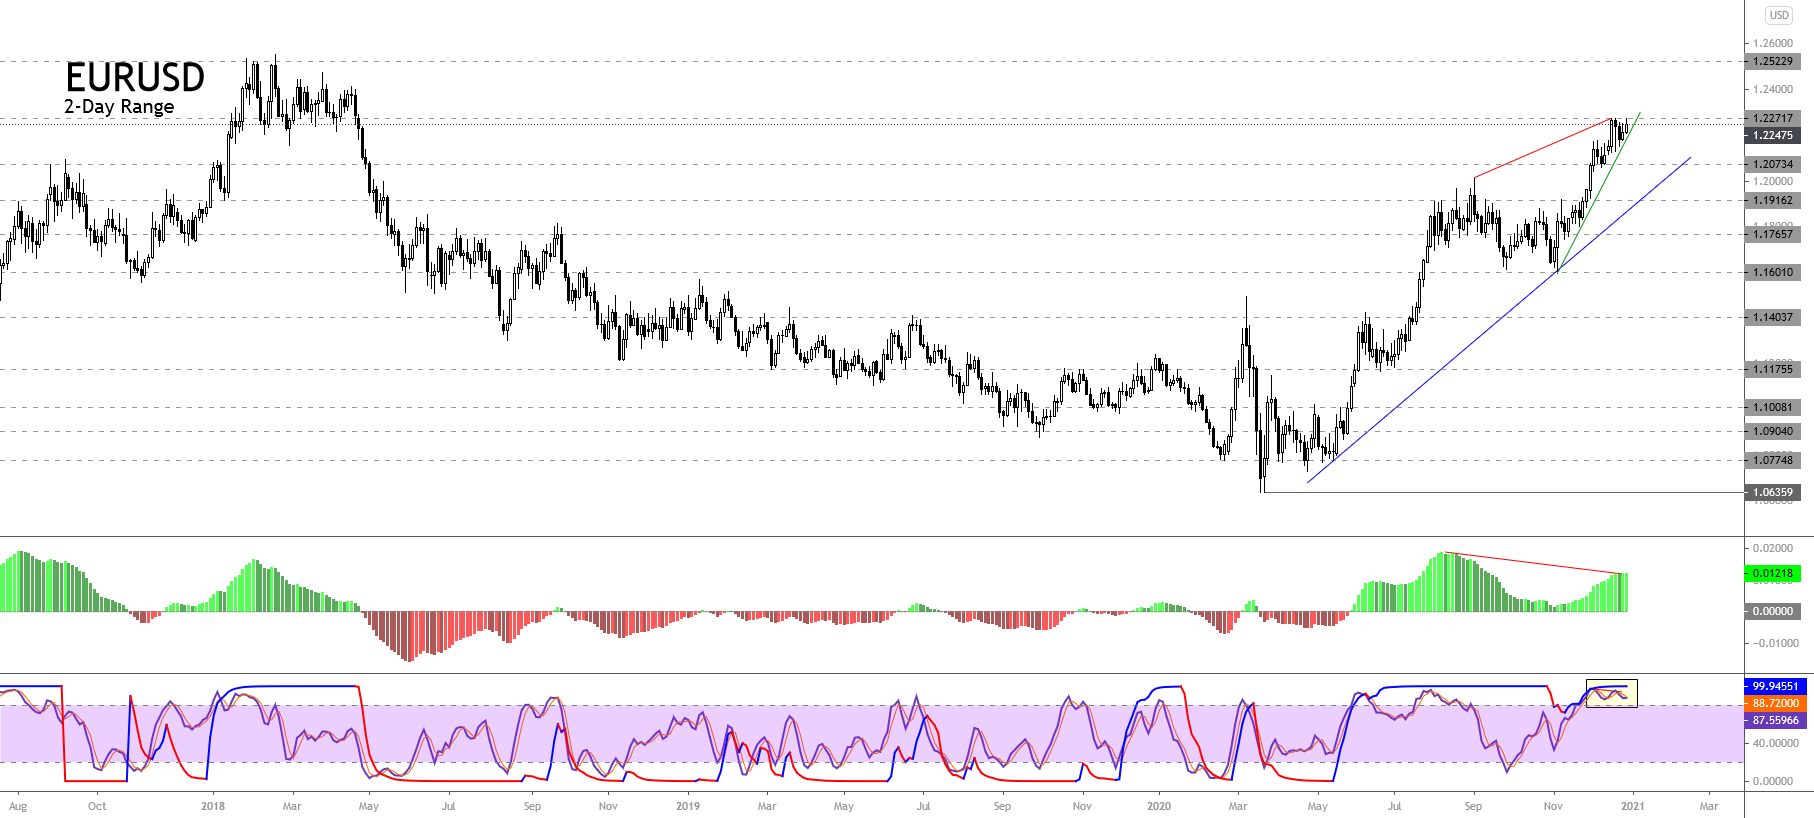
On the chart, we see that once the pair found support in early November, it began to rally, finding resistance at 1.22728 in mid-December, where the price started to consolidate until date.
On the other hand, the MACD oscillator shows a bearish divergence, which leads us to suspect the bullish trend’s exhaustion. However, the exhaustion signal doesn’t mean that the EURUSD will reverse the uptrend in progress. Moreover, the momentum and timing oscillators confirm the bullish pressure; however, the reading over level 80 (yellow box) on both indicators suggest the short-term overbought of the common currency. In this regard, the price could experience a short retracement in the following trading sessions before continuing its rally.
Technical Outlook
The EURUSD outlook for the coming weeks illustrated in the following daily chart shows the possibility of a limited correction, which could retrace until the next support located at about 1.20734, where the price could find fresh buyers with a potential target located in the long-term resistance of 1.25229, corresponding to the highs made in February 2018.
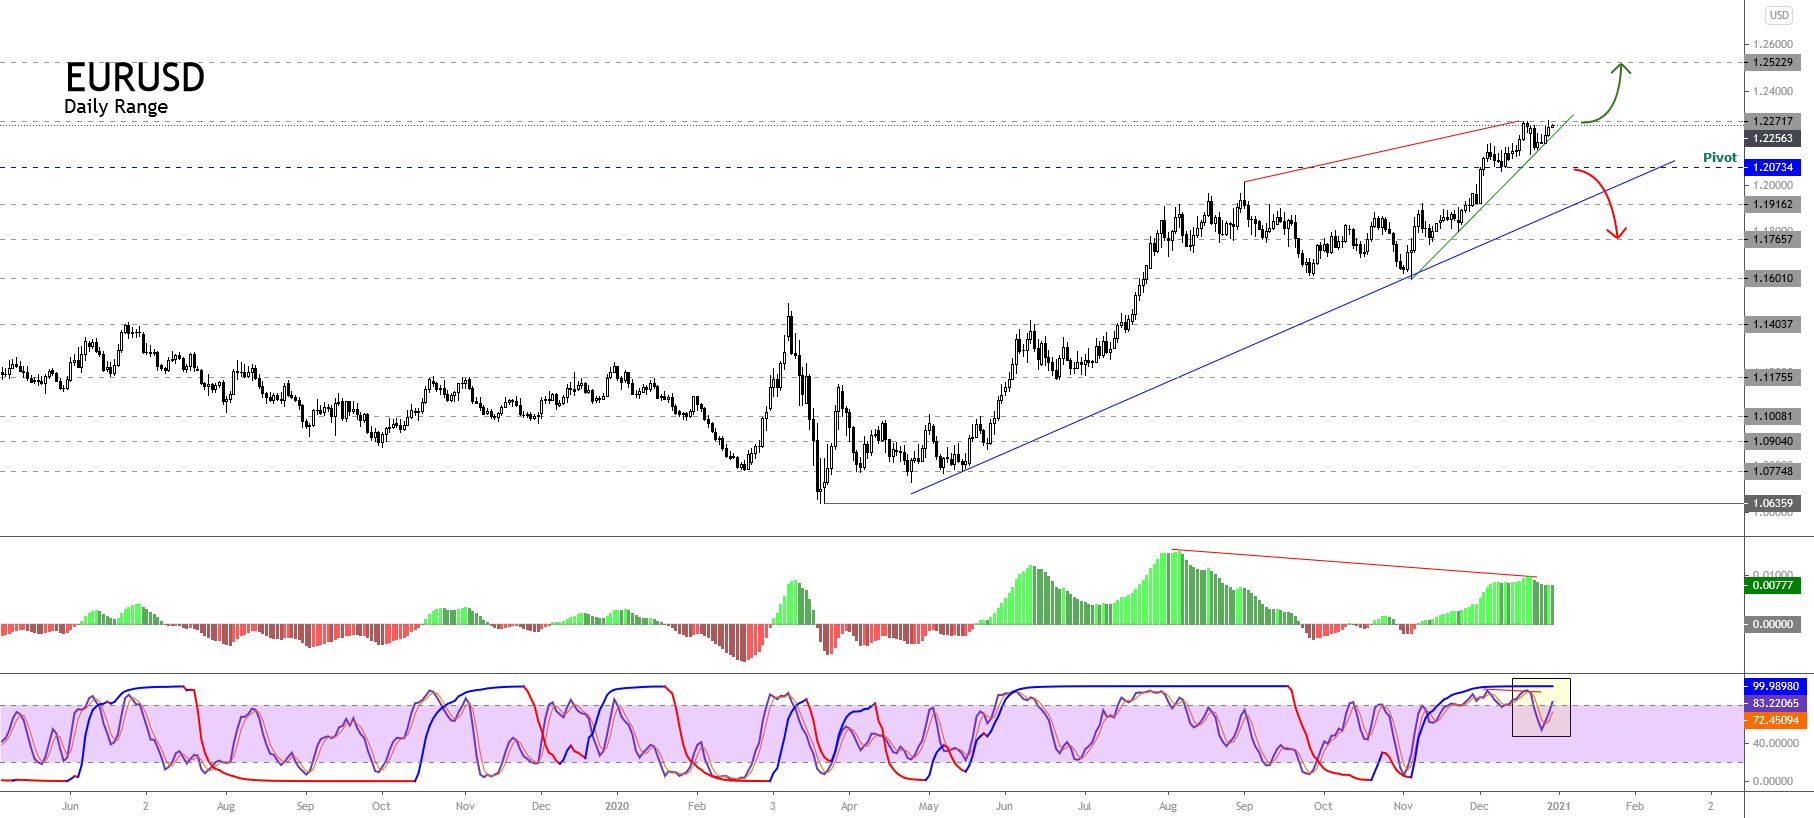
The bullish scenario’s confirmation will happen if the price closes above the resistance corresponding to the yearly high of 1.22717. On the other hand, if the common currency closes below 1.20734, the price could decline to the primary trend-line as dynamic support, it even could extend its decline until 1.17657.
Summarizing, the EURUSD pair continues developing a bullish trend, which currently looks consolidating the last rally that began on early November low at 1.16025. The MACD oscillator suggests exhaustion of the current bullish trend. Likewise, the momentum and timing oscillators reveal the common currency’s overbought condition, suggesting a short-term correction.
In this regard, considering that the bullish pressure persists, the price could retrace until 1.20734, where the EURUSD could find fresh buyers. However, the close above 1.22717 would confirm the upward continuation till the next long-term resistance of 1.25229. On the contrary, if the price closes below 1.20734, the common currency could extend its drops to 1.17657.
Related posts
 Daily F.X. Analysis, July 29 – Top Trade Setups In Forex – FOMC in Focus!
 Daily F.X. Analysis, October 23 – Top Trade Setups In Forex – European PMI In Highlights!
 Daily F.X. Analysis, 13th October – Top Trade Setups In Forex – U.S. Inflation in Highlights!
 AUDNZD: Potential Bounce among Overall Weakness