Investor’s eyes will stay on the Final CPI and Final core CPI due to the U.S. Economy. The analysts are forecasting no significant changes in the inflation rate; thus, it may go muted. However, the Claimant Count Change and Unemployment Rate data from the U.K. is likely to drive market movements. Let’s keep an eye on U.K. labor market figures and U.S. CPI m/m later today.
Economic Events to Watch Today
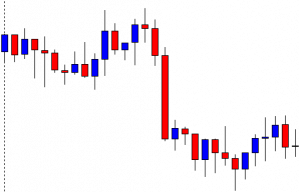
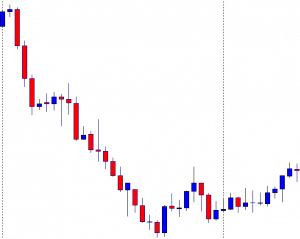
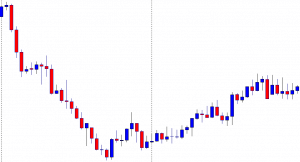
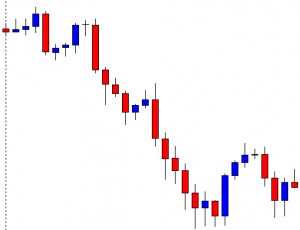
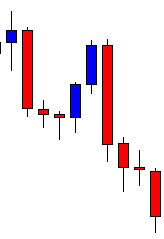
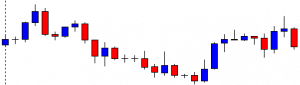
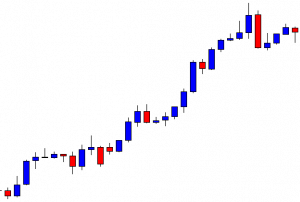
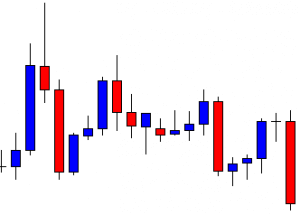
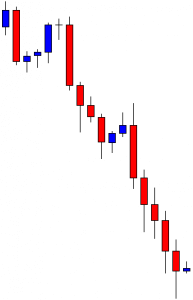
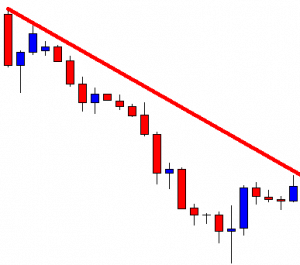
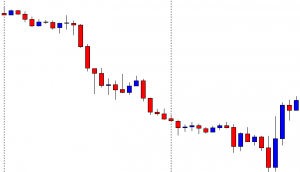
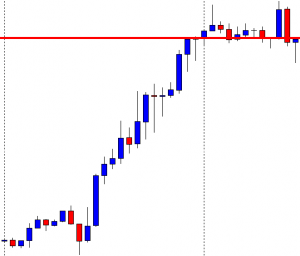
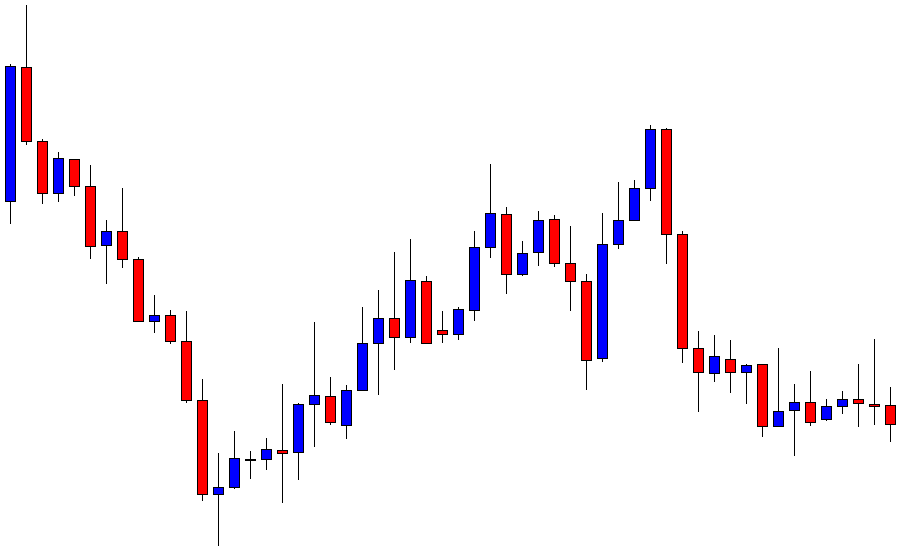
EUR/USD – Daily Analysis
The EUR/USD pair was closed at 1.18109 after placing a high of 1.18265 and a low of 1.17865. Overall the movement of the EUR/USD pair remained flat throughout the day. The EUR/USD pair was flat on Monday, as the European Central Bank members reportedly downplayed expectations that it would adopt the Federal Reserve’s average inflation targeting measure, cooling bets on central banks allowing inflation to run above target.
Several ECB policymakers appeared reluctant to follow the Fed with an average inflation target on concerns it could lead to unrealistic expectations about future policy decisions. The European Central Bank has targeted an inflation policy of below but close to 2% for years. If ECB adopts average inflation targeting like Fed, this move will see the ECB allow inflation to run above its 2% target for some time to make up for periods of sluggish price increases.
Recently, Eurozone inflation has remained short of the bank’s target. Following U.S. Federal Reserve on inflation targeting measure could allow inflation to rise above 2% and makeup periods of lagging price pressures.
Meanwhile, the signs that the second wave of coronavirus has started to weigh on growth have attracted the central bank’s attention and caused a sluggish move in the single currency Euro. On the data front, at 10:59 GMT, the German Wholesale Price Index dropped to 0.0% from the forecasted 0.2% and weighed on single currency Euro that ultimately weighed on EUR/USD pair.
On the U.S. front, the U.S. dollar remained strong onboard on Monday amid the rising hopes that a small coronavirus relief bill will be passed before elections as the talks over the massive stimulus bill stalled on the day. The new proposed bill by Trump of 1.8 trillion dollars faced rejection from both Republicans and Democrats. Republicans were reluctant to add more to the government debt pile, and Democrats wanted their 2.2 trillion packages.
After this, Trump Administration called on Congress for a small stimulus package to be funded from leftover funds and used for hardly-hit sectors like airline and small businesses. The hopes that a small package will be delivered before elections gave strength to the U.S. dollar that added pressure on EUR/USD, and the pair remained flat throughout the day.
Daily Technical Levels
Support Resistance
1.1791 1.1832
1.1767 1.1851
1.1749 1.1874
Pivot point: 1.1809
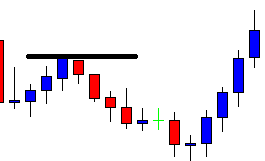
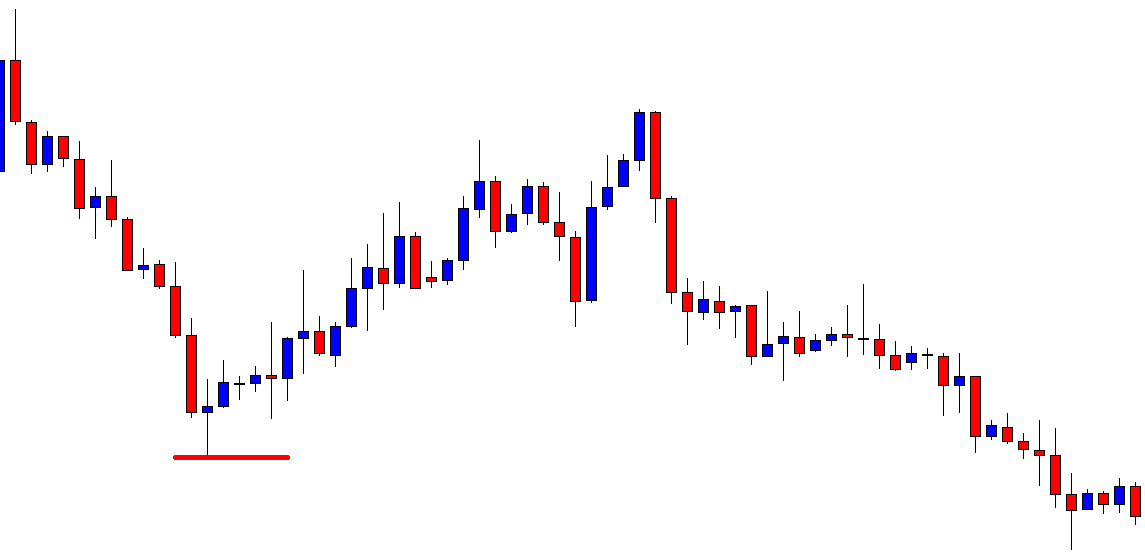
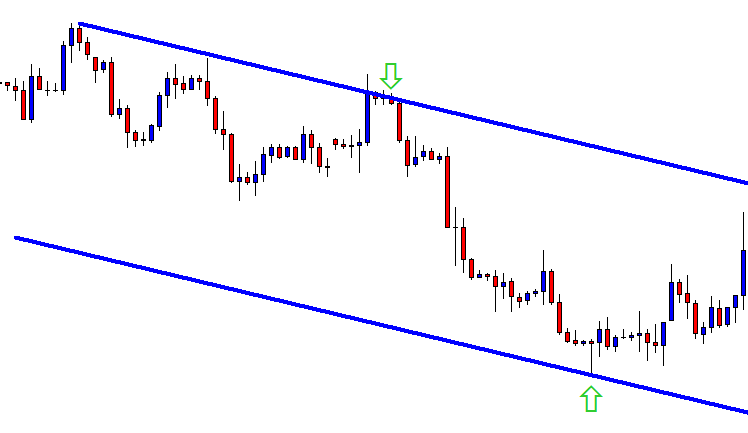
EUR/USD– Trading Tip
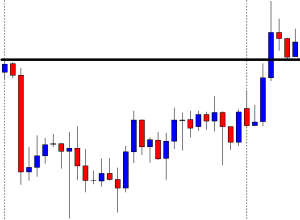
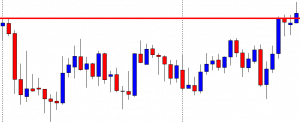
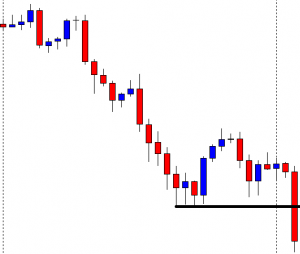
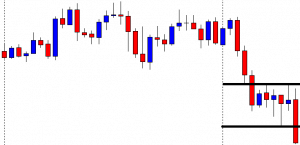
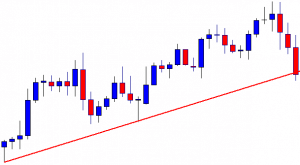
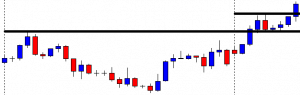
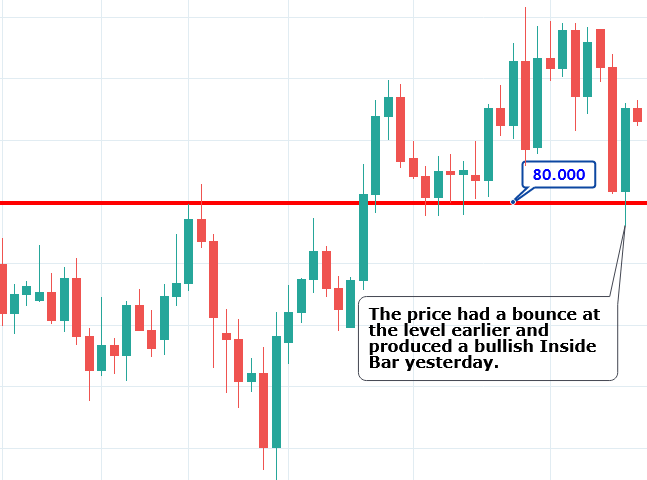
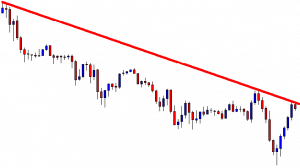
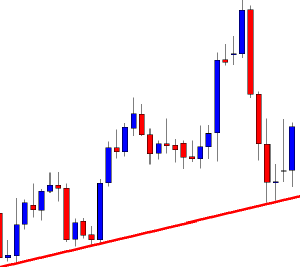
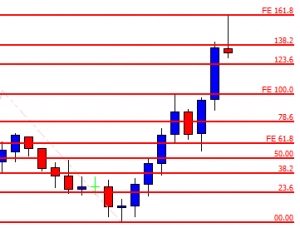
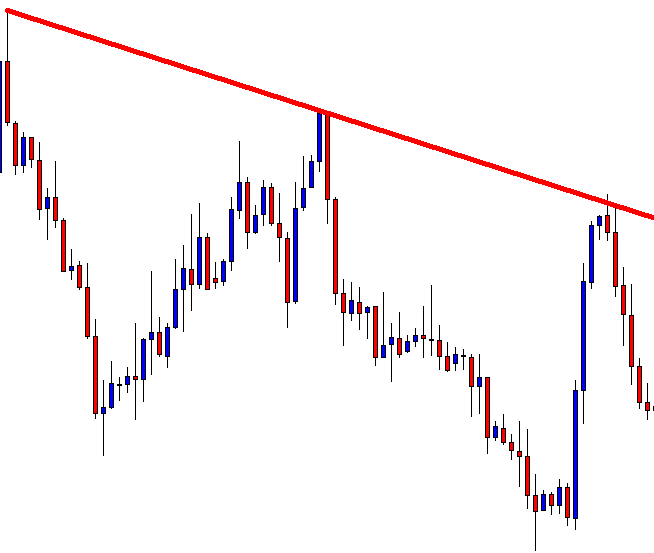
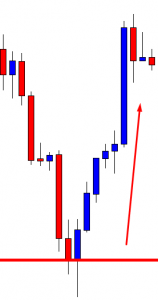
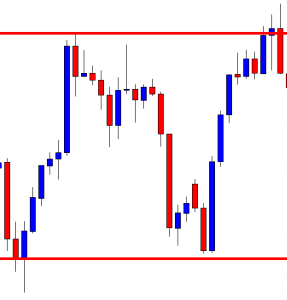
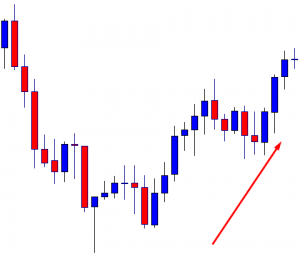
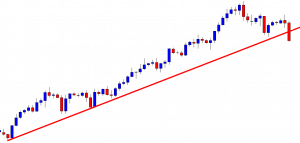
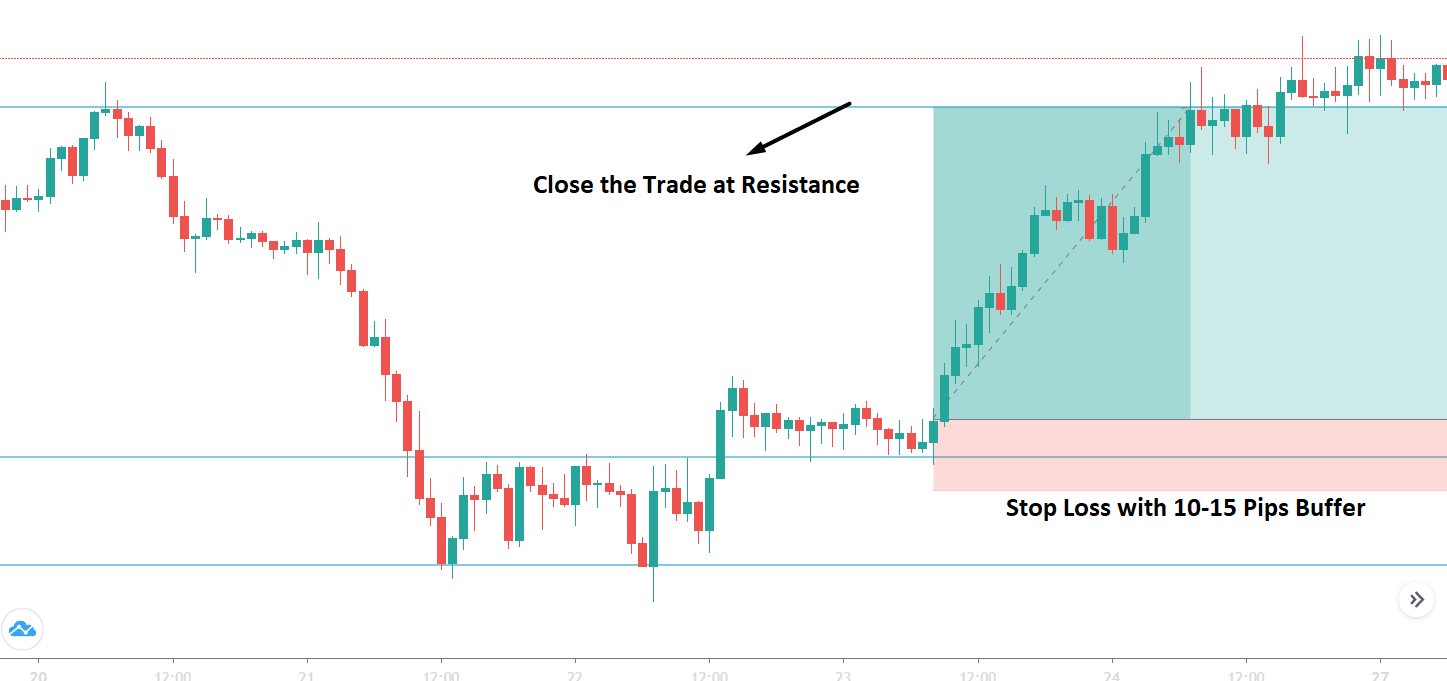
The EUR/USD pair is supported over 1.1790 level, which marks double bottom level on the 4-hour timeframe. Above this level, the EUR/USD is likely to bounce off until the 1.1811 level, and the bullish breakout of the 1.1831 level can also extend buying until the next target level of 1.1870. Conversely, the bearish breakout of the 1.1790 level can extend the selling trend until the 1.1750 level.
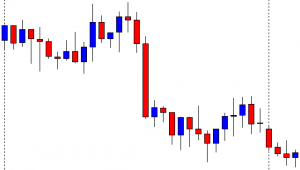
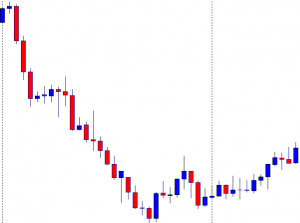
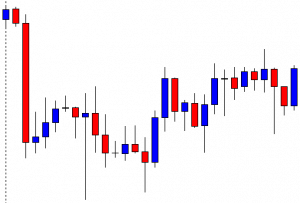
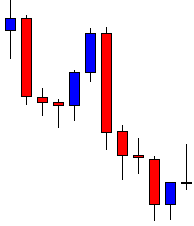
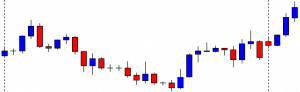
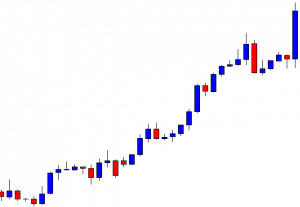
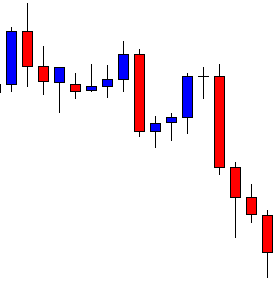
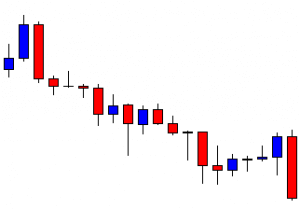
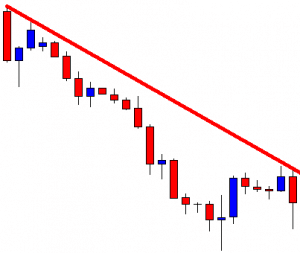
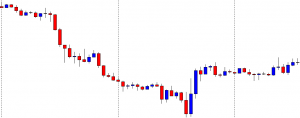
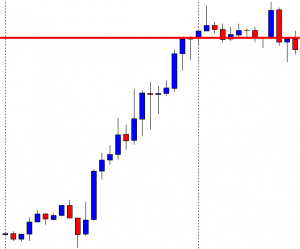
GBP/USD – Daily Analysis
The GBP/USD pair was closed at 1.30644 after placing a high of 1.30824 and a low of 1.30052. Overall the movement of the GBP/USD pair remained bullish throughout the day. The GBP/USD pair remained positive on Monday despite broad-based U.S. dollar strength. The pair traded at its four-week highest level, but the prospect remained depressed as the local country’s coronavirus situation escalated and forced to impose new restrictive measures.
The U.S. dollar was high on board after the talks for massive stimulus measures stalled again, and the Chinese yuan depreciated. The strong U.S. dollar helped cap further gains in GBP/USD pair on Monday. The latest move also weighed the gains in the GBP/USD pair from the Bank of England, who asked commercial banks earlier today about their readiness to cope with negative interest rates. On Monday, the Bank of England wrote banks to ask them how ready they were to cope with adopting negative interest rates.
This move from BoE raised concerns that it was considering cutting interest rates further to cope with the rising coronavirus cases in the U.K. The rising speculations over further rate cuts from BoE in the coming months weighed on British Pound and limited the additional gains in GBP/USD pair.
Meanwhile, the Governor of Bank of England, Andrew Bailey, said on Monday that the central bank thought Britain’s economy could struggle more than it has forecasted to recover from the coronavirus pandemic crisis. Bailey said that risk was, unfortunately, all on the downside, which added further pressure on British Pound.
Moreover, British Prime Minister Boris Johnson implemented a three-tiered system of restrictions with the closure of pubs in certain parts of England as the country was trying to deal with the rising number of coronavirus cases. These restrictive measures also exerted downside pressure on GBP/USD pair on Monday.
Furthermore, on the U.S. front, the U.S. dollar remained strong across the board after the Chinese yuan was depreciated. The Chinese city gave away 10M yuan in a lottery trial of digital currency. The latest digital currency trial was aimed at stimulating consumer spending to aid China’s economic recovery from the coronavirus pandemic.
Other than that, the U.S. dollar was also strong as the talks for a massive stimulus bill stalled again when Republicans and Democrats disagreed with passing the newly proposed bill by Trump of worth $1.8 trillion. After this, Trump Administration called on Congress to small stimulus aid for airline and small businesses. The strong U.S. dollar also kept the GBP/USD pair’s gain limited on Monday.
On the Brexit deal front, the concerns rose that negotiations could collapse as the differences between E.U. & U.K. demands were only rising. The deadline to reach a deal is just three days far, and no progress has been reported as of yet that has raised the risk sentiment in the market. The improved risk sentiment kept the GBP/USD pair higher on board.
Daily Technical Levels
Support Resistance
1.3018 1.3098
1.2971 1.3131
1.1938 1.3177
Pivot point: 1.3051
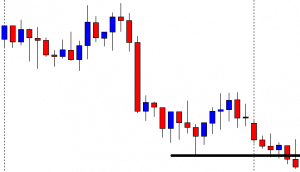
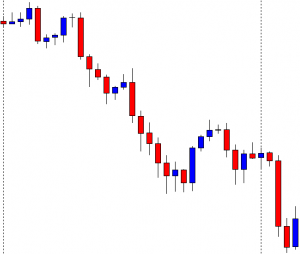
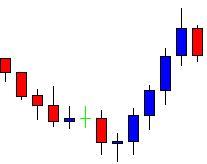
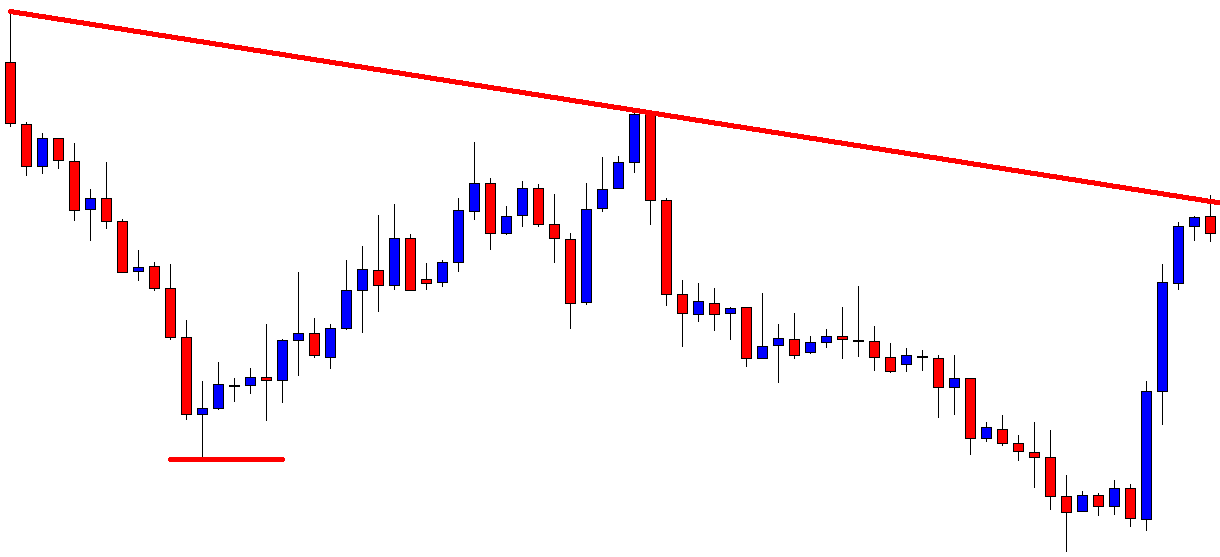
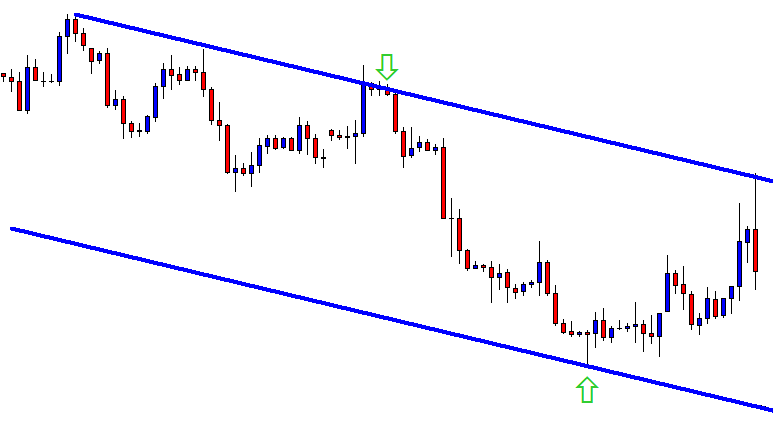
GBP/USD– Trading Tip
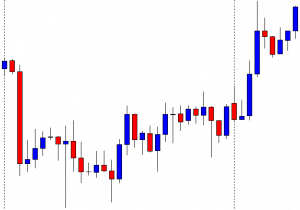
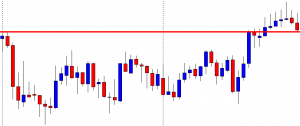
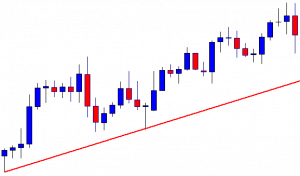
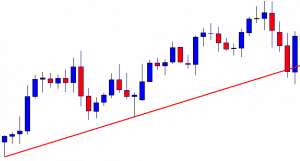
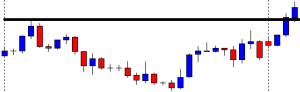
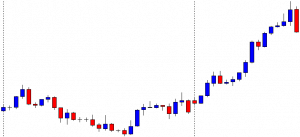
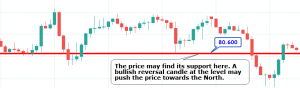
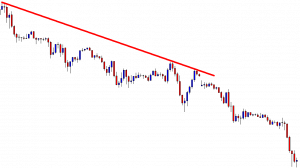
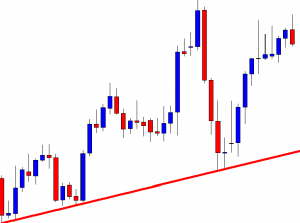
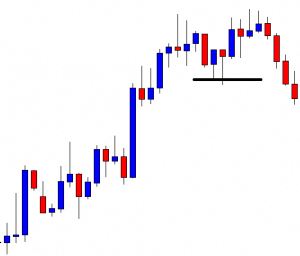
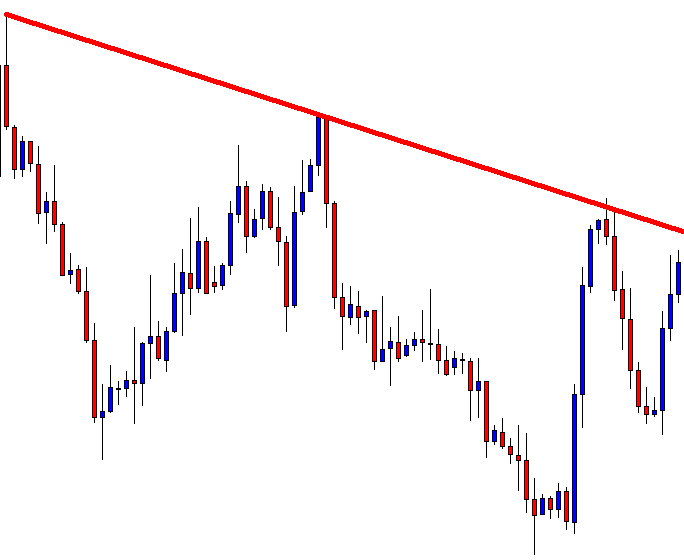
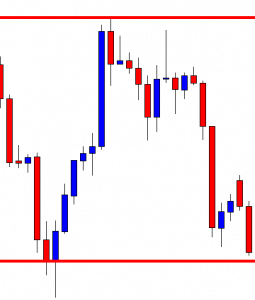
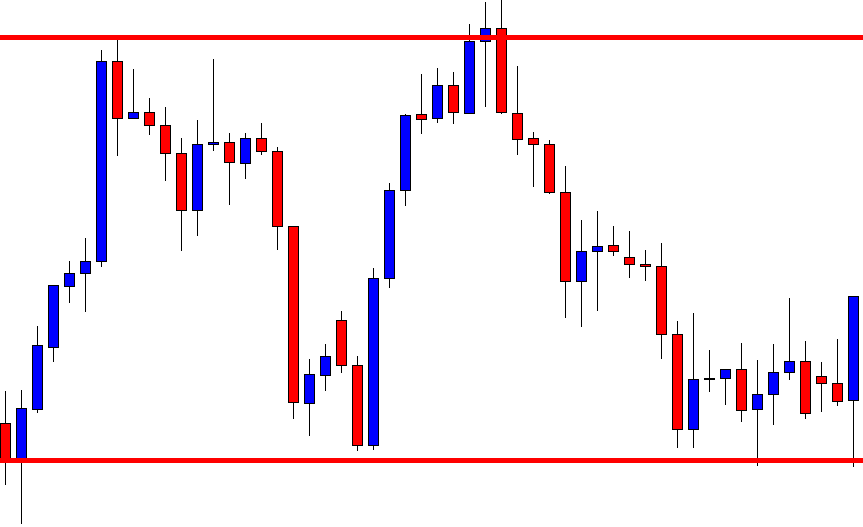
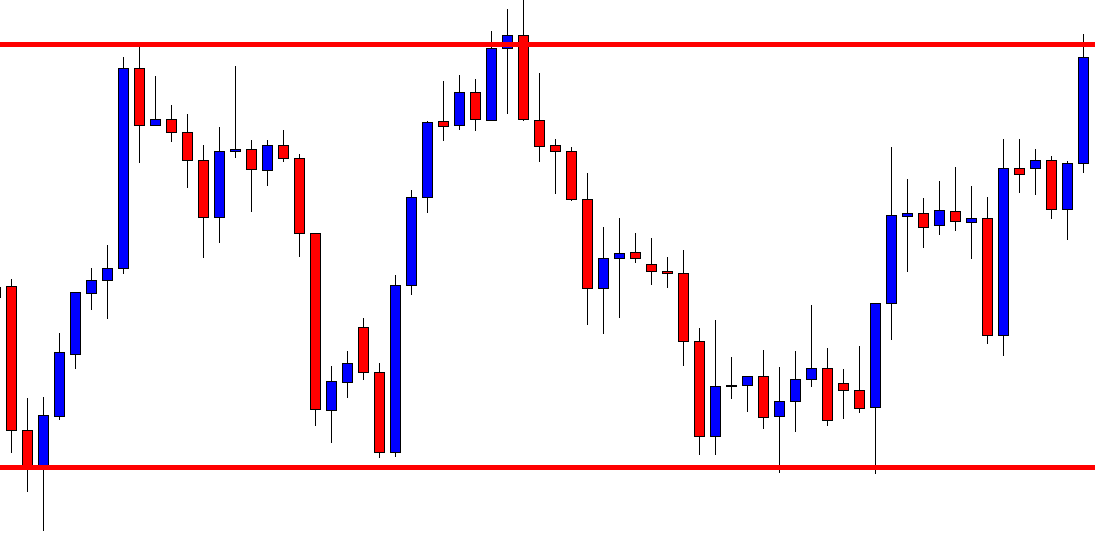
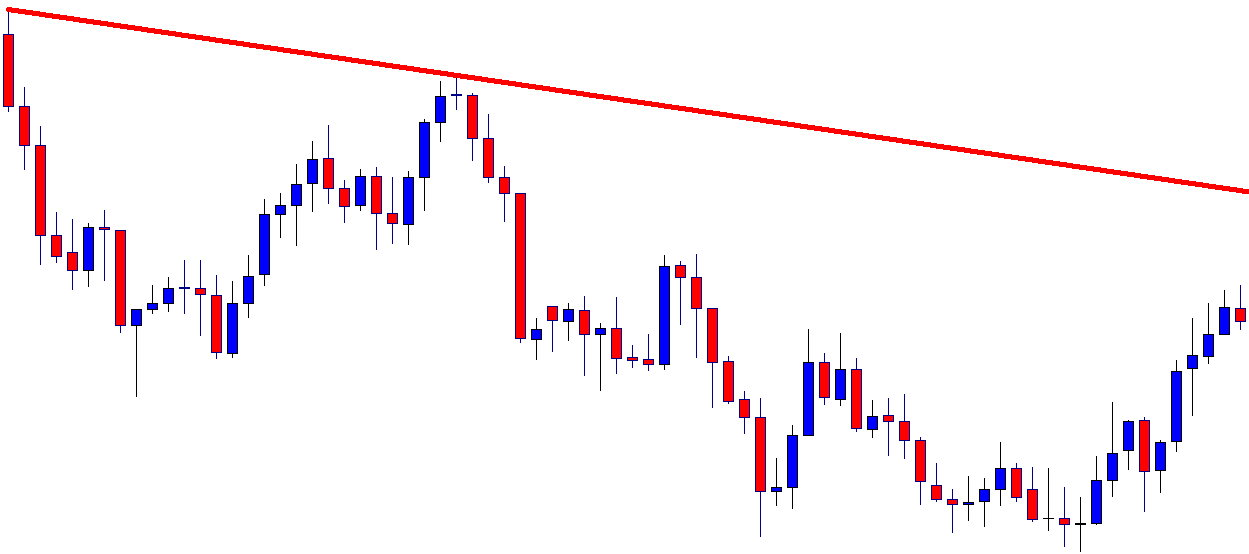
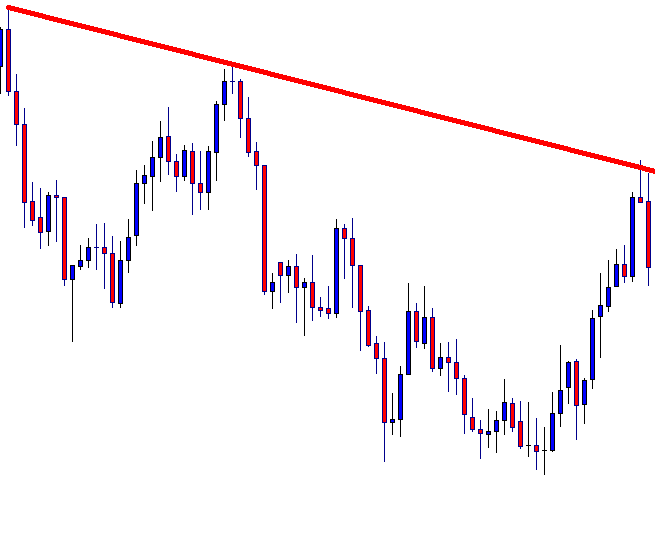
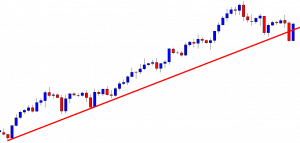
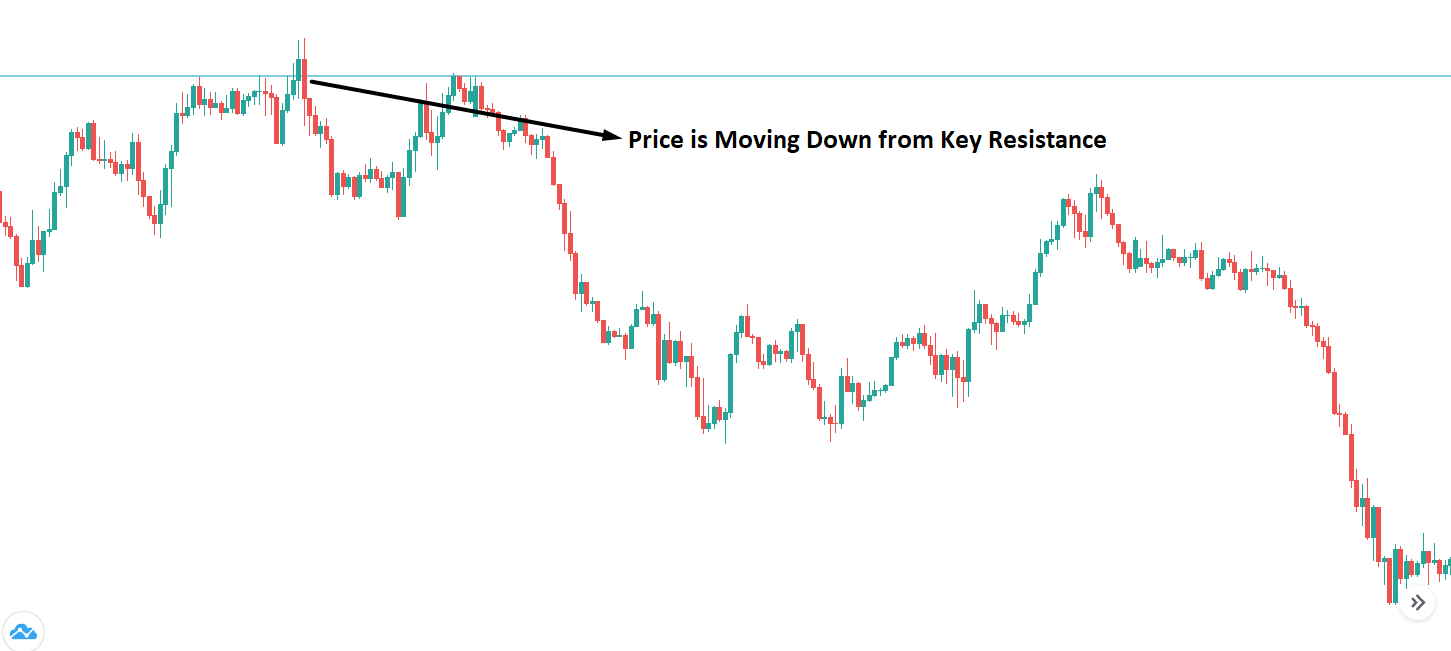
The GBP/USD is trading at 1.3043 level, holding right below an immediate resistance level of 1.3063. The resistance is extended by an upward channels’ trendline on the two-hourly timeframes. Below the 1.3063 resistance level, the Sterling can trigger selling until the 1.3003 level and 1.2959 level. On the higher side, a bullish breakout of 1.3063 levels can trigger buying until the 1.3127 level. The fundamental side is muted today, and the U.S. banks are closed in the observance of Columbus day; therefore, we may experience thin volatility.
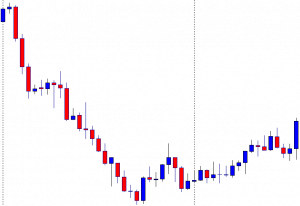
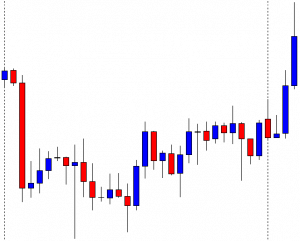
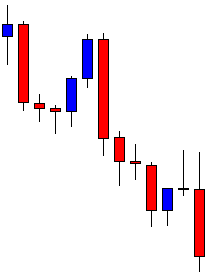
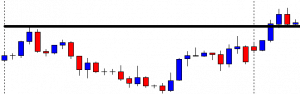
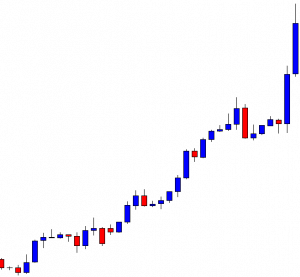
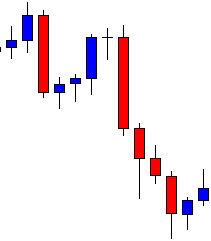
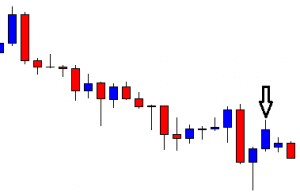
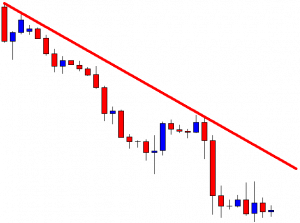
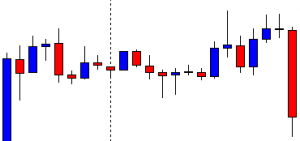
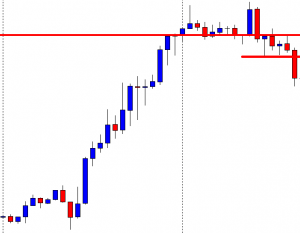
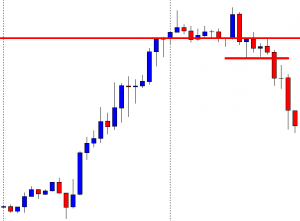
USD/JPY – Daily Analysis
The USD/JPY pair was closed at 105.317 after placing a high of 105.817 and a low of 105.240. Overall the movement of the USD/JPY pair remained bearish throughout the day. The USD/JPY pair failed to cheer the Chinese Yuan depreciation and U.S. dollar strength on Monday and continued decline over the fresh hopes that the U.S. stimulus aid package will be delivered before the elections.
The people’s Bank of China removed a 20% reserve requirement ratio for yuan forward settlements that undermined the cost of shorting yuan and weighed on the Chinese currency. But investors failed to take advantage of this depreciation in yuan, and the pair USD/JPY remained depressed in the market.
The rising number of coronavirus cases worldwide and the increased restrictions to curb the coronavirus pandemic’s effect raised the safe-haven appeal and supported the Japanese Yen that weighed on the USD/JPY pair. Meanwhile, the absence of key macroeconomic events due to the U.S. and Canada celebrating Columbus Day and Thanksgiving respectively exerted more pressure on the USD/JPY pair.
On the Japan front, the Bank Lending for the year was released at 04:50 GMT that remained flat at 6.4%. The Core Machinery Orders raised to 0.2% from the forecasted -1.0% and supported the Japanese Yen that weighed on the USD/JPY pair. Whereas, the PPI for the year from Japan decreased to -0.8% against the forecasted -0.5%. At 10:58 GMT, the Prelim Machine Tool Orders for the year remained flat at -15.0%.
Furthermore, the newly proposed U.S. stimulus measure of $1.8 trillion by Trump also faced rejection from both parties. In response to this, the Trump administration asked Congress to provide Americans with a small relief fund specifically for airlines and small businesses before elections.
The hopes that a small package could be passed before elections and a massive stimulus package after elections weighed on the U.S. dollar and added further losses in the USD/JPY pair on Monday.
Moreover, the White House physician Sean Conley said that U.S. President Donald Trump was free of transmission risk to others on Saturday. On Sunday, Trump claimed that he was now immune from the coronavirus, but the chances to get infected remained again. Trump was tested positive for coronavirus on first October, and he has been getting medical assistance since then. The news that Trump was getting better and has no transmission risk raised risk sentiment and capped further losses in the USD/JPY pair by weighing on safe-haven Japanese yen.
Daily Technical Levels
105.05 105.70
104.82 106.12
104.40 106.36
Pivot point: 105.47
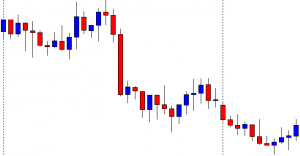
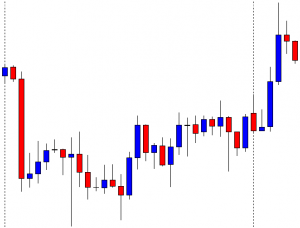
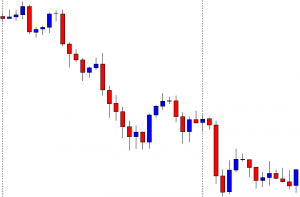
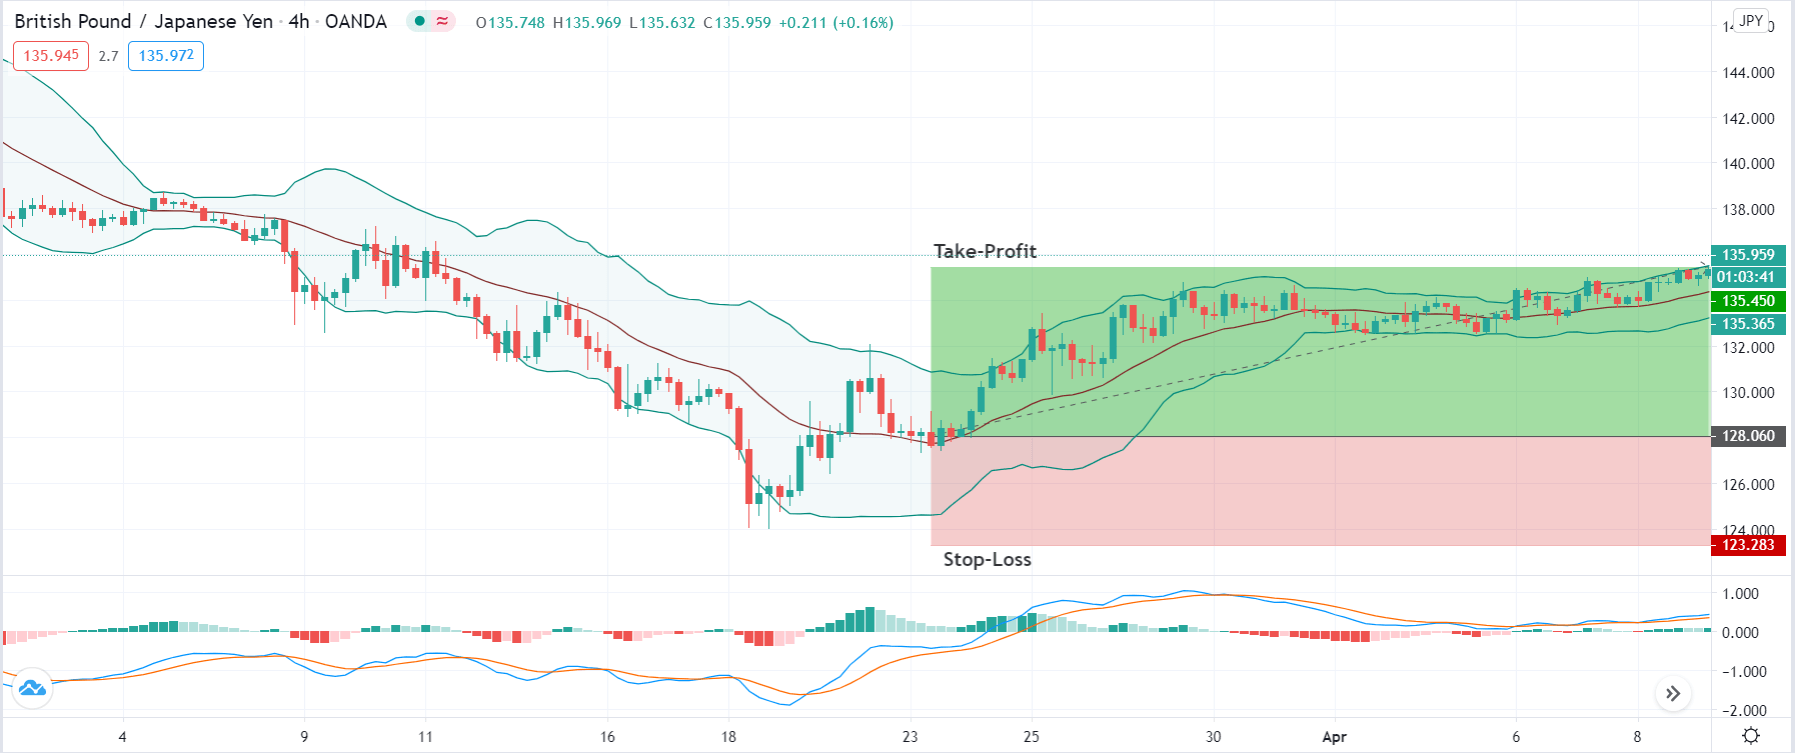
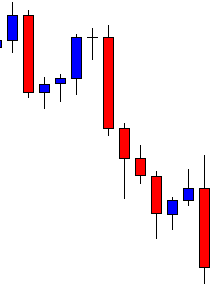
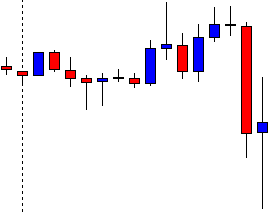
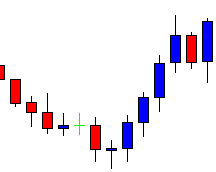
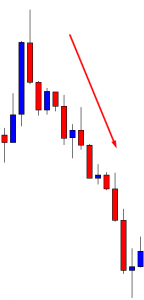
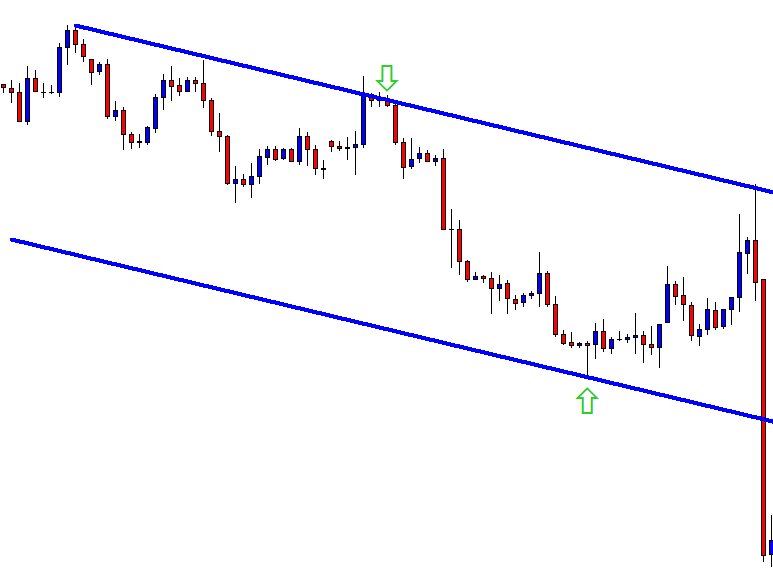
USD/JPY – Trading Tips
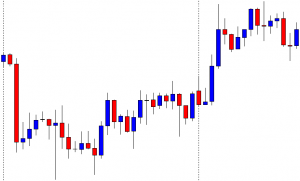
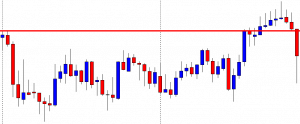
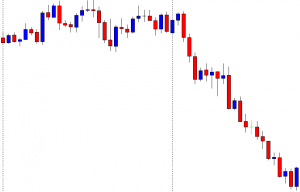
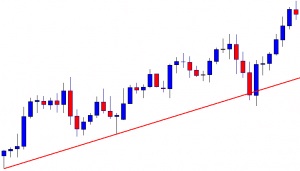
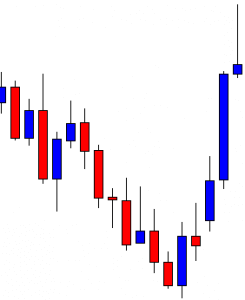
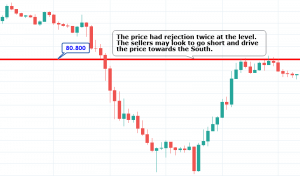
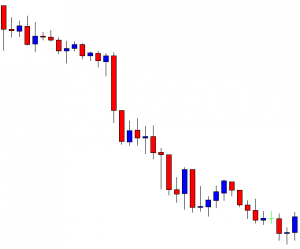
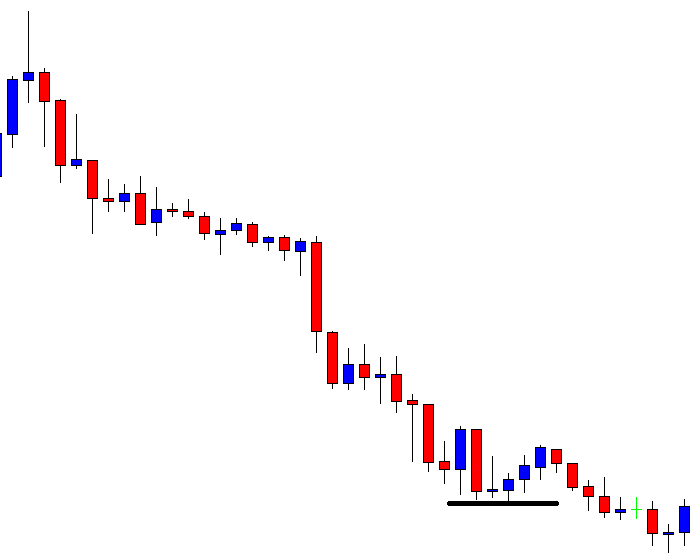
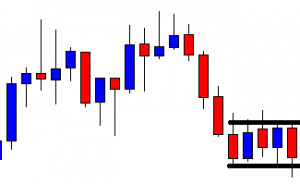
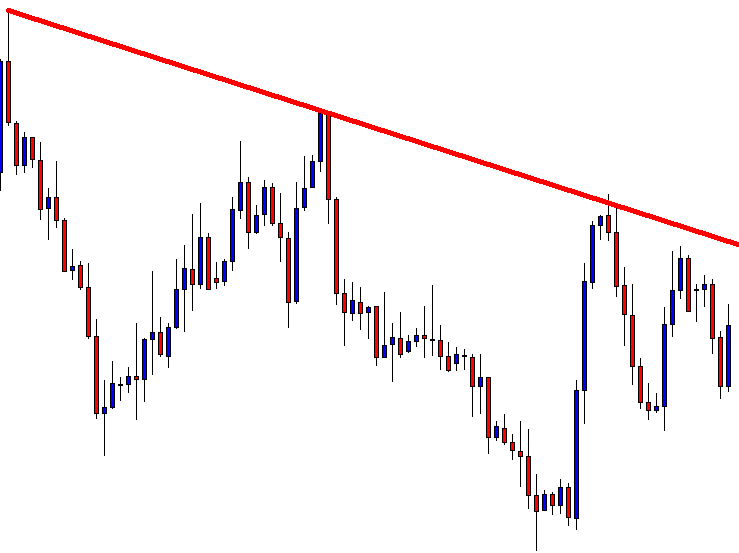
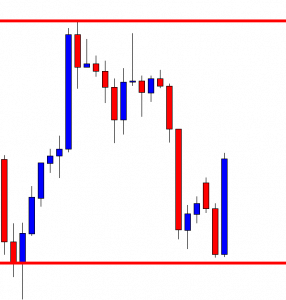
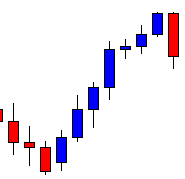
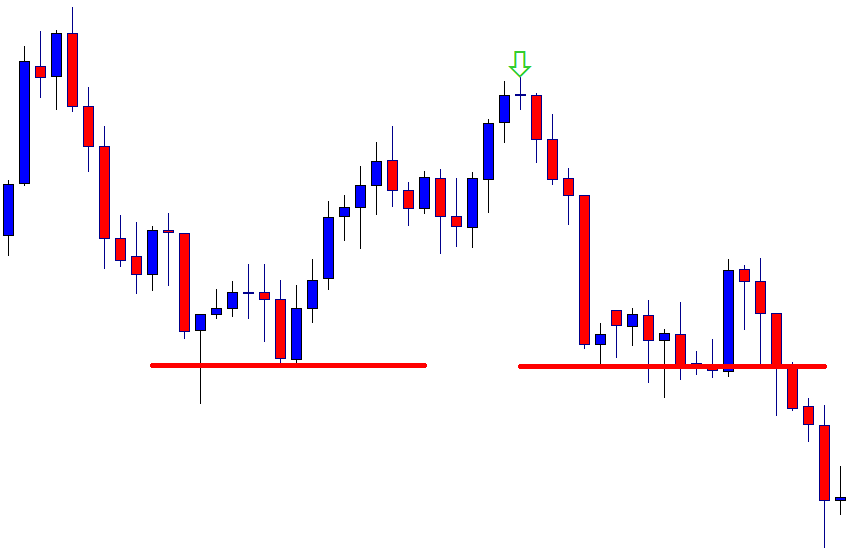
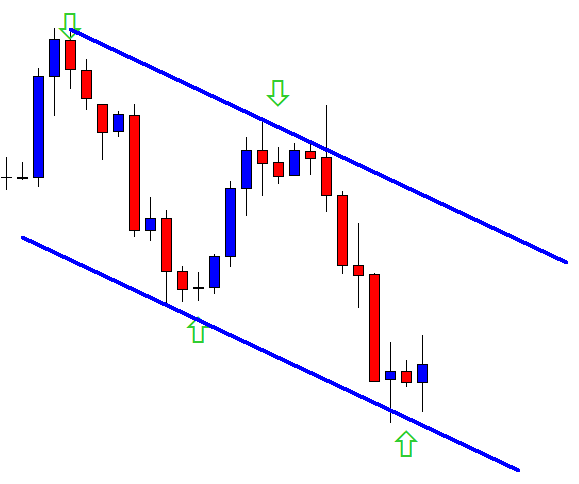
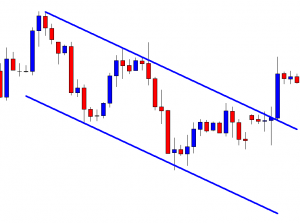
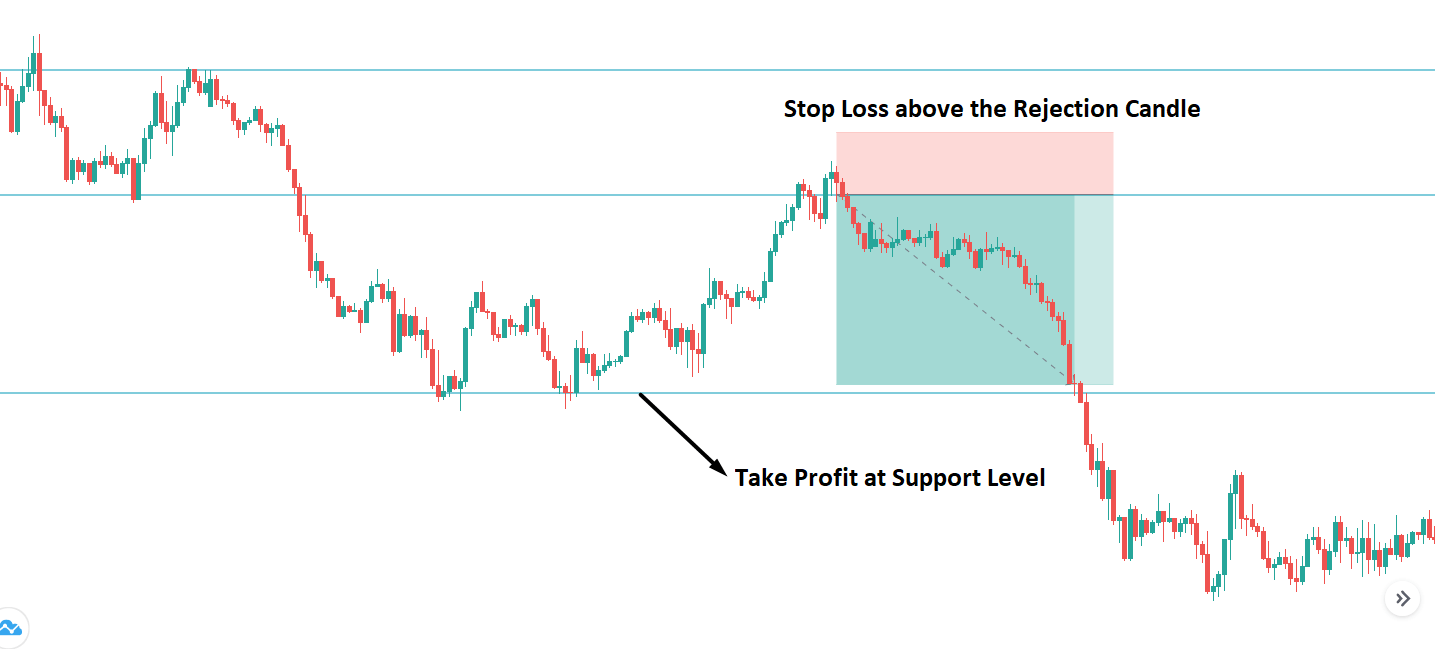
On Tuesday, the USD/JPY traded sharply bearish to drop from 105.900 level to the 105.450 mark. Most of the selling triggered after the USD/JPY violated an upward channel at 105.900 level. Currently, the USD/JPY pair is trading at 105.459 level, the support level that’s extended by double bottom level. A bearish breakout of 105.450 level may drive further selling until the 105.070 support level as the MACD, and the 50 periods EMA are in support of selling bias today. Let’s consider opening sell trade below 105.40 level today. Good luck!