Unlike stock and futures traders, most retail Forex traders are not yet able to rely on volume data as an indicator to determine when to enter and when to exit operations. This is regrettable, as volume data can be much more predictive about future price movements than the same technical analysis based on pure price. There may be ways to get a better idea of where you are making the purchase and sale beyond what is already known.
There are three possible sources of volume information that a trader should be able to use in their operations. Let us take a look at how easy it is to access such information, going from the most difficult to the simplest.
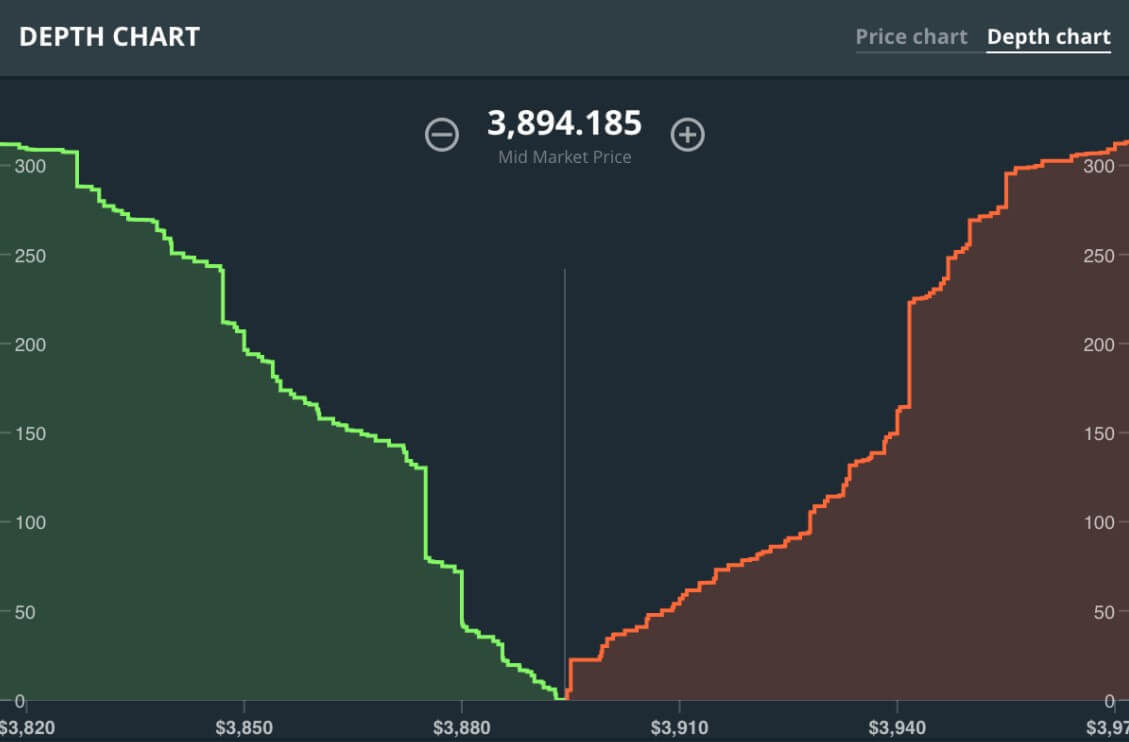
Depth of Market (DOM)
Few Forex brokers offer this feature, although ECN brokers do offer it often. This function shows, at a given time, the outstanding orders to buy or sell an asset and at what price. It is usually a “staircase” chart, with the quantities shown against each price above and below the current market price. Some versions also include a “market profile“, which visualizes the quantity that has already been bought or sold so far during the session.
It is important to note that since there is no central market in the Forex spot, the data presented in the Depth of Market will logically be limited to the broker offering that function. It follows that the greater the volume handled by a given broker, the more accurate the data it presents. This is why many traders who use this information largely prefer to trade on major futures exchanges, where foreign exchange futures are traded in large quantities through a centralized entity. Usually, the Forex spot is not as liquid, but more reliable volume data is concentrated there.
So the Depth of Market is useful in Forex trading? Almost all professionals in the foreign exchange market will tell you that it is an essential tool in undertaking very short-term transactions. In fact, they will also tell you that it is much more useful than a typical technical graph. The reason is that you can very easily see, looking at how many orders have been placed at each price, which is moving the financial market at the moment: the buyers or sellers, or whether a market is finely balanced or simply relatively inactive.
What is expected for retail traders is to wait for larger orders to enter and enter as close to those orders as possible, on the backs of the big players. After all, prices are driven by high volume orders that inevitably come from big players, not from small traders. The best trading strategy for small traders is to track the flow of elephants who are winning the fight in the market at any time.
Let’s talk about the fundamentals of strategy:
When you see large sales orders a few ticks above and large purchase orders a few ticks below, you have a range for trading. Of course, it’s not as simple as that, because “false” orders can be entered and removed in the blink of an eye: not all incoming orders are executed. In theory, spoofing is illegal, but you don’t read in the news about a large number of successful prosecutions!
However, in general, looking at a Depth of Market staircase chart will give you valuable information on how a market really works, and, of course, can be used in conjunction with technical analysis, being the volume of orders a kind of confirmation that a technical tipping point or breaking level is actually having the expected effect on price.
Royal Volume
Every day more foreign exchange brokers design to offer real volume indicators in their graphics software. The information is not as accurate as the Depth of Market and, as I mentioned before, the bigger the broker the better, but it can be useful and is the second-best option. If the broker divides the volume indicated into purchase and sale, you can see in each individual time period not only the amount of purchase and sale but also check if more was sold or if more were purchased. So, for example, if the price is rising to the level at which you think you’re going to spin and see that the volume of sale becomes heavier than the volume of purchase, this can give you a short entry more likely.
Tick Volume
Most Forex brokers do not yet offer the Depth of Market or Real Turnover. So there’s always some substitute for data that could be useful and widely available? The answer is truly yes to both questions, but this is an area that needs to be addressed with extreme caution. This point needs to be re-emphasized: The signal volume is definitely NOT the same as the actual size volume! It is quite true that there have been some studies that suggest that there is a positive correlation between the two, but the theory is far from proven.
There are a number of indicators available on most chart platforms, for example, the volume indicator on balance. All of them are essentially variants of the Tick Volume, so we recommend the use of a pure Tick Volume indicator. If you are using Metatrader4, it is easy to find some useful Tick Volume indicators to download that color candles on the screen depending on whether they have relatively high or lower Tick volumes. Some of them can really do a lot more than that, as I will explain at the end of the article.
The Tick Volume is only the number of price movements made by the Tick graph in the period of time covered by the sail. It is not accurate and does not necessarily reflect the actual volume, but a large Tick volume on a support or resistance level provided can in fact give you a hint on the future direction of prices.
Many indicators for the widely used and extremely popular Forex Metatrader 4 platform have been developed and are in free circulation depending on signal volume. The best of these various colored indicators on each Japanese candle on a table depending on the volume of the signal that occurred while each candle was building. It calculates an average Tick Volume per instrument per unit time and marks particular candles as significant if the Tick Volume during that candle was at least a particularly positive multiple of the average Tick Volume over time.
Some of these indicators also include a way of recognizing particularly bullish or bassist candles based on the size of the range of candles, and when a particular candle has both an unusually large range and an unusually large Tick Volume, the candle gets a special mark which shows that it is likely to be the beginning of a great reversal. Of course, the correct selection of the beginnings and ends of major reversals must be a quick route to Forex gain, although these indicators are far from infallible.