All that glitters is not gold, they say. The same often applies to everything that is popular. And, if nothing else, ADX is one of the more popular indicators on the market.
Still, is there a way for us to use this tool effectively?
Traditional ADX Indicator
The average directional index (ADX) was developed more than 40 years ago. Nowadays, this tool is typically used by technical traders to measure volume.
ADX consists of two main components – the ADX line and Directional Index (DI). The indicator aims to show trend strength and trend direction.
ADX line
The ADX line is a single line with a range of 0—100.
As this line is non-directional, it can only show trend strength. Therefore, while it measures the strength of the trend, it cannot distinguish between uptrends and downtrends.
So, the ADX line will rise during both a strong uptrend and a strong downtrend.
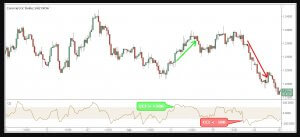
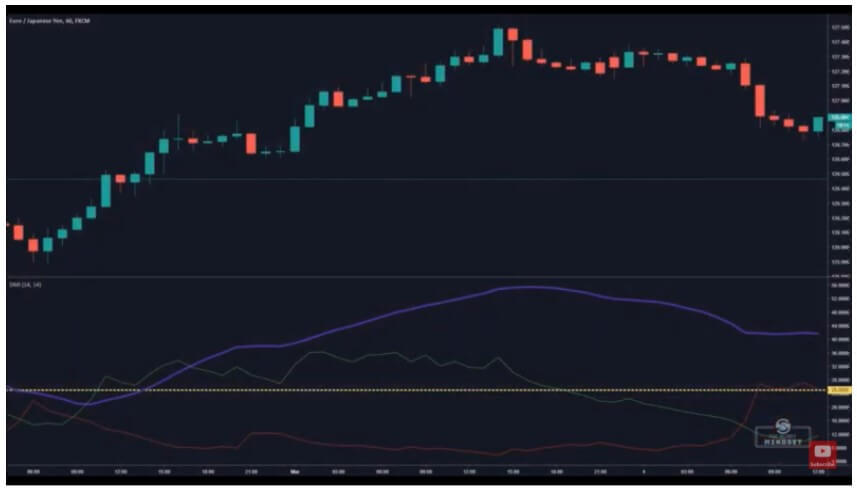
When the ADX is above 25 (like in the image below), the trend is strong enough to apply trend following strategies. However, traders who want to get faster signals often use the 20 ADX threshold as well.
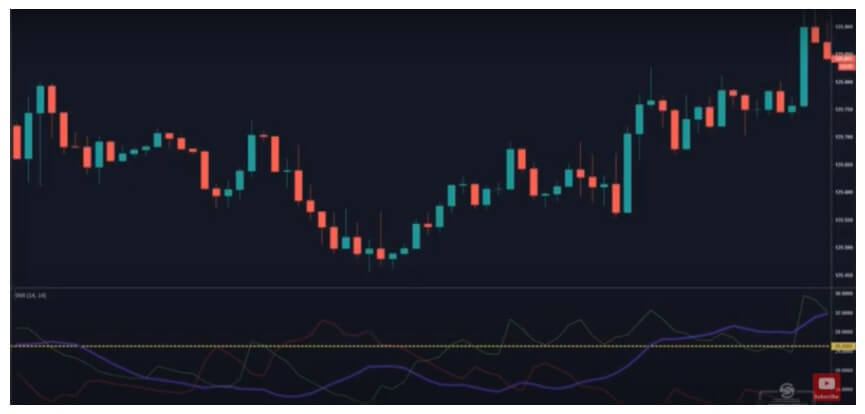
When ADX is below 25, the market is in the consolidation stage. The image below portrays this well and, as we can see, there is a lack of a trend. With trends involving ADX below 25, we can no longer apply trend trading strategies but the strategies for ranging markets.
Directional Index
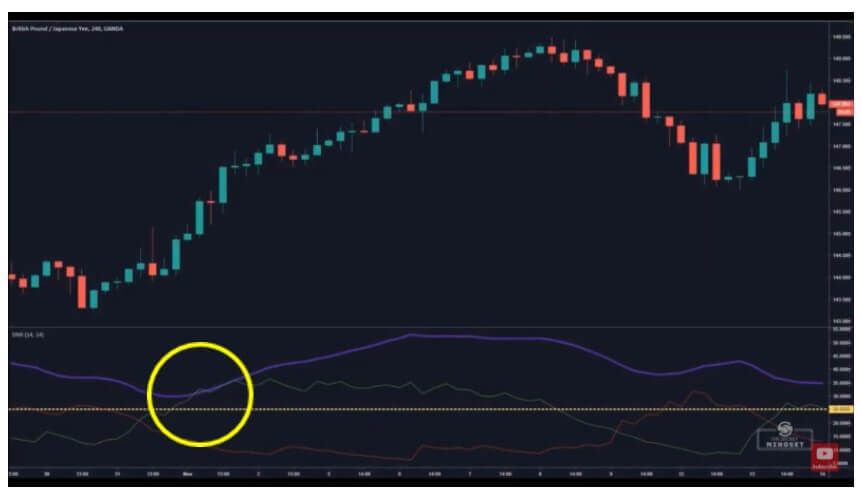
When the ADX is above 25 and the positive directional indicator (+DI) is above the negative one (-DI), the ADX measures the strength of an uptrend. The cross between the two DIs, together with the ADX line that is higher than 25, resulted in an excellent bullish move.
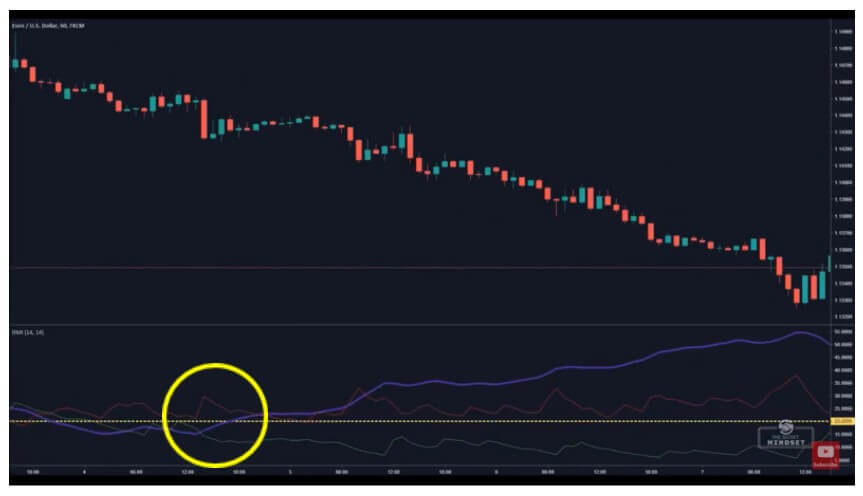
When the ADX is above 25 and +DI is below -DI, the ADX measures the strength of a downtrend.
Values higher than 50 ADX indicate a very strong trend.
Important Facts
ADX should only be used with higher time frames because it tends to give false information on lower time frames.
The ADX has a tendency to lag and the volume meter is generally very slow, which can lead you to enter the market too late.
The strategies used with the traditional ADX alone are insufficient and can offer a lot of false signals, but the ADX indicator can be used with other tools to obtain better signals.
Alternative ADX Uses
ADX + MA
ADX can serve as an example of how you can apply the moving average (MA) to a volume indicator.
In the example below, we removed the ADX line (25) and added the MA, keeping the period at 10.
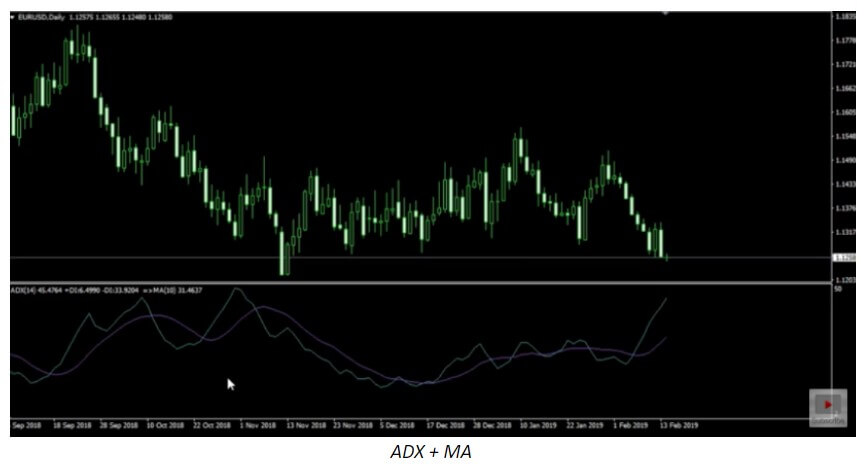
As ADX does not perform well during market consolidation, it would take a lot of time to go below that line and inform the trader that it is not a good time to trade. That is why traders take many losses with ADX alone when the market goes sideways.
Although this combination is not the best tool you can use, ADX has proved to perform better after the changes have been made.
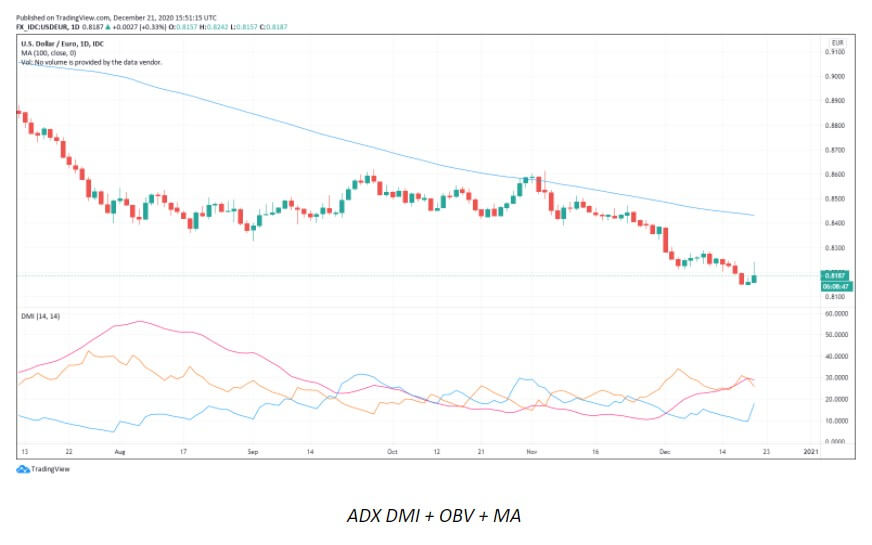
ADX DMI + OBV + MA (100)
OBV (on-balance volume) shows whether the volume in the market is flowing in or out of the instrument.
The moving average (MA) of 100 is applied to determine is the momentum in the market is bullish or bearish.
A signal to enter appears when the two indicators indicate the same thing.
This strategy, however, always requires higher time frames as well as an instrument with some volatility and a high ATR.
Needless to say, traders must always use risk and money management skills to protect their trades from false signals and limit any potential losses.
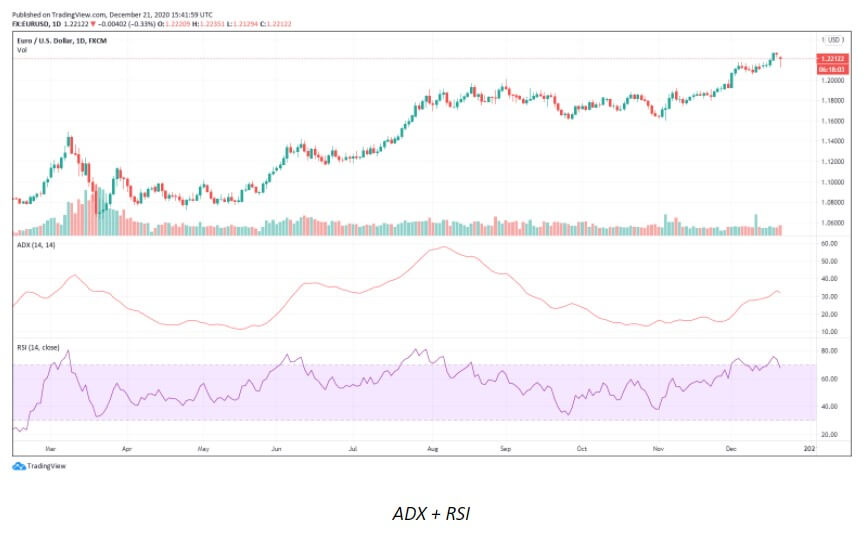
ADX + RSI
Wait for the reading to get the ADX of 25 to know you are in a strong trend and that the trend is likely to develop.
Use the last 50 candlesticks to determine the trend. Therefore, if the price is heading lower during the last 50 candlesticks, you are in a bearish trend.
We will ignore the typical rule for using the Relative Strength Index (RSI) as we normally interpret the RSI reading below 30 as an oversold market and a reversal zone. To get an entry signal, use the same settings for both RSI and ADX.
Sell when the RSI indicator breaks, showing a reading below 30.
We will also add a stop loss for maximum protection. To determine the best location for your stop loss, find the last high of ADX before the entry. Then, identify the corresponding high on the price chart from the ADX high and place your stop-loss point there.
We will take profit after the ADX indicator breaks back below 25, which tells us that the strength of the prevailing trend is decreasing. You can also consider RSI going back into the normal zone as the exit point.
For a buy strategy, apply the exact opposite.
Non-Traditional ADX Indicators
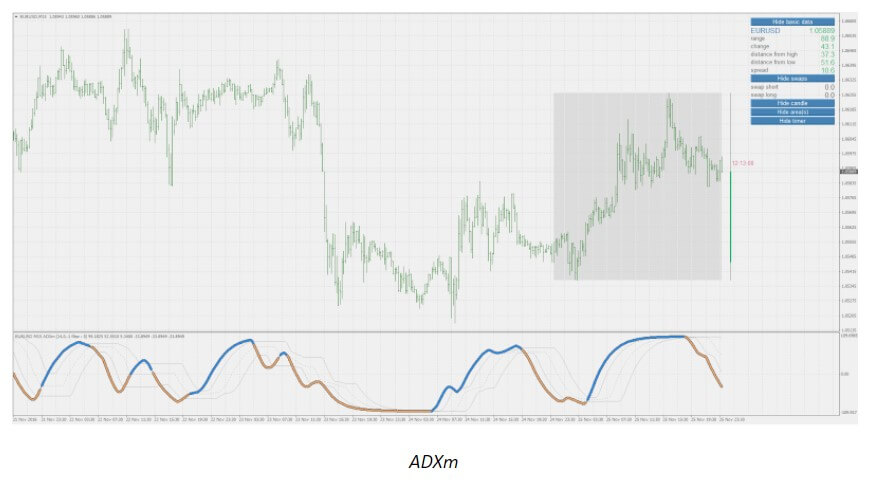
ADXm
Unlike the traditional ADX indicator, which makes it hard to see where the market is headed, ADXm clearly shows both positive and negative ADX half-waves (colored parts of the line in the chart below).
ADXm uses the same method as the traditional ADX. We will use a reading of 20 to 25, depending on the time frame.
The original and this improved version differ with regard to price options. While the traditional ADX offers no price options (i.e. it uses fixed close, high, and low for circulation), ADXm allows traders to use three prices – the price for close, high, and low.
Still, there are also many similarities between the two (e.g. the results, if default parameters are used).
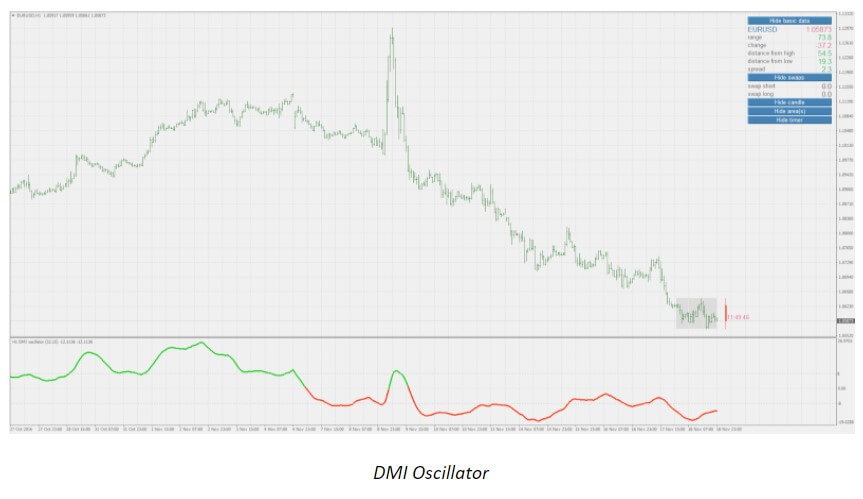
DMI Oscillator
The original ADX uses SMMA (i.e. running MA or Wilders EMA), while DMI Oscillator allows traders to experiment with the other types of averages as well.
The improved version also lets traders smooth the results of the oscillator. Moreover, it offers three different color options – on levels cross, zero cross, and slope. Change alerts are triggered according to the trader’s choice of color.
Traders seem to love DMI Oscillator because they can apply different strategies (scalping, swing trading, short term trading, binary trading, etc.) on different time frames and regardless of candle behavior.
Conclusion
The ADX indicator is great for determining trend strength – both bulls and bears at the same time.
While it is good for identifying trending conditions, the traditional version of this tool may lag quite a lot. Not only does it often cause traders to enter trades too late but it also gives too many false signals, which then result in losses.
The daily time frame is the best option for using the ADX because it offers the least amount of inconsistency and incorrectness.
The best profits come from catching strong trends and, with the right ADX strategy, you can accomplish your trading goals.
Since the standard version of ADX does not contain all data for the analysis of price action, it must be either used with other tools/indicators or simply replaced by a more recent, modified version.
It is extremely important to note that ADX (in particular) requires traders to rely on money management and risk management – especially with the original version. As Peter Borish says, we want to perceive ourselves as winners, but successful traders are always focusing on their losses. We cannot let the possibility of getting a false trend stand in the way of our (and our account’s) growth.
Finally, all indicators are just tools. We should use them only if they benefit us. Test ADX as well as all other ADX versions and tool combinations, and leave out anything that you feel you cannot use optimally.