When we analyze and evaluate the performance of a financial asset or trading system, we usually focus on the profits that it produces over a period of time and forget about a no less important question: what is its associated risk? Undoubtedly we want to have a winning trading system, which generates profits, but we must not forget the star parameter: risk. As you know, there are enough ratios to measure our trading strategies, but in this article, we will discuss the Sharpe ratio at length.

Ratio or Sharpe Coefficient
The Sharpe ratio was developed by Nobel laureate William Sharpe and is one of the most widely used ratios for evaluating and comparing financial assets or trading systems. To do this, it analyzes the return on an investment taking into account the risk of that investment, which allows us to determine if the profitability of our trading strategy is due to a really good system or, on the contrary, we have taken a lot of risks.
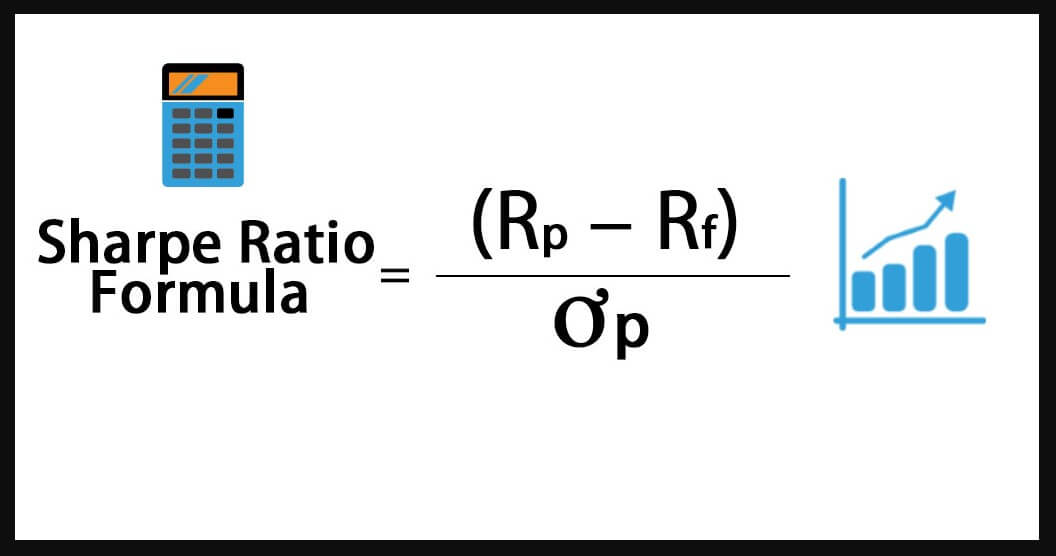
The calculation of the Sharpe ratio is quite simple and is defined as the annualised return of the trading system (fund, portfolio, etc.) minus the risk-free return and divided by standard deviation or standard deviation. The formula is as follows:
- Sharpe ratio = (rp – rf) / σp
Where:
- rp: average return on the financial asset.
- rf: average return on a risk-free portfolio (risk-free return).
- σp: standard deviation of portfolio profitability.
In case you have any doubt about these three parameters, here is a simple way:
The average return on the asset: is the expected return on the asset in the selected period, which can be a year, a month, or a day.
Risk-free yield: these are the short-term public debt obligations (bonds, treasury bills, etc.) of a geographical area similar to that of the asset we wish to assess. This is the minimum return an investor can obtain in the market.
Standard deviation. In short, the standard or standard deviation measures as soon as returns deviate from their average.
Interpreting the Sharpe Ratio
As I have already mentioned in other posts, the most important thing when we use statistical metrics to evaluate a trading strategy is the correct interpretation and understanding of the values obtained. Basically, the value of this ratio can be classified into three possible scenarios:
Ideally, the value of the Sharpe ratio should be equal to or greater than 1. The higher the Sharpe ratio, the better the return relative to the risk assumed when making the investment.
If the value is between 0 and 1, the strategy is not optimal, but it could be used.
If the Sharpe ratio is less than 0, we should not use the strategy or portfolio we are evaluating. The negative Sharpe ratio means that the risk-free asset is more profitable than the risk-bearing asset.
In addition to interpreting the numerical value of this ratio, the Sharpe coefficient allows us to:
- Compare the risk-benefit ratio between different investment opportunities.
- Select the most attractive strategy from the point of view of risk, with the same performance.
Disadvantages or Limitations of the Sharpe Ratio
As I told you before, there are no perfect metrics and each has its limitations. In this sense, the Sharpe ratio is no exception and among the main disadvantages you can mention are the following:
- Does not distinguish between consecutive losses and intermittent losses.
- The Sharpe ratio does not depend on the order of the sample and it is not the same to lose 10 consecutive times as alternately.
So that you understand better, I will explain with an example:
Suppose we evaluate two strategies during a year, both strategies had 6 months of profits and 6 months of losses. Strategy A had alternating gains while strategy B had 6 months of losses and then 6 months of gain, as shown below.
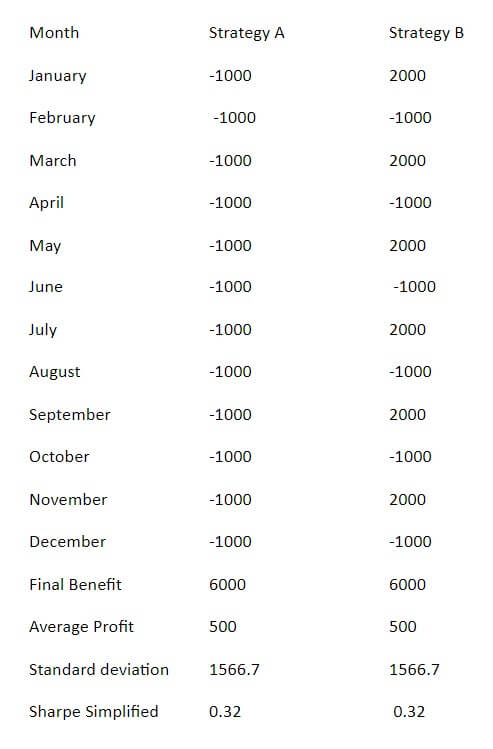
If we analyze both systems, we see that the two have the same mean benefit and the same standard deviation, therefore, the same simplified Sharpe ratio. But if we look at the cumulative profit graph, it’s not hard to realize that strategy A has a more regular or stable cumulative profit curve than strategy B, I would therefore choose to select strategy A over strategy B despite having the same Sharpe coefficient.
Another weakness of using the Sharpe ratio is that when we use the standard deviation of profitability to calculate risk, there is no difference between bullish or bearish volatility. The volatility of a trading strategy allows us to measure or predict the performance of that strategy. So the more volatility the expected returns will be more inconsistent.
Sharpe’s ratio is very useful only when compared to another trading or investment strategy. Let’s look at an example for you to understand me better: Suppose we evaluate a strategy or portfolio and the Sharpe ratio is equal to 1, this value is pretty good. We now evaluate a second portfolio and its Sharpe ratio is equal to 3.5. Although the first strategy has a good Sharpe ratio, the second strategy has a better ratio and this makes it more attractive to choose some of them on equal terms
Simplified Sharpe Ratio
Many times instead of using the Sharpe ratio, according to the formula I described above, it is common to use a simpler version known as the simplified Sharpe ratio. The formula for its calculation is as follows:
Simplified Sharpe ratio = mathematical hope/ standard deviation.
Because Mathematical Hope can be interpreted as the mean profit (net profit / total number of operations), then we can rewrite the formula as follows:
Simplified Sharpe Ratio = Average Benefit / Standard Deviation
Example of an evaluation of a strategy using the Sharpe ratio:
Suppose we have an investment strategy A, which has an annual return of 16% with a standard deviation of 9%. In addition, We have another investment strategy B with an annual return of 9% and a standard deviation of 3%. The risk-free return benchmark for these strategies will be Treasury bonds that have a return of 1%.
If we look only at the returns, it is very easy to see that strategy A is better than strategy B. However, we do not know the risks we have taken in strategy A to get that return. That is why we need to adjust profitability to risk and thus determine which strategy actually achieved the best return. We did this using the Sharpe ratio.
Let’s calculate the Sharpe ratio for strategy A:
Sharpe ratio = (rp – rf) / σp = (16 – 1) / 9 = 1.67
Let’s calculate the Sharpe ratio for strategy A:
Sharpe ratio = (rp – rf) / σp = (9 – 1) / 3 = 2.67
If we analyze the results, we realize that, according to the Sharpe ratio, the strategy that achieved the best return according to the risk assumed, was strategy B. For this reason, We must not always let ourselves be dazzled by the performance of a strategy; we must look at it from different points of view.
Conclusion: Is it Useful?
Finally, we can say that the Sharpe ratio can be used when we want to know the risk assumed when executing a certain strategy or investment, indicating whether the return obtained is due to an excess of risk. To get to the point, it allows us to compare the effectiveness of strategies.
If we are evaluating two trading strategies, the one with the highest Sharpe ratio is the best because it has a lower risk associated. The value of the Sharpe ratio of a strategy in itself is not so important, what matters is its comparison with the value of the ratio of other strategies.
As I have mentioned in other posts, I do not recommend that you base your trading decisions on the results of a single indicator or metric and the Sharpe ratio is no exception, do not use it alone. I personally consider that the Sharpe ratio is nowhere near the best trading measures you can take into account. For example, if you apply a system with lower stop loss and take profit compared to larger ones, the ratio will benefit the former, even if the latter has better statistics.
In addition, the issue of not taking into account positive volatility is a big point against. Having the same weight in positive and negative positions is a great limitation. We need realistic measures and a good X-ray of our trading. Which ones?
And one more thing, when comparing different strategies or portfolios keep in mind that these portfolios belong to exactly the same category, not make sense to compare radically different portfolios where it is more than evident the risks associated with each portfolio or strategy.